Functional Mushroom Market Analysis and Forecast for 2025 to 2035

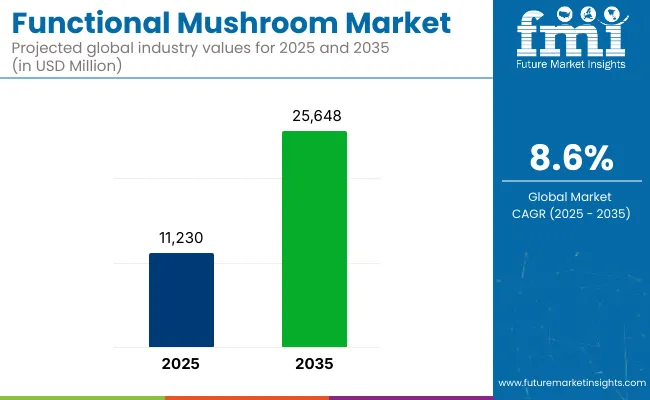
Between 2025 and 2035, the global market for functional mushrooms is expected to witness accelerated growth, increasing from USD 11,230 million to USD 25,648 million at a CAGR of 8.6%. This dynamic expansion is attributed to the rising demand for naturally sourced wellness ingredients that offer immune support, stress relief, and cognitive health benefits.
Quick Stats for Functional Mushroom Market

  • Industry Value (2025): USD 11,230 million
  • Forecast Value (2035): USD 25,648 million
  • Forecast CAGR: 8.6%
  • Leading Segment in 2025: Reishi Mushroom (31.4% share)
  • Key Growth Region: Asia-Pacific, North America, Europe
  • Top Key Players: Nammex, Four Sigmatic, Real Mushrooms, Host Defense, FreshCap Mushrooms

Functional Mushroom Market

Attributes Description
Estimated Market Size (2025E) USD 11,230 million
Projected Market Value (2035F) USD 25,648 million
Value-based CAGR (2025 to 2035) 8.6%

Functional mushrooms have steadily transitioned from niche applications to mainstream formulations across supplements, beverages, and snacks, driven by widespread consumer trust in their adaptogenic and anti-inflammatory potential.

Market expansion is being reinforced by an evolving landscape of health-conscious consumers who are increasingly seeking clean-label and plant-based solutions. Brands are responding by diversifying formulations with clinically supported mushroom species such as reishi, lion’s mane, and cordyceps.

Although regulatory ambiguities in some countries continue to pose challenges, product innovation across formats-from capsules and tinctures to functional teas and RTD drinks-is supporting market penetration. Key trends include the infusion of mushrooms in protein blends, beauty-from-within formats, and even pet supplements.

Manufacturers are scaling their extraction technologies and partnering with mycological experts to achieve standardization and quality assurance. However, fragmented supply chains and the need for consumer education around efficacy remain mild restraints.

Future growth will be guided by increased scientific validation and the incorporation of functional mushrooms into preventive health strategies. By 2025, supplements will continue to command the largest market share, but by 2035, fortified foods and beverages are projected to gain stronger ground due to convenience-driven consumption shifts.

Asia-Pacific and North America are forecast to remain dominant regions, supported by traditional usage patterns and rising nutraceutical investments. The market is poised to benefit from both biotech innovation and cross-industry collaborations aimed at improving ingredient delivery and functional benefits.

Analyzing Functional Mushroom Market by Top Investment Segments

Strategic Relevance of Functional Mushroom in Animal Health Supplements

Animal health supplements account for an estimated 6.2% share of the global functional mushroom market in 2025. This segment is gaining traction as veterinary nutritionists and pet wellness brands turn to adaptogenic mushrooms to enhance immunity, cognitive function, and stress resilience in animals. Reishi and lion’s mane extracts are increasingly being used in canine and feline supplements targeting inflammation and cognitive aging, respectively.

Brands like Natural Pet Innovations and Nordic Naturals have incorporated mushroom-derived compounds into chewables and powdered formulations tailored for senior pets and anxious breeds. In the USA, regulatory guidance by the Association of American Feed Control Officials (AAFCO) has prompted clearer labeling practices and ingredient disclosures for such novel inclusions.

The segment’s growth is further supported by the rising trend in humanization of pets, where owners actively seek evidence-backed, holistic care. Despite regulatory fragmentation across markets and limited clinical trials in companion animals, the demand for functional mushroom-infused pet supplements is expanding.

Companies are expected to benefit by collaborating with veterinary professionals and adhering to local pet food standards such as those outlined by the European Pet Food Industry Federation (FEDIAF). Growth is anticipated to intensify in North America and Western Europe, where premium pet nutrition continues to command consumer attention.

Functional Cosmetics Emerge as a Strategic Innovation Zone

Functional cosmetics containing mushroom extracts constitute approximately 5.1% of the total functional mushroom market in 2025. This subsegment is strategically positioned at the intersection of clean beauty, dermocosmetics, and nutricosmetics. Key mushroom species such as tremella, chaga, and reishi are leveraged for their high polysaccharide content, antioxidant capacity, and hydrating properties.

South Korea, France, and Japan lead product innovation in this space, with cosmetic giants like Shiseido, Innisfree, and L’Oréal launching serums, masks, and creams infused with fungal actives. The regulatory landscape remains favorable, particularly under the European Commission’s Cosmetics Regulation (EC No 1223/2009), which permits these mushrooms as cosmetic ingredients subject to safety assessments.

The rapid shift toward plant-derived skincare ingredients is accelerating formulation development, especially in anti-aging and anti-pollution skincare categories. Leading brands are investing in clinical validation to demonstrate skin barrier repair and UV-protection claims, particularly with β-glucan-rich extracts.

Cross-category innovation is also visible in ingestible beauty products where mushrooms serve dual roles in topical and oral regimens. While scalability of extraction and standardization remain challenges, companies are mitigating these through biotech partnerships and improved cultivation techniques. This segment is poised to expand significantly in East Asia and Western Europe through e-commerce and dermocosmetic retail channels.

Challenges and Opportunities

Challenge

Standardization and Quality Control

The functional mushroom industry is beset by the problem of standardization and quality control. In a food supplement vs. drug situation, different food supplements are never really under strict regulation, and differences in potency and purity are sure to happen. Unstandardized cultivation and harvest procedures can compromise such highly active constituents as triterpenoids and beta-glucans.

The challenge is addressed by the firms with research-proven investment, third-party labelling, and pre-emptive cultivation procedures to ensure product quality and consumer confidence.

Opportunity

Personalized Nutrition and Functional Drinks Growth

Functional growth provides enormous opportunities to the business. Mushroom tea, mushroom elixirs, and mushroom coffee are gaining popularity because people are willing to include health-supporting ingredients in their lives to save time. Food businesses prepare ready-to-eat packs with mushrooms blended with adaptogens such as Ginseng and Ashwagandha to provide resistance to stress and energy.

Apart from that, progress in personalized nutrition supported by DNA-mediated health testing is fueling targeted supplementation. Mushroom business companies are emerging on this tide by offering targeted mixes for targeted health needs such that increased and targeted benefit transfer prevails.
Country-Wise Outlook

Functional Mushroom Market Country Wise Analysis

United States

The United States has experienced growth in the functional mushroom sector as increasingly more consumers desire wellness and health. Functional mushrooms have been added to foods like supplements, tea, and coffee. Mushroom coffees, for example, where companies like Four Sigmatic have created coffees with regular coffee beans flavored with lion's mane and chaga extracts to offer consumers value in addition to caffeine.

The market will be expanding exponentially depending on the pace of the explosion of demand by consumers for functional food, as well as the explosion of demand for medicinal mushrooms in an attempt to play catch-up with their health effects from health-conscious consumers.

Country CAGR (2025 to 2035)
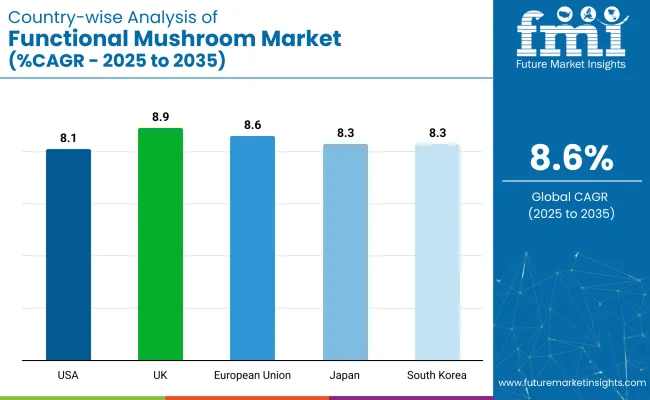
USA 8.1%

United Kingdom

In the United Kingdom, the functional mushroom market expanded as the newer generation of products emerged. Fungtn, for instance, launched a series of non-alcoholic craft beers that include functional mushrooms such as reishi, lion's mane, and chaga.

The beverages come with myco adaptogens that provide body, depth, and mouthfeel to the beer without the addition of additives, which is something not commonly seen in the non-alcoholic beer space. The United Kingdom non-alcoholic drinks market entry of functional mushrooms is anticipated to offer opportunities for market growth over the forecast period.

Country CAGR (2025 to 2035)
UK 8.9%

European Union

The European Union saw the greater use of functional mushrooms in skincare. Mushrooms will be the top skincare product in 2024 because they can stimulate plumper and firmer skin.

There are some mushroom species like reishi, snow mushroom, chaga, songyi, shiitake, and cordyceps, and every kind of mushroom has different uses for skincare from anti-inflammatory effect, moisturizing, collagen stimulation, and antioxidant effect. This is credited to heightened scientific interest, cross-reactivity to well-being, and sustainability at the forefront.

Country CAGR (2025 to 2035)
European Union 8.6%

Japan

Functional mushrooms in Japan have never been more in demand as a source of ancient and modern diet and supplements. History-driven mushroom consumption has laid the ground for the consumption of functional mushroom food products.

Lion's mane supplement, for example, is one of the supplements that are highly demanded compared to others due to the potential impact of its activity on brain function in relation to the emphasis on brain health among Japanese citizens. Functional mushroom business also has high demand in specialty chemicals business, where it is utilized as a lead catalyst in chemical and polymer synthesis.

Country CAGR (2025 to 2035)
Japan 8.3%

South Korea

South Korea's functional mushroom market has expanded with mushroom use in beauty and skincare. Mushrooms are also 2024 skincare essentials because they stimulate plumper, firmer skin. Mushrooms are of varied species, such as reishi, snow mushroom, chaga, songyi, shiitake, and cordyceps, with varied skin benefits such as anti-inflammatory, moisturizing, collagen stimulation, and antioxidant.

Country CAGR (2025 to 2035)
South Korea 8.3%

Competitive landscape

The functional mushroom industry is a competitive industry with industry-leading players and local producers based on industry growth. Industry leaders occupy premium market share positions based on innovation in extraction technology, formulation, and sustainable sourcing.

The industry is focusing on the growing demand for functional mushrooms from the nutraceuticals, food and beverages, and cosmetics sectors. The industry has mature and new players that dominate industry trends by undertaking research, technology, and market development activities.

Companies

  • Nammex
  • Four Sigmatic
  • Host Defense
  • Real Mushrooms
  • FreshCap Mushrooms
  • Oriveda
  • Rainbo
  • Aloha Medicinals
  • Hifas da Terra
  • Gaia Herbs
  • Others

Key Segmentation

By Product Type:

  • Reishi
  • Cordyceps
  • Lion’s Mane
  • Chaga
  • Turkey Tail
  • Tremella
  • Shiitake
  • Maitake
  • Others

By Application:

  • Dietary Supplements
  • Functional Foods
  • Functional Beverages
  • Animal Health Supplements
  • Cosmetics & Personal Care
  • Others (e.g., biopharmaceuticals, soil enhancers)

By Sales Channel:

  • Online Retailing
  • Supermarkets/Hypermarkets
  • Specialty Stores
  • Pharmacies/Drugstores
  • Direct-to-Consumer (DTC)

By Form:

  • Capsules
  • Powders
  • Extracts/Tinctures
  • Gummies
  • RTD Beverages
  • Creams/Serums

By Functionality:

  • Immunity Support
  • Stress Relief
  • Cognitive Health
  • Anti-Aging & Skin Health
  • Energy & Stamina
  • Anti-Inflammatory

By Product Claim:

  • Vegan
  • Organic Certified
  • Non-GMO
  • Clean Label
  • Clinically Backed
  • Adaptogenic

By Region:

  • North America
  • Latin America
  • East Asia
  • South Asia & Pacific
  • Eastern Europe
  • Western Europe
  • Middle East & Africa

Table of Content

  1. Executive Summary
  2. Industry Introduction, including Taxonomy and Market Definition
  3. Market Trends and Success Factors, including Macro-economic Factors, Market Dynamics, and Recent Industry Developments
  4. Global Market Demand Analysis 2020 to 2024 and Forecast 2025 to 2035, including Historical Analysis and Future Projections
  5. Global Market Analysis 2020 to 2024 and Forecast 2025 to 2035
    • Nature
    • Product Species
    • Form
    • Application
  6. Global Market Analysis 2020 to 2024 and Forecast 2025 to 2035, By Nature
    • Organic
    • Conventional
  7. Global Market Analysis 2020 to 2024 and Forecast 2025 to 2035, By Product Species
    • Reishi
    • Shiitake
    • Lion's Mane
    • Chaga
    • Maitake
    • Cordyceps
    • Tremella
    • Turkey Tail
    • Enokitake
    • Oyster Mushrooms
    • Others
  8. Global Market Analysis 2020 to 2024 and Forecast 2025 to 2035, By Form
    • Liquid Sprays and Drinks
    • Powders
    • Capsules or Supplements
    • Others
  9. Global Market Analysis 2020 to 2024 and Forecast 2025 to 2035, By Application
    • Food & Beverages
    • Nutraceuticals & Dietary Supplements
    • Pharmaceutical
    • Sports Nutrition and Functional Items
    • Cosmetics & Personal Care
    • Pet Care Industry
    • Other Applications
  10. Global Market Analysis 2020 to 2024 and Forecast 2025 to 2035, By Region
    • North America
    • Latin America
    • Western Europe
    • Eastern Europe
    • East Asia
    • South Asia Pacific
    • Middle East and Africa
  11. North America Sales Analysis 2020 to 2024 and Forecast 2025 to 2035, by Key Segments and Countries
  12. Latin America Sales Analysis 2020 to 2024 and Forecast 2025 to 2035, by Key Segments and Countries
  13. Western Europe Sales Analysis 2020 to 2024 and Forecast 2025 to 2035, by Key Segments and Countries
  14. Eastern Europe Sales Analysis 2020 to 2024 and Forecast 2025 to 2035, by Key Segments and Countries
  15. East Asia Sales Analysis 2020 to 2024 and Forecast 2025 to 2035, by Key Segments and Countries
  16. South Asia Pacific Sales Analysis 2020 to 2024 and Forecast 2025 to 2035, by Key Segments and Countries
  17. Middle East and Africa Sales Analysis 2020 to 2024 and Forecast 2025 to 2035, by Key Segments and Countries
  18. Sales Forecast 2025 to 2035 by Nature, Product Species, Form, and Application for 30 Countries
  19. Competition Outlook, including Market Structure Analysis, Company Share Analysis by Key Players, and Competition Dashboard
  20. Company Profile
    • Half Hill Farm
    • Real Mushrooms
    • Pan’s Mushroom Jerky
    • Yuguo Farms
    • Organic Mushroom Nutrition
    • Rebbl
    • Kettle and Fire
    • Nammex
    • Mitoku Company Ltd
    • Hokkaido Reishi Co. Ltd

List of Tables

  • Table 1: Global Market Value (USD Million) Forecast by Region, 2020 to 2035
  • Table 2: Global Market Volume (MT) Forecast by Region, 2020 to 2035
  • Table 3: Global Market Value (USD Million) Forecast by Nature, 2020 to 2035
  • Table 4: Global Market Volume (MT) Forecast by Nature, 2020 to 2035
  • Table 5: Global Market Value (USD Million) Forecast by Product Species, 2020 to 2035
  • Table 6: Global Market Volume (MT) Forecast by Product Species, 2020 to 2035
  • Table 7: Global Market Value (USD Million) Forecast by Form, 2020 to 2035
  • Table 8: Global Market Volume (MT) Forecast by Form, 2020 to 2035
  • Table 9: Global Market Value (USD Million) Forecast by Application, 2020 to 2035
  • Table 10: Global Market Volume (MT) Forecast by Application, 2020 to 2035
  • Table 11: North America Market Value (USD Million) Forecast by Country, 2020 to 2035
  • Table 12: North America Market Volume (MT) Forecast by Country, 2020 to 2035
  • Table 13: North America Market Value (USD Million) Forecast by Nature, 2020 to 2035
  • Table 14: North America Market Volume (MT) Forecast by Nature, 2020 to 2035
  • Table 15: North America Market Value (USD Million) Forecast by Product Species, 2020 to 2035
  • Table 16: North America Market Volume (MT) Forecast by Product Species, 2020 to 2035
  • Table 17: North America Market Value (USD Million) Forecast by Form, 2020 to 2035
  • Table 18: North America Market Volume (MT) Forecast by Form, 2020 to 2035
  • Table 19: North America Market Value (USD Million) Forecast by Application, 2020 to 2035
  • Table 20: North America Market Volume (MT) Forecast by Application, 2020 to 2035
  • Table 21: Latin America Market Value (USD Million) Forecast by Country, 2020 to 2035
  • Table 22: Latin America Market Volume (MT) Forecast by Country, 2020 to 2035
  • Table 23: Latin America Market Value (USD Million) Forecast by Nature, 2020 to 2035
  • Table 24: Latin America Market Volume (MT) Forecast by Nature, 2020 to 2035
  • Table 25: Latin America Market Value (USD Million) Forecast by Product Species, 2020 to 2035
  • Table 26: Latin America Market Volume (MT) Forecast by Product Species, 2020 to 2035
  • Table 27: Latin America Market Value (USD Million) Forecast by Form, 2020 to 2035
  • Table 28: Latin America Market Volume (MT) Forecast by Form, 2020 to 2035
  • Table 29: Latin America Market Value (USD Million) Forecast by Application, 2020 to 2035
  • Table 30: Latin America Market Volume (MT) Forecast by Application, 2020 to 2035
  • Table 31: Europe Market Value (USD Million) Forecast by Country, 2020 to 2035
  • Table 32: Europe Market Volume (MT) Forecast by Country, 2020 to 2035
  • Table 33: Europe Market Value (USD Million) Forecast by Nature, 2020 to 2035
  • Table 34: Europe Market Volume (MT) Forecast by Nature, 2020 to 2035
  • Table 35: Europe Market Value (USD Million) Forecast by Product Species, 2020 to 2035
  • Table 36: Europe Market Volume (MT) Forecast by Product Species, 2020 to 2035
  • Table 37: Europe Market Value (USD Million) Forecast by Form, 2020 to 2035
  • Table 38: Europe Market Volume (MT) Forecast by Form, 2020 to 2035
  • Table 39: Europe Market Value (USD Million) Forecast by Application, 2020 to 2035
  • Table 40: Europe Market Volume (MT) Forecast by Application, 2020 to 2035
  • Table 41: Asia Pacific Market Value (USD Million) Forecast by Country, 2020 to 2035
  • Table 42: Asia Pacific Market Volume (MT) Forecast by Country, 2020 to 2035
  • Table 43: Asia Pacific Market Value (USD Million) Forecast by Nature, 2020 to 2035
  • Table 44: Asia Pacific Market Volume (MT) Forecast by Nature, 2020 to 2035
  • Table 45: Asia Pacific Market Value (USD Million) Forecast by Product Species, 2020 to 2035
  • Table 46: Asia Pacific Market Volume (MT) Forecast by Product Species, 2020 to 2035
  • Table 47: Asia Pacific Market Value (USD Million) Forecast by Form, 2020 to 2035
  • Table 48: Asia Pacific Market Volume (MT) Forecast by Form, 2020 to 2035
  • Table 49: Asia Pacific Market Value (USD Million) Forecast by Application, 2020 to 2035
  • Table 50: Asia Pacific Market Volume (MT) Forecast by Application, 2020 to 2035
  • Table 51: MEA Market Value (USD Million) Forecast by Country, 2020 to 2035
  • Table 52: MEA Market Volume (MT) Forecast by Country, 2020 to 2035
  • Table 53: MEA Market Value (USD Million) Forecast by Nature, 2020 to 2035
  • Table 54: MEA Market Volume (MT) Forecast by Nature, 2020 to 2035
  • Table 55: MEA Market Value (USD Million) Forecast by Product Species, 2020 to 2035
  • Table 56: MEA Market Volume (MT) Forecast by Product Species, 2020 to 2035
  • Table 57: MEA Market Value (USD Million) Forecast by Form, 2020 to 2035
  • Table 58: MEA Market Volume (MT) Forecast by Form, 2020 to 2035
  • Table 59: MEA Market Value (USD Million) Forecast by Application, 2020 to 2035
  • Table 60: MEA Market Volume (MT) Forecast by Application, 2020 to 2035

List of Figures

  • Figure 1: Global Market Value (USD Million) by Nature, 2025 to 2035
  • Figure 2: Global Market Value (USD Million) by Product Species, 2025 to 2035
  • Figure 3: Global Market Value (USD Million) by Form, 2025 to 2035
  • Figure 4: Global Market Value (USD Million) by Application, 2025 to 2035
  • Figure 5: Global Market Value (USD Million) by Region, 2025 to 2035
  • Figure 6: Global Market Value (USD Million) Analysis by Region, 2020 to 2035
  • Figure 7: Global Market Volume (MT) Analysis by Region, 2020 to 2035
  • Figure 8: Global Market Value Share (%) and BPS Analysis by Region, 2025 to 2035
  • Figure 9: Global Market Y-o-Y Growth (%) Projections by Region, 2025 to 2035
  • Figure 10: Global Market Value (USD Million) Analysis by Nature, 2020 to 2035
  • Figure 11: Global Market Volume (MT) Analysis by Nature, 2020 to 2035
  • Figure 12: Global Market Value Share (%) and BPS Analysis by Nature, 2025 to 2035
  • Figure 13: Global Market Y-o-Y Growth (%) Projections by Nature, 2025 to 2035
  • Figure 14: Global Market Value (USD Million) Analysis by Product Species, 2020 to 2035
  • Figure 15: Global Market Volume (MT) Analysis by Product Species, 2020 to 2035
  • Figure 16: Global Market Value Share (%) and BPS Analysis by Product Species, 2025 to 2035
  • Figure 17: Global Market Y-o-Y Growth (%) Projections by Product Species, 2025 to 2035
  • Figure 18: Global Market Value (USD Million) Analysis by Form, 2020 to 2035
  • Figure 19: Global Market Volume (MT) Analysis by Form, 2020 to 2035
  • Figure 20: Global Market Value Share (%) and BPS Analysis by Form, 2025 to 2035
  • Figure 21: Global Market Y-o-Y Growth (%) Projections by Form, 2025 to 2035
  • Figure 22: Global Market Value (USD Million) Analysis by Application, 2020 to 2035
  • Figure 23: Global Market Volume (MT) Analysis by Application, 2020 to 2035
  • Figure 24: Global Market Value Share (%) and BPS Analysis by Application, 2025 to 2035
  • Figure 25: Global Market Y-o-Y Growth (%) Projections by Application, 2025 to 2035
  • Figure 26: Global Market Attractiveness by Nature, 2025 to 2035
  • Figure 27: Global Market Attractiveness by Product Species, 2025 to 2035
  • Figure 28: Global Market Attractiveness by Form, 2025 to 2035
  • Figure 29: Global Market Attractiveness by Application, 2025 to 2035
  • Figure 30: Global Market Attractiveness by Region, 2025 to 2035
  • Figure 31: North America Market Value (USD Million) by Nature, 2025 to 2035
  • Figure 32: North America Market Value (USD Million) by Product Species, 2025 to 2035
  • Figure 33: North America Market Value (USD Million) by Form, 2025 to 2035
  • Figure 34: North America Market Value (USD Million) by Application, 2025 to 2035
  • Figure 35: North America Market Value (USD Million) by Country, 2025 to 2035
  • Figure 36: North America Market Value (USD Million) Analysis by Country, 2020 to 2035
  • Figure 37: North America Market Volume (MT) Analysis by Country, 2020 to 2035
  • Figure 38: North America Market Value Share (%) and BPS Analysis by Country, 2025 to 2035
  • Figure 39: North America Market Y-o-Y Growth (%) Projections by Country, 2025 to 2035
  • Figure 40: North America Market Value (USD Million) Analysis by Nature, 2020 to 2035
  • Figure 41: North America Market Volume (MT) Analysis by Nature, 2020 to 2035
  • Figure 42: North America Market Value Share (%) and BPS Analysis by Nature, 2025 to 2035
  • Figure 43: North America Market Y-o-Y Growth (%) Projections by Nature, 2025 to 2035
  • Figure 44: North America Market Value (USD Million) Analysis by Product Species, 2020 to 2035
  • Figure 45: North America Market Volume (MT) Analysis by Product Species, 2020 to 2035
  • Figure 46: North America Market Value Share (%) and BPS Analysis by Product Species, 2025 to 2035
  • Figure 47: North America Market Y-o-Y Growth (%) Projections by Product Species, 2025 to 2035
  • Figure 48: North America Market Value (USD Million) Analysis by Form, 2020 to 2035
  • Figure 49: North America Market Volume (MT) Analysis by Form, 2020 to 2035
  • Figure 50: North America Market Value Share (%) and BPS Analysis by Form, 2025 to 2035
  • Figure 51: North America Market Y-o-Y Growth (%) Projections by Form, 2025 to 2035
  • Figure 52: North America Market Value (USD Million) Analysis by Application, 2020 to 2035
  • Figure 53: North America Market Volume (MT) Analysis by Application, 2020 to 2035
  • Figure 54: North America Market Value Share (%) and BPS Analysis by Application, 2025 to 2035
  • Figure 55: North America Market Y-o-Y Growth (%) Projections by Application, 2025 to 2035
  • Figure 56: North America Market Attractiveness by Nature, 2025 to 2035
  • Figure 57: North America Market Attractiveness by Product Species, 2025 to 2035
  • Figure 58: North America Market Attractiveness by Form, 2025 to 2035
  • Figure 59: North America Market Attractiveness by Application, 2025 to 2035
  • Figure 60: North America Market Attractiveness by Country, 2025 to 2035
  • Figure 61: Latin America Market Value (USD Million) by Nature, 2025 to 2035
  • Figure 62: Latin America Market Value (USD Million) by Product Species, 2025 to 2035
  • Figure 63: Latin America Market Value (USD Million) by Form, 2025 to 2035
  • Figure 64: Latin America Market Value (USD Million) by Application, 2025 to 2035
  • Figure 65: Latin America Market Value (USD Million) by Country, 2025 to 2035
  • Figure 66: Latin America Market Value (USD Million) Analysis by Country, 2020 to 2035
  • Figure 67: Latin America Market Volume (MT) Analysis by Country, 2020 to 2035
  • Figure 68: Latin America Market Value Share (%) and BPS Analysis by Country, 2025 to 2035
  • Figure 69: Latin America Market Y-o-Y Growth (%) Projections by Country, 2025 to 2035
  • Figure 70: Latin America Market Value (USD Million) Analysis by Nature, 2020 to 2035
  • Figure 71: Latin America Market Volume (MT) Analysis by Nature, 2020 to 2035
  • Figure 72: Latin America Market Value Share (%) and BPS Analysis by Nature, 2025 to 2035
  • Figure 73: Latin America Market Y-o-Y Growth (%) Projections by Nature, 2025 to 2035
  • Figure 74: Latin America Market Value (USD Million) Analysis by Product Species, 2020 to 2035
  • Figure 75: Latin America Market Volume (MT) Analysis by Product Species, 2020 to 2035
  • Figure 76: Latin America Market Value Share (%) and BPS Analysis by Product Species, 2025 to 2035
  • Figure 77: Latin America Market Y-o-Y Growth (%) Projections by Product Species, 2025 to 2035
  • Figure 78: Latin America Market Value (USD Million) Analysis by Form, 2020 to 2035
  • Figure 79: Latin America Market Volume (MT) Analysis by Form, 2020 to 2035
  • Figure 80: Latin America Market Value Share (%) and BPS Analysis by Form, 2025 to 2035
  • Figure 81: Latin America Market Y-o-Y Growth (%) Projections by Form, 2025 to 2035
  • Figure 82: Latin America Market Value (USD Million) Analysis by Application, 2020 to 2035
  • Figure 83: Latin America Market Volume (MT) Analysis by Application, 2020 to 2035
  • Figure 84: Latin America Market Value Share (%) and BPS Analysis by Application, 2025 to 2035
  • Figure 85: Latin America Market Y-o-Y Growth (%) Projections by Application, 2025 to 2035
  • Figure 86: Latin America Market Attractiveness by Nature, 2025 to 2035
  • Figure 87: Latin America Market Attractiveness by Product Species, 2025 to 2035
  • Figure 88: Latin America Market Attractiveness by Form, 2025 to 2035
  • Figure 89: Latin America Market Attractiveness by Application, 2025 to 2035
  • Figure 90: Latin America Market Attractiveness by Country, 2025 to 2035
  • Figure 91: Europe Market Value (USD Million) by Nature, 2025 to 2035
  • Figure 92: Europe Market Value (USD Million) by Product Species, 2025 to 2035
  • Figure 93: Europe Market Value (USD Million) by Form, 2025 to 2035
  • Figure 94: Europe Market Value (USD Million) by Application, 2025 to 2035
  • Figure 95: Europe Market Value (USD Million) by Country, 2025 to 2035
  • Figure 96: Europe Market Value (USD Million) Analysis by Country, 2020 to 2035
  • Figure 97: Europe Market Volume (MT) Analysis by Country, 2020 to 2035
  • Figure 98: Europe Market Value Share (%) and BPS Analysis by Country, 2025 to 2035
  • Figure 99: Europe Market Y-o-Y Growth (%) Projections by Country, 2025 to 2035
  • Figure 100: Europe Market Value (USD Million) Analysis by Nature, 2020 to 2035
  • Figure 101: Europe Market Volume (MT) Analysis by Nature, 2020 to 2035
  • Figure 102: Europe Market Value Share (%) and BPS Analysis by Nature, 2025 to 2035
  • Figure 103: Europe Market Y-o-Y Growth (%) Projections by Nature, 2025 to 2035
  • Figure 104: Europe Market Value (USD Million) Analysis by Product Species, 2020 to 2035
  • Figure 105: Europe Market Volume (MT) Analysis by Product Species, 2020 to 2035
  • Figure 106: Europe Market Value Share (%) and BPS Analysis by Product Species, 2025 to 2035
  • Figure 107: Europe Market Y-o-Y Growth (%) Projections by Product Species, 2025 to 2035
  • Figure 108: Europe Market Value (USD Million) Analysis by Form, 2020 to 2035
  • Figure 109: Europe Market Volume (MT) Analysis by Form, 2020 to 2035
  • Figure 110: Europe Market Value Share (%) and BPS Analysis by Form, 2025 to 2035
  • Figure 111: Europe Market Y-o-Y Growth (%) Projections by Form, 2025 to 2035
  • Figure 112: Europe Market Value (USD Million) Analysis by Application, 2020 to 2035
  • Figure 113: Europe Market Volume (MT) Analysis by Application, 2020 to 2035
  • Figure 114: Europe Market Value Share (%) and BPS Analysis by Application, 2025 to 2035
  • Figure 115: Europe Market Y-o-Y Growth (%) Projections by Application, 2025 to 2035
  • Figure 116: Europe Market Attractiveness by Nature, 2025 to 2035
  • Figure 117: Europe Market Attractiveness by Product Species, 2025 to 2035
  • Figure 118: Europe Market Attractiveness by Form, 2025 to 2035
  • Figure 119: Europe Market Attractiveness by Application, 2025 to 2035
  • Figure 120: Europe Market Attractiveness by Country, 2025 to 2035
  • Figure 121: Asia Pacific Market Value (USD Million) by Nature, 2025 to 2035
  • Figure 122: Asia Pacific Market Value (USD Million) by Product Species, 2025 to 2035
  • Figure 123: Asia Pacific Market Value (USD Million) by Form, 2025 to 2035
  • Figure 124: Asia Pacific Market Value (USD Million) by Application, 2025 to 2035
  • Figure 125: Asia Pacific Market Value (USD Million) by Country, 2025 to 2035
  • Figure 126: Asia Pacific Market Value (USD Million) Analysis by Country, 2020 to 2035
  • Figure 127: Asia Pacific Market Volume (MT) Analysis by Country, 2020 to 2035
  • Figure 128: Asia Pacific Market Value Share (%) and BPS Analysis by Country, 2025 to 2035
  • Figure 129: Asia Pacific Market Y-o-Y Growth (%) Projections by Country, 2025 to 2035
  • Figure 130: Asia Pacific Market Value (USD Million) Analysis by Nature, 2020 to 2035
  • Figure 131: Asia Pacific Market Volume (MT) Analysis by Nature, 2020 to 2035
  • Figure 132: Asia Pacific Market Value Share (%) and BPS Analysis by Nature, 2025 to 2035
  • Figure 133: Asia Pacific Market Y-o-Y Growth (%) Projections by Nature, 2025 to 2035
  • Figure 134: Asia Pacific Market Value (USD Million) Analysis by Product Species, 2020 to 2035
  • Figure 135: Asia Pacific Market Volume (MT) Analysis by Product Species, 2020 to 2035
  • Figure 136: Asia Pacific Market Value Share (%) and BPS Analysis by Product Species, 2025 to 2035
  • Figure 137: Asia Pacific Market Y-o-Y Growth (%) Projections by Product Species, 2025 to 2035
  • Figure 138: Asia Pacific Market Value (USD Million) Analysis by Form, 2020 to 2035
  • Figure 139: Asia Pacific Market Volume (MT) Analysis by Form, 2020 to 2035
  • Figure 140: Asia Pacific Market Value Share (%) and BPS Analysis by Form, 2025 to 2035
  • Figure 141: Asia Pacific Market Y-o-Y Growth (%) Projections by Form, 2025 to 2035
  • Figure 142: Asia Pacific Market Value (USD Million) Analysis by Application, 2020 to 2035
  • Figure 143: Asia Pacific Market Volume (MT) Analysis by Application, 2020 to 2035
  • Figure 144: Asia Pacific Market Value Share (%) and BPS Analysis by Application, 2025 to 2035
  • Figure 145: Asia Pacific Market Y-o-Y Growth (%) Projections by Application, 2025 to 2035
  • Figure 146: Asia Pacific Market Attractiveness by Nature, 2025 to 2035
  • Figure 147: Asia Pacific Market Attractiveness by Product Species, 2025 to 2035
  • Figure 148: Asia Pacific Market Attractiveness by Form, 2025 to 2035
  • Figure 149: Asia Pacific Market Attractiveness by Application, 2025 to 2035
  • Figure 150: Asia Pacific Market Attractiveness by Country, 2025 to 2035
  • Figure 151: MEA Market Value (USD Million) by Nature, 2025 to 2035
  • Figure 152: MEA Market Value (USD Million) by Product Species, 2025 to 2035
  • Figure 153: MEA Market Value (USD Million) by Form, 2025 to 2035
  • Figure 154: MEA Market Value (USD Million) by Application, 2025 to 2035
  • Figure 155: MEA Market Value (USD Million) by Country, 2025 to 2035
  • Figure 156: MEA Market Value (USD Million) Analysis by Country, 2020 to 2035
  • Figure 157: MEA Market Volume (MT) Analysis by Country, 2020 to 2035
  • Figure 158: MEA Market Value Share (%) and BPS Analysis by Country, 2025 to 2035
  • Figure 159: MEA Market Y-o-Y Growth (%) Projections by Country, 2025 to 2035
  • Figure 160: MEA Market Value (USD Million) Analysis by Nature, 2020 to 2035
  • Figure 161: MEA Market Volume (MT) Analysis by Nature, 2020 to 2035
  • Figure 162: MEA Market Value Share (%) and BPS Analysis by Nature, 2025 to 2035
  • Figure 163: MEA Market Y-o-Y Growth (%) Projections by Nature, 2025 to 2035
  • Figure 164: MEA Market Value (USD Million) Analysis by Product Species, 2020 to 2035
  • Figure 165: MEA Market Volume (MT) Analysis by Product Species, 2020 to 2035
  • Figure 166: MEA Market Value Share (%) and BPS Analysis by Product Species, 2025 to 2035
  • Figure 167: MEA Market Y-o-Y Growth (%) Projections by Product Species, 2025 to 2035
  • Figure 168: MEA Market Value (USD Million) Analysis by Form, 2020 to 2035
  • Figure 169: MEA Market Volume (MT) Analysis by Form, 2020 to 2035
  • Figure 170: MEA Market Value Share (%) and BPS Analysis by Form, 2025 to 2035
  • Figure 171: MEA Market Y-o-Y Growth (%) Projections by Form, 2025 to 2035
  • Figure 172: MEA Market Value (USD Million) Analysis by Application, 2020 to 2035
  • Figure 173: MEA Market Volume (MT) Analysis by Application, 2020 to 2035
  • Figure 174: MEA Market Value Share (%) and BPS Analysis by Application, 2025 to 2035
  • Figure 175: MEA Market Y-o-Y Growth (%) Projections by Application, 2025 to 2035
  • Figure 176: MEA Market Attractiveness by Nature, 2025 to 2035
  • Figure 177: MEA Market Attractiveness by Product Species, 2025 to 2035
  • Figure 178: MEA Market Attractiveness by Form, 2025 to 2035
  • Figure 179: MEA Market Attractiveness by Application, 2025 to 2035
  • Figure 180: MEA Market Attractiveness by Country, 2025 to 2035

Frequently Asked Questions

What was the overall size of the functional mushroom market in 2025?

The overall market size for functional mushroom market was USD 11,230 million in 2025.

How big is the functional mushroom market expected to be in 2035?

The functional mushroom market is expected to reach USD 25,648 million in 2035.

What will drive the demand for functional mushroom market during the forecast period?

The increasing consumer awareness regarding health benefits, rising demand for functional foods and dietary supplements, and growing applications in pharmaceuticals fuel the functional mushroom market during the forecast period.

List the top 5 countries contributing in functional mushroom market?

The top 5 countries which drive the development of functional mushroom market are USA, China, Japan, Germany, and South Korea.

Which is the leading segment in the functional mushroom market?

On the basis of type, Reishi mushrooms are expected to command a significant share over the forecast period.

Explore Similar Insights

Future Market Insights

Functional Mushroom Market