Functional Carbohydrate Market Size and Share Forecast Outlook 2025 to 2035

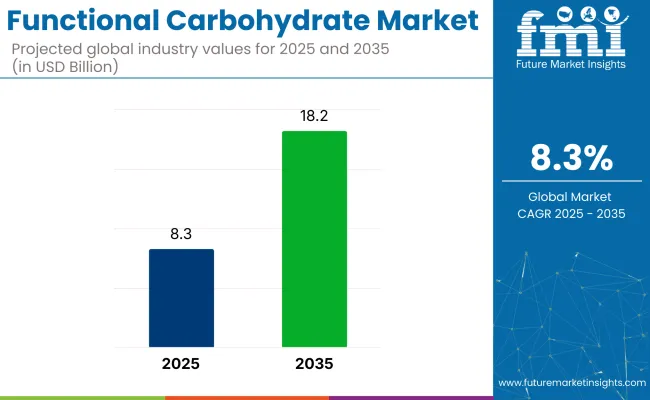
The functional carbohydrate market has been valued at USD 8.3 billion for 2025 and is forecast to reach USD 18.2 billion by 2035, growing at a compound annual rate of 8.3%.
Quick Stats of Functional Carbohydrate Market

  • Market Value (2025): USD 8.3 billion
  • Forecast Value (2035): USD 18.2 billion
  • Forecast CAGR (2025 to 2035): 8.3%
  • Leading Segment in 2025: Food and Beverages (44.3% share)
  • Key Growth Region: Asia Pacific (China is the fastest growing market with 10.2% CAGR)
  • Key Players: Beneo GmbH, Wacker Chemie AG, Cargill, Incorporated, Evonik Industries AG, Roquette Frères, Sanxinyuan Food Industry Corporation Limited, Haihang Industry Co., Ltd., FrakenBiochem Co. Ltd., Zibo Qianhui Biological Technology Co., Ltd., Foodchem International Corporation.

Functional Carbohydrates Market

Attribute Value
Industry Value (2025) USD 8.3 billion
Industry Value (2035) USD 18.2 billion
CAGR (2025 to 2035) 8.3%

As food systems continue to grapple with the dual burden of malnutrition and metabolic disease, the role of ingredients has moved toward carbohydrates that do more than provide energy. This has unlocked demand across multiple regions, with strong uptake observed in both high-income markets focused on glycemic response and middle-income economies where demand for gut-health-enhancing foods is rising.

The industry registers an estimated 18.4% share of the broader functional food ingredients market in 2025. Within the nutraceutical ingredients segment, its contribution stood near 10.5%, driven by rising integration in metabolic health formulations.

In the specialty carbohydrates market, functional variants made up roughly 41.7% of the total, underscoring their dominance in advanced carbohydrate applications. Across the food additives domain, they contributed around 6.9%, primarily through clean-label stabilizers and bulking agents.

Their presence in the health and wellness ingredients market reached about 12.2%. These values reflect growing prioritization of glycemic control, digestive function, and sugar substitution strategies across multiple ingredient categories, with the product acting as a convergence point between taste, wellness, and performance.

Production methods are moving from starch breakdown to precise bioconversion, breaking the link between output and grain prices. In 2024, three European plants added 120 kt of annual capacity for enzyme-designed isomalto-oligosaccharides produced from lactose-free whey permeate, reducing feedstock costs by USD 26 per metric ton compared with corn syrup. Carbon-capture loops pipe fermentation CO₂ into nearby greenhouses, covering about 4% of the operating cost for each kilogram of palatinose.

Japan’s pharmacopoeia placed resistant dextrins on a food-for-specified-health-use fast track, trimming approval time to nine months and encouraging beverage companies to sign three-year toll-manufacturing deals. These production and regulatory shifts, rather than sugar taxes, are driving margin differences and enabling faster scale-up.

Analysis of Functional Carbohydrate Market by Top Investment Segments 

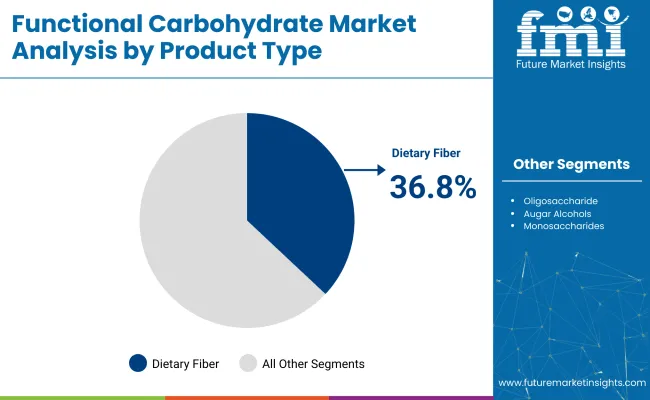
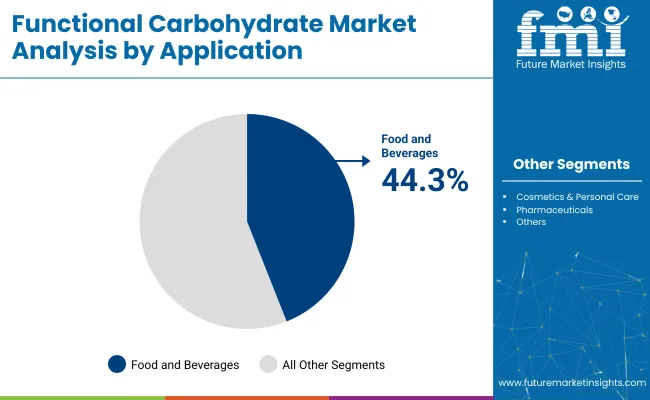
Dietary fiber leads the market with a 36.8% share in 2025, driven by its roles in gut health, metabolic regulation, and versatile formulation. Food and beverages hold 44.3% share, supported by easy consumer adoption, reformulation flexibility, and rapid retail rollout.
Dietary Fiber is Expected to dominate the Product Type

Functional Carbohydrates Market By Product Type

Dietary fiber accounts for a 36.8% market share in the functional carbohydrate market as of 2025, making it the leading segment. This dominance stems not only from its long-established links to digestive health but also from its expanding role in metabolic management, satiety regulation, and microbiome modulation.
  • While consumers have historically associated fiber with basic gut function, recent interest has shifted toward its ability to influence the gut-brain axis, immune signaling, and blood sugar control.
  • Manufacturers have capitalized on this momentum by incorporating fiber into reformulated snack foods, dairy alternatives, and sports nutrition products.
  • The versatility of fibers like inulin, beta-glucans, and resistant starches enables seamless integration without compromising product texture or flavor, a key reason for their broad uptake.

Growing Product Demand in Food and Beverages

Functional Carbohydrates Market By Application

Food and beverages contribute 44.3% to the functional carbohydrate market in 2025, making it the most dominant application area by value. This position is a result of its foundational role in everyday consumption, where reformulated products, ranging from breakfast staples to dairy and drinkable snacks.

  • Food and beverages are adopted easily as they fit into existing consumer routines without requiring behavioral change.
  • Ingredients like cyclodextrins and resistant starches help manage calorie load, digestion rate, mouthfeel, and shelf stability in reformulated products.
  • Faster commercialization cycles and strong presence across retail shelves and digital platforms enhance market penetration in this segment.

Top Functional Carbohydrate Market Dynamics

New food labeling rules and growing consumer focus on sugar and fiber are speeding up reformulation using functional carbohydrates. At the same time, interest in gut health is pushing more R&D and boosting fiber supply chains. Ingredient use is increasing as health claims are backed by studies and supported by new fermentation technologies.

Label-Led Reformulation Drives Sugar-Shift Momentum

In regions like the EU, USA, and Asia, food makers now have to show added sugar and fiber on the front of packs. This has led many brands to replace refined sugar with functional alternatives. Shoppers are reading sugar labels more carefully than prices.

Brands are using palatinose, inulin, and resistant dextrins to cut sugar by 14% in new cereal products since 2023, without changing taste or texture. Retailers are helping by giving better shelf space to reformulated items, which speeds up product changes and reduces risk.

  • Sugar labels push faster sugar replacement
  • Blends retain taste while lowering glycemic response
  • Retailers reward healthier reformulations

Microbiome-Centric R&D Spurs Fiber Supply Expansion

Gut health is now seen as a key part of overall wellness. Suppliers have tripled research budgets since 2022 to study fiber’s role. One study found that resistant starch increased bifidobacteria by 22% in four weeks. These results now appear on product labels.

To keep up with demand, companies are locking in tapioca and chicory supplies and adding new processing lines in Southeast Asia, growing output by 18% in one year. Startups using fermentation are creating new oligosaccharide ingredients for food makers.
  • Health studies support fiber claims
  • Feedstock deals and new lines boost supply
  • Fermentation adds new ingredient options

Analysis of Top Countries Producing and Supplying Functional Carbohydrate Globally

Country Wise Analysis Of Functional Carbohydrates Market

The report covers a detailed analysis of 40+ countries and the top five countries have been shared as a reference.

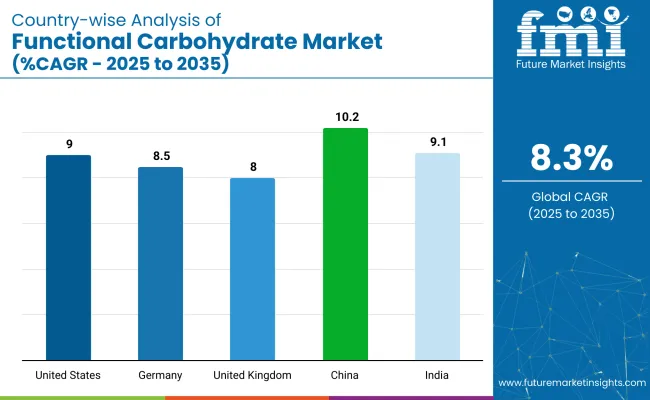
Countries CAGR (2025 to 2035)
United States 9%
Germany 8.5%
United Kingdom 8%
China 10.2%
India 9.1%

The functional carbohydrate market is set to grow at different rates across key economies, influenced by policy, consumer behavior, and supply chain maturity. The United States, an OECD member, will expand at a 9.0% CAGR, driven by FDA sugar-labeling mandates that are prompting reformulation in cereals, beverages, and dairy using low-GI carbohydrates. Germany, also in the OECD, is projected at 8.5%, with the Nutri-Score system encouraging fiber inclusion through locally sourced oat and barley derivatives.

The United Kingdom, growing at 8.0%, leverages a graduated soft-drink levy and retailer-driven bakery reformulations, also as part of the OECD group. China, a BRICS country, leads at 10.2% due to aggressive sugar-reduction policies, cassava-based fiber production, and strong e-commerce traction in functional snacks. India, also within BRICS, is set for 9.1% growth, as rising diabetes rates and quick-commerce expansion accelerate demand for low-glycemic, starch-derived functional carbohydrates in both urban and tier-2 cities.

Growth Analysis of Functional Carbohydrate Market in the United States

The USA functional carbohydrate market is estimated to grow at 9.0% CAGR during the study period. Rising concern over metabolic disorders has steered processors toward low-glycemic sweeteners and prebiotic fibers that enable sugar-reduction without sensory compromise.

Front-of-pack disclosures enforced by the FDA have pushed retailers to prefer products showing total-sugar cuts, so brand reformulation pipelines now place products at the center of baked goods, dairy alternatives, and performance beverages. Sports-nutrition brands have embedded palatinose for sustained energy, while resistant dextrins are used to improve mouthfeel in high-protein bars.

Supply chains have remained resilient because domestic corn and wheat substrates allow on-shore production of polyols and soluble fibers, limiting exposure to import volatility. Clinical collaborations with USA universities have reinforced consumer trust by confirming gut-microbiome benefits, thereby elevating repeat-purchase rates for fiber-fortified items.

  • Sugar-label rules push functional carbohydrate adoption
  • Sports-nutrition usage boosts ingredient throughput
  • Domestic feeds tock supports stable supply

Functional Carbohydrate Market Growth Outlook in Germany

Germany’s functional carbohydrate sector is projected to expand at an 8.5% CAGR over 2025-2035. Strong public insurance incentives favor preventive nutrition, so formulators emphasize fibers and slowly absorbed carbohydrates to manage glycemic response in everyday foods.

The country’s “Nutri-Score” labeling system has guided supermarkets toward stocking items with higher fiber ratings, prompting bakeries to integrate inulin and beta-glucans into rye and spelt lines. Local ingredient firms leverage established cereal-processing infrastructure to extract soluble fibers from barley and oats, keeping cost inflation modest.

Scientific institutes in Bonn and Munich have published gut-brain axis findings that position as cognitive-support agents, drawing interest from adult-wellness brands. Export-oriented manufacturers employ clean-label claims to capitalize on demand across neighboring EU markets, further scaling domestic production volumes.

  • Nutri-Score visibility stimulates high-fiber reformulation
  • Barley- and oat-derived fibers anchor supply security
  • Research backing links to cognitive health

Demand Forecast for Functional Carbohydrate Market in China

In China, functional carbohydrate revenues are forecast to rise at a 10.2% CAGR through the forecast horizon. National health campaigns encouraging reduced free-sugar intake have dovetailed with a surge in e-commerce snacks touting low-glycemic profiles. Palatinose and isomaltulose are being applied in ready-to-drink teas and coffee to moderate post-meal glucose swings among urban consumers managing prediabetes.

Domestic biotech firms have invested in enzymatic-conversion lines that transform cassava starch into soluble fibers, easing reliance on imports and aligning with self-sufficiency goals. Government subsidies for “special medical purpose foods” permit accelerated market entry for functional carbohydrate-fortified formulas aimed at elderly-care facilities and hospital nutrition. Strong live-stream commerce further accelerates consumer education, turning gut-health narratives into rapid sales uptake.

  • Sugar-cut policies reinforce low-GI ingredient demand
  • Cassava-based fibers reduce import dependence
  • Government programs fast-track clinical nutrition SKUs

Future Outlook for Functional Carbohydrate Market in the United Kingdom

The functional carbohydrate landscape in the United Kingdom is expected to register an 8.0% CAGR across the assessment window. A graduated soft-drink industry levy has nudged beverage makers toward sugar-substitution strategies featuring resistant starches and sugar alcohol blends to meet levy thresholds without flavor trade-offs. Public Health England’s reformulation targets have spilled over into bakery and cereals, leading retailers to favor fiber-enhanced own-label lines.

University-led trials in London have connected digestive-comfort claims with daily fiber intake, prompting premium yogurt brands to showcase inulin-rich recipes. Brexit-related supply disruptions have encouraged manufacturers to localize chicory-root sourcing in Lincolnshire, helping secure a consistent inulin feedstock.

  • Sugar-levy pressure fuels low-calorie sweetener use
  • Retailer reformulation targets elevate fiber inclusion
  • Domestic chicory cultivation secures inulin supply

Analysis of Functional Carbohydrate Market in India

India’s functional carbohydrate market is poised for roughly 9.1% CAGR growth during the forecast span, outpacing the global average. Rising incidences of type-2 diabetes have spurred food firms to replace traditional sugars with isomalt, palatinose, and resistant dextrins across biscuits, malt-based drinks, and ready-to-eat breakfast mixes.

The Food Safety and Standards Authority of India has tightened labeling norms around added sugars, which has encouraged multinational and regional players to highlight “low-GI” on packaging. Domestic starch processors in Gujarat and Maharashtra have scaled production of soluble fibers derived from tapioca and maize to meet reformulation demand while keeping ingredient costs competitive. Ayurveda-inspired nutraceutical brands incorporate soluble fibers with herbal extracts to tap into holistic-wellness positioning.

  • Diabetes prevalence spurs low-GI product launches
  • Local starch-based fibers keep pricing competitive
  • Quick-commerce channels broaden rural reach

Leading Functional Carbohydrate Suppliers

The functional carbohydrate market is shaped by a mix of global ingredient leaders and specialized suppliers targeting glycemic management, digestive wellness, and clean-label formulation. Major players such as Beneo GmbH, Roquette Frères, and Cargill, Incorporated drivein prebiotic fibers and low-glycemic sugar alternatives tailored for food and nutraceutical sectors. Wacker Chemie AG and Evonik Industries AG bring biochemical expertise to develop systems with improved stability and bioavailability. Chinese producers like Sanxinyuan Food Industry Corporation Limited, Haihang Industry Co., Ltd., and Zibo Qianhui Biological Technology Co., Ltd. support scalable, starch-based supply chains for isomaltulose and resistant dextrins. FrakenBiochem Co. Ltd. and Foodchem International Corporation cater to regional contract manufacturers, offering competitively priced product ingredients for bakery, beverages, and clinical nutrition products across emerging Asia-Pacific markets.

Recent Functional Carbohydrate Industry News

  • In February 2025, Beneo announced a €6 million investment in new drying capacity at its Wijgmaal factory, aiming to extend its functional fiber product range with the launch of Orafti® β-Fit barley beta-glucans.
  • In November 2024, Haihang Industry Co., Ltd. announced a strategic business move by transferring its core export operations to Shanghai under the new name “Getchem Co., Ltd.” This relocation aims to build a more complete service system and enhance operational efficiency in the functional ingredients sector.

Leading Players

  • Beneo GmbH
  • Wacker Chemie AG
  • Cargill, Incorporated
  • Evonik Industries AG
  • Roquette Frères
  • Sanxinyuan Food Industry Corporation Limited
  • Haihang Industry Co., Ltd.
  • FrakenBiochem Co. Ltd.
  • Zibo Qianhui Biological Technology Co., Ltd.
  • Foodchem International Corporation

Report Coverage and Scope Summary

Report Attributes Details
Market Size (2025) USD 8.3 billion
Projected Market Size (2035) USD 18.2 billion
CAGR (2025 to 2035) 8.3%
Base Year for Estimation 2024
Historical Period 2020 to 2024
Projections Period 2025 to 2035
Quantitative Units USD billion for value and volume in metric tons
Product Type Analyzed (Segment 1) Dietary Fiber, Functional Polysaccharides, Functional Oligosaccharides, Sugar Alcohols, and Other Functional Monosaccharides.
Application Analyzed (Segment 2) Food & Beverages, Cosmetics & Personal Care, Pharmaceuticals, Nutraceuticals, and Others.
Regions Covered North America, Europe, Asia Pacific, Middle East & Africa, Latin America
Countries Covered United States, Canada, Germany, United Kingdom, France, Italy, Spain, China, Japan, South Korea, India, Australia, Brazil, Mexico, Argentina, Saudi Arabia, UAE, South Africa
Key Players Beneo GmbH, Wacker Chemie AG, Cargill, Incorporated, Evonik Industries AG, Roquette Frères, Sanxinyuan Food Industry Corporation Limited, Haihang Industry Co., Ltd., Fraken Biochem Co. Ltd., Zibo Qianhui Biological Technology Co., Ltd., Foodchem International Corporation.
Additional Attributes Dollar sales, share by product type, application trends, regional demand shifts, pricing benchmarks, competitive positioning, buyer preferences, regulatory changes, and future growth projections.

Key Segments

By Product Type:

The industry is segmented into dietary fiber, functional polysaccharides, functional oligosaccharides, sugar alcohols, other functional monosaccharides.

By Application:

The industry finds applications in food & beverages, cosmetics & personal care, pharmaceuticals, nutraceuticals, others.

By Region:

The industry covers regions including North America, Europe, Asia Pacific, Latin America, and the Middle East & Africa.

Table of Content

  1. Executive Summary
    • Global Market Outlook
    • Demand-side Trends
    • Supply-side Trends
    • Technology Roadmap Analysis
    • Analysis and Recommendations
  2. Market Overview
    • Market Coverage/Taxonomy
    • Market Definition/Scope/Limitations
  3. Market Background
    • Market Dynamics
      • Drivers
      • Restraints
      • Opportunity
      • Trends
    • Scenario Forecast
      • Demand in Optimistic Scenario
      • Demand in Likely Scenario
      • Demand in Conservative Scenario
    • Opportunity Map Analysis
    • Product Life Cycle Analysis
    • Supply Chain Analysis
      • Supply Side Participants and their Roles
        • Producers
        • Mid-Level Participants (Traders/ Agents/ Brokers)
        • Wholesalers and Distributors
      • Value Added and Value Created at Node in the Supply Chain
      • List of Raw Material Suppliers
      • List of Existing and Potential Buyer’s
    • Investment Feasibility Matrix
    • Value Chain Analysis
      • Profit Margin Analysis
      • Wholesalers and Distributors
      • Retailers
    • PESTLE and Porter’s Analysis
    • Regulatory Landscape
      • By Key Regions
      • By Key Countries
    • Regional Parent Market Outlook
    • Production and Consumption Statistics
    • Import and Export Statistics
  4. Global Market Analysis 2020 to 2024 and Forecast, 2025 to 2035
    • Historical Market Size Value (USD Billion) & Volume (Metric tons) Analysis, 2020 to 2024
    • Current and Future Market Size Value (USD Billion) & Volume (Metric tons) Projections, 2025 to 2035
      • Y-o-Y Growth Trend Analysis
      • Absolute $ Opportunity Analysis
  5. Global Market Pricing Analysis 2020 to 2024 and Forecast 2025 to 2035
  6. Global Market Analysis 2020 to 2024 and Forecast 2025 to 2035, By Product Type
    • Introduction/Key Findings
    • Historical Market Size Value (USD Billion) & Volume (Metric tons) Analysis By Product Type, 2020 to 2024
    • Current and Future Market Size Value (USD Billion) & Volume (Metric tons) Analysis and Forecast By Product Type, 2025 to 2035
      • Dietary Fiber
      • Functional Polysaccharides
      • Functional Oligosaccharides
      • Sugar Alcohols
      • other Functional Monosaccharides
    • Y-o-Y Growth Trend Analysis By Product Type, 2020 to 2024
    • Absolute $ Opportunity Analysis By Product Type, 2025 to 2035
  7. Global Market Analysis 2020 to 2024 and Forecast 2025 to 2035, By Application
    • Introduction/Key Findings
    • Historical Market Size Value (USD Billion) & Volume (Metric tons) Analysis By Application, 2020 to 2024
    • Current and Future Market Size Value (USD Billion) & Volume (Metric tons) Analysis and Forecast By Application, 2025 to 2035
      • Food & Beverages
      • Cosmetics & Personal Care
      • Pharmaceuticals
      • Nutraceuticals
      • Others
    • Y-o-Y Growth Trend Analysis By Application, 2020 to 2024
    • Absolute $ Opportunity Analysis By Application, 2025 to 2035
  8. Global Market Analysis 2020 to 2024 and Forecast 2025 to 2035, By Region
    • Introduction
    • Historical Market Size Value (USD Billion) & Volume (Metric tons) Analysis By Region, 2020 to 2024
    • Current Market Size Value (USD Billion) & Volume (Metric tons) Analysis and Forecast By Region, 2025 to 2035
      • North America
      • Latin America
      • Western Europe
      • Eastern Europe
      • East Asia
      • South Asia & Pacific
      • Middle East and Africa
    • Market Attractiveness Analysis By Region
  9. North America Market Analysis 2020 to 2024 and Forecast 2025 to 2035, By Country
    • Historical Market Size Value (USD Billion) & Volume (Metric tons) Trend Analysis By Market Taxonomy, 2020 to 2024
    • Market Size Value (USD Billion) & Volume (Metric tons) Forecast By Market Taxonomy, 2025 to 2035
      • By Country
        • USA
        • Canada
        • Mexico
      • By Product Type
      • By Application
    • Market Attractiveness Analysis
      • By Country
      • By Product Type
      • By Application
    • Key Takeaways
  10. Latin America Market Analysis 2020 to 2024 and Forecast 2025 to 2035, By Country
    • Historical Market Size Value (USD Billion) & Volume (Metric tons) Trend Analysis By Market Taxonomy, 2020 to 2024
    • Market Size Value (USD Billion) & Volume (Metric tons) Forecast By Market Taxonomy, 2025 to 2035
      • By Country
        • Brazil
        • Argentina
        • Rest of LATAM
      • By Product Type
      • By Application
    • Market Attractiveness Analysis
      • By Country
      • By Product Type
      • By Application
    • Key Takeaways
  11. Western Europe Market Analysis 2020 to 2024 and Forecast 2025 to 2035, By Country
    • Historical Market Size Value (USD Billion) & Volume (Metric tons) Trend Analysis By Market Taxonomy, 2020 to 2024
    • Market Size Value (USD Billion) & Volume (Metric tons) Forecast By Market Taxonomy, 2025 to 2035
      • By Country
        • Germany
        • Italy
        • France
        • UK
        • Spain
        • BENELUX
        • Nordic
        • Rest of W.Europe
      • By Product Type
      • By Application
    • Market Attractiveness Analysis
      • By Country
      • By Product Type
      • By Application
    • Key Takeaways
  12. Eastern Europe Market Analysis 2020 to 2024 and Forecast 2025 to 2035, By Country
    • Historical Market Size Value (USD Billion) & Volume (Metric tons) Trend Analysis By Market Taxonomy, 2020 to 2024
    • Market Size Value (USD Billion) & Volume (Metric tons) Forecast By Market Taxonomy, 2025 to 2035
      • By Country
        • Russia
        • Hungary
        • Poland
        • Balkan & Baltics
        • Rest of E. Europe
      • By Product Type
      • By Application
    • Market Attractiveness Analysis
      • By Country
      • By Product Type
      • By Application
    • Key Takeaways
  13. East Asia Market Analysis 2020 to 2024 and Forecast 2025 to 2035, By Country
    • Historical Market Size Value (USD Billion) & Volume (Metric tons) Trend Analysis By Market Taxonomy, 2020 to 2024
    • Market Size Value (USD Billion) & Volume (Metric tons) Forecast By Market Taxonomy, 2025 to 2035
      • By Country
        • China
        • Japan
        • South Korea
      • By Product Type
      • By Application
    • Market Attractiveness Analysis
      • By Country
      • By Product Type
      • By Application
    • Key Takeaways
  14. South Asia & Pacific Market Analysis 2020 to 2024 and Forecast 2025 to 2035, By Country
    • Historical Market Size Value (USD Billion) & Volume (Metric tons) Trend Analysis By Market Taxonomy, 2020 to 2024
    • Market Size Value (USD Billion) & Volume (Metric tons) Forecast By Market Taxonomy, 2025 to 2035
      • By Country
        • India
        • Australia & New Zealand
        • ASEAN
        • Rest of SAP
      • By Product Type
      • By Application
    • Market Attractiveness Analysis
      • By Country
      • By Product Type
      • By Application
    • Key Takeaways
  15. Middle East and Africa Market Analysis 2020 to 2024 and Forecast 2025 to 2035, By Country
    • Historical Market Size Value (USD Billion) & Volume (Metric tons) Trend Analysis By Market Taxonomy, 2020 to 2024
    • Market Size Value (USD Billion) & Volume (Metric tons) Forecast By Market Taxonomy, 2025 to 2035
      • By Country
        • GCC Countries
        • Northern Africa
        • South Africa
        • Turkiye
        • Rest of MEA
      • By Product Type
      • By Application
    • Market Attractiveness Analysis
      • By Country
      • By Product Type
      • By Application
    • Key Takeaways
  16. Key Countries Market Analysis
    • USA
      • Pricing Analysis
      • Market Share Analysis, 2024
        • By Product Type
        • By Application
    • Canada
      • Pricing Analysis
      • Market Share Analysis, 2024
        • By Product Type
        • By Application
    • Brazil
      • Pricing Analysis
      • Market Share Analysis, 2024
        • By Product Type
        • By Application
    • Mexico
      • Pricing Analysis
      • Market Share Analysis, 2024
        • By Product Type
        • By Application
    • Argentina
      • Pricing Analysis
      • Market Share Analysis, 2024
        • By Product Type
        • By Application
  17. Market Structure Analysis
    • Competition Dashboard
    • Competition Benchmarking
    • Market Share Analysis of Top Players
      • By Regional
      • By Product Type
      • By Application
  18. Competition Analysis
    • Competition Deep Dive
      • Beneo GmbH
        • Overview
        • Product Portfolio
        • Profitability by Market Segments (Product/Age /Sales Channel/Region)
        • Sales Footprint
        • Strategy Overview
          • Marketing Strategy
          • Product Strategy
          • Channel Strategy
      • Wacker Chemie AG
        • Overview
        • Product Portfolio
        • Profitability by Market Segments (Product/Age /Sales Channel/Region)
        • Sales Footprint
        • Strategy Overview
          • Marketing Strategy
          • Product Strategy
          • Channel Strategy
      • Cargill, Incorporated
        • Overview
        • Product Portfolio
        • Profitability by Market Segments (Product/Age /Sales Channel/Region)
        • Sales Footprint
        • Strategy Overview
          • Marketing Strategy
          • Product Strategy
          • Channel Strategy
      • Evonik Industries AG
        • Overview
        • Product Portfolio
        • Profitability by Market Segments (Product/Age /Sales Channel/Region)
        • Sales Footprint
        • Strategy Overview
          • Marketing Strategy
          • Product Strategy
          • Channel Strategy
      • Roquette Frères
        • Overview
        • Product Portfolio
        • Profitability by Market Segments (Product/Age /Sales Channel/Region)
        • Sales Footprint
        • Strategy Overview
          • Marketing Strategy
          • Product Strategy
          • Channel Strategy
      • Sanxinyuan Food Industry Corporation Limited
        • Overview
        • Product Portfolio
        • Profitability by Market Segments (Product/Age /Sales Channel/Region)
        • Sales Footprint
        • Strategy Overview
          • Marketing Strategy
          • Product Strategy
          • Channel Strategy
      • Haihang Industry Co., Ltd.
        • Overview
        • Product Portfolio
        • Profitability by Market Segments (Product/Age /Sales Channel/Region)
        • Sales Footprint
        • Strategy Overview
          • Marketing Strategy
          • Product Strategy
          • Channel Strategy
      • Fraken Biochem Co. Ltd.
        • Overview
        • Product Portfolio
        • Profitability by Market Segments (Product/Age /Sales Channel/Region)
        • Sales Footprint
        • Strategy Overview
          • Marketing Strategy
          • Product Strategy
          • Channel Strategy
      • Zibo Qianhui Biological Technology Co., Ltd.
        • Overview
        • Product Portfolio
        • Profitability by Market Segments (Product/Age /Sales Channel/Region)
        • Sales Footprint
        • Strategy Overview
          • Marketing Strategy
          • Product Strategy
          • Channel Strategy
      • Foodchem International Corporation
        • Overview
        • Product Portfolio
        • Profitability by Market Segments (Product/Age /Sales Channel/Region)
        • Sales Footprint
        • Strategy Overview
          • Marketing Strategy
          • Product Strategy
          • Channel Strategy
  19. Assumptions & Acronyms Used
  20. Research Methodology

List of Tables

  • Table 1: Global Market Value (USD Billion) Forecast by Region, 2020-2035
  • Table 2: Global Market Volume (Metric tons) Forecast by Region, 2020-2035
  • Table 3: Global Market Value (USD Billion) Forecast by Product Type, 2020-2035
  • Table 4: Global Market Volume (Metric tons) Forecast by Product Type, 2020-2035
  • Table 5: Global Market Value (USD Billion) Forecast by Application, 2020-2035
  • Table 6: Global Market Volume (Metric tons) Forecast by Application, 2020-2035
  • Table 7: North America Market Value (USD Billion) Forecast by Country, 2020-2035
  • Table 8: North America Market Volume (Metric tons) Forecast by Country, 2020-2035
  • Table 9: North America Market Value (USD Billion) Forecast by Product Type, 2020-2035
  • Table 10: North America Market Volume (Metric tons) Forecast by Product Type, 2020-2035
  • Table 11: North America Market Value (USD Billion) Forecast by Application, 2020-2035
  • Table 12: North America Market Volume (Metric tons) Forecast by Application, 2020-2035
  • Table 13: Latin America Market Value (USD Billion) Forecast by Country, 2020-2035
  • Table 14: Latin America Market Volume (Metric tons) Forecast by Country, 2020-2035
  • Table 15: Latin America Market Value (USD Billion) Forecast by Product Type, 2020-2035
  • Table 16: Latin America Market Volume (Metric tons) Forecast by Product Type, 2020-2035
  • Table 17: Latin America Market Value (USD Billion) Forecast by Application, 2020-2035
  • Table 18: Latin America Market Volume (Metric tons) Forecast by Application, 2020-2035
  • Table 19: Western Europe Market Value (USD Billion) Forecast by Country, 2020-2035
  • Table 20: Western Europe Market Volume (Metric tons) Forecast by Country, 2020-2035
  • Table 21: Western Europe Market Value (USD Billion) Forecast by Product Type, 2020-2035
  • Table 22: Western Europe Market Volume (Metric tons) Forecast by Product Type, 2020-2035
  • Table 23: Western Europe Market Value (USD Billion) Forecast by Application, 2020-2035
  • Table 24: Western Europe Market Volume (Metric tons) Forecast by Application, 2020-2035
  • Table 25: Eastern Europe Market Value (USD Billion) Forecast by Country, 2020-2035
  • Table 26: Eastern Europe Market Volume (Metric tons) Forecast by Country, 2020-2035
  • Table 27: Eastern Europe Market Value (USD Billion) Forecast by Product Type, 2020-2035
  • Table 28: Eastern Europe Market Volume (Metric tons) Forecast by Product Type, 2020-2035
  • Table 29: Eastern Europe Market Value (USD Billion) Forecast by Application, 2020-2035
  • Table 30: Eastern Europe Market Volume (Metric tons) Forecast by Application, 2020-2035
  • Table 31: East Asia Market Value (USD Billion) Forecast by Country, 2020-2035
  • Table 32: East Asia Market Volume (Metric tons) Forecast by Country, 2020-2035
  • Table 33: East Asia Market Value (USD Billion) Forecast by Product Type, 2020-2035
  • Table 34: East Asia Market Volume (Metric tons) Forecast by Product Type, 2020-2035
  • Table 35: East Asia Market Value (USD Billion) Forecast by Application, 2020-2035
  • Table 36: East Asia Market Volume (Metric tons) Forecast by Application, 2020-2035
  • Table 37: South Asia & Pacific Market Value (USD Billion) Forecast by Country, 2020-2035
  • Table 38: South Asia & Pacific Market Volume (Metric tons) Forecast by Country, 2020-2035
  • Table 39: South Asia & Pacific Market Value (USD Billion) Forecast by Product Type, 2020-2035
  • Table 40: South Asia & Pacific Market Volume (Metric tons) Forecast by Product Type, 2020-2035
  • Table 41: South Asia & Pacific Market Value (USD Billion) Forecast by Application, 2020-2035
  • Table 42: South Asia & Pacific Market Volume (Metric tons) Forecast by Application, 2020-2035
  • Table 43: Middle East and Africa Market Value (USD Billion) Forecast by Country, 2020-2035
  • Table 44: Middle East and Africa Market Volume (Metric tons) Forecast by Country, 2020-2035
  • Table 45: Middle East and Africa Market Value (USD Billion) Forecast by Product Type, 2020-2035
  • Table 46: Middle East and Africa Market Volume (Metric tons) Forecast by Product Type, 2020-2035
  • Table 47: Middle East and Africa Market Value (USD Billion) Forecast by Application, 2020-2035
  • Table 48: Middle East and Africa Market Volume (Metric tons) Forecast by Application, 2020-2035

List of Figures

  • Figure 1: Global Market Volume (Metric tons) Forecast 2020-2035
  • Figure 2: Global Market Pricing Analysis
  • Figure 3: Global Market Value (USD Billion) Forecast 2020-2035
  • Figure 4: Global Market Value Share and BPS Analysis by Product Type, 2025 and 2035
  • Figure 5: Global Market Y-o-Y Growth Comparison by Product Type, 2025-2035
  • Figure 6: Global Market Attractiveness Analysis by Product Type
  • Figure 7: Global Market Value Share and BPS Analysis by Application, 2025 and 2035
  • Figure 8: Global Market Y-o-Y Growth Comparison by Application, 2025-2035
  • Figure 9: Global Market Attractiveness Analysis by Application
  • Figure 10: Global Market Value (USD Billion) Share and BPS Analysis by Region, 2025 and 2035
  • Figure 11: Global Market Y-o-Y Growth Comparison by Region, 2025-2035
  • Figure 12: Global Market Attractiveness Analysis by Region
  • Figure 13: North America Market Incremental $ Opportunity, 2025-2035
  • Figure 14: Latin America Market Incremental $ Opportunity, 2025-2035
  • Figure 15: Western Europe Market Incremental $ Opportunity, 2025-2035
  • Figure 16: Eastern Europe Market Incremental $ Opportunity, 2025-2035
  • Figure 17: East Asia Market Incremental $ Opportunity, 2025-2035
  • Figure 18: South Asia & Pacific Market Incremental $ Opportunity, 2025-2035
  • Figure 19: Middle East and Africa Market Incremental $ Opportunity, 2025-2035
  • Figure 20: North America Market Value Share and BPS Analysis by Country, 2025 and 2035
  • Figure 21: North America Market Value Share and BPS Analysis by Product Type, 2025 and 2035
  • Figure 22: North America Market Y-o-Y Growth Comparison by Product Type, 2025-2035
  • Figure 23: North America Market Attractiveness Analysis by Product Type
  • Figure 24: North America Market Value Share and BPS Analysis by Application, 2025 and 2035
  • Figure 25: North America Market Y-o-Y Growth Comparison by Application, 2025-2035
  • Figure 26: North America Market Attractiveness Analysis by Application
  • Figure 27: Latin America Market Value Share and BPS Analysis by Country, 2025 and 2035
  • Figure 28: Latin America Market Value Share and BPS Analysis by Product Type, 2025 and 2035
  • Figure 29: Latin America Market Y-o-Y Growth Comparison by Product Type, 2025-2035
  • Figure 30: Latin America Market Attractiveness Analysis by Product Type
  • Figure 31: Latin America Market Value Share and BPS Analysis by Application, 2025 and 2035
  • Figure 32: Latin America Market Y-o-Y Growth Comparison by Application, 2025-2035
  • Figure 33: Latin America Market Attractiveness Analysis by Application
  • Figure 34: Western Europe Market Value Share and BPS Analysis by Country, 2025 and 2035
  • Figure 35: Western Europe Market Value Share and BPS Analysis by Product Type, 2025 and 2035
  • Figure 36: Western Europe Market Y-o-Y Growth Comparison by Product Type, 2025-2035
  • Figure 37: Western Europe Market Attractiveness Analysis by Product Type
  • Figure 38: Western Europe Market Value Share and BPS Analysis by Application, 2025 and 2035
  • Figure 39: Western Europe Market Y-o-Y Growth Comparison by Application, 2025-2035
  • Figure 40: Western Europe Market Attractiveness Analysis by Application
  • Figure 41: Eastern Europe Market Value Share and BPS Analysis by Country, 2025 and 2035
  • Figure 42: Eastern Europe Market Value Share and BPS Analysis by Product Type, 2025 and 2035
  • Figure 43: Eastern Europe Market Y-o-Y Growth Comparison by Product Type, 2025-2035
  • Figure 44: Eastern Europe Market Attractiveness Analysis by Product Type
  • Figure 45: Eastern Europe Market Value Share and BPS Analysis by Application, 2025 and 2035
  • Figure 46: Eastern Europe Market Y-o-Y Growth Comparison by Application, 2025-2035
  • Figure 47: Eastern Europe Market Attractiveness Analysis by Application
  • Figure 48: East Asia Market Value Share and BPS Analysis by Country, 2025 and 2035
  • Figure 49: East Asia Market Value Share and BPS Analysis by Product Type, 2025 and 2035
  • Figure 50: East Asia Market Y-o-Y Growth Comparison by Product Type, 2025-2035
  • Figure 51: East Asia Market Attractiveness Analysis by Product Type
  • Figure 52: East Asia Market Value Share and BPS Analysis by Application, 2025 and 2035
  • Figure 53: East Asia Market Y-o-Y Growth Comparison by Application, 2025-2035
  • Figure 54: East Asia Market Attractiveness Analysis by Application
  • Figure 55: South Asia & Pacific Market Value Share and BPS Analysis by Country, 2025 and 2035
  • Figure 56: South Asia & Pacific Market Value Share and BPS Analysis by Product Type, 2025 and 2035
  • Figure 57: South Asia & Pacific Market Y-o-Y Growth Comparison by Product Type, 2025-2035
  • Figure 58: South Asia & Pacific Market Attractiveness Analysis by Product Type
  • Figure 59: South Asia & Pacific Market Value Share and BPS Analysis by Application, 2025 and 2035
  • Figure 60: South Asia & Pacific Market Y-o-Y Growth Comparison by Application, 2025-2035
  • Figure 61: South Asia & Pacific Market Attractiveness Analysis by Application
  • Figure 62: Middle East and Africa Market Value Share and BPS Analysis by Country, 2025 and 2035
  • Figure 63: Middle East and Africa Market Value Share and BPS Analysis by Product Type, 2025 and 2035
  • Figure 64: Middle East and Africa Market Y-o-Y Growth Comparison by Product Type, 2025-2035
  • Figure 65: Middle East and Africa Market Attractiveness Analysis by Product Type
  • Figure 66: Middle East and Africa Market Value Share and BPS Analysis by Application, 2025 and 2035
  • Figure 67: Middle East and Africa Market Y-o-Y Growth Comparison by Application, 2025-2035
  • Figure 68: Middle East and Africa Market Attractiveness Analysis by Application
  • Figure 69: Global Market - Tier Structure Analysis
  • Figure 70: Global Market - Company Share Analysis

Frequently Asked Questions

What is the estimated market size of the functional carbohydrate industry in 2025?

The industry is valued at USD 8.3 billion in 2025.

What is the projected industry size of the functional carbohydrate industry by 2035?

It is forecasted to reach USD 18.2 billion by 2035.

What is the expected CAGR for the functional carbohydrate industry between 2025 and 2035?

The industry is anticipated to grow at a CAGR of 8.3% during this period.

Which segment is expected to lead the functional carbohydrate market in 2035?

Food and Beverages are projected to lead the market with a 44.3% share in 2035.

Which region is expected to witness the highest growth in the functional carbohydrate market?

Asia Pacific, particularly China, is expected to be the key growth region with a projected growth rate of 10.2%.

Explore Similar Insights

Future Market Insights

Functional Carbohydrate Market