Almond Protein Market Size, Share, and Forecast Outlook 2025 to 2035

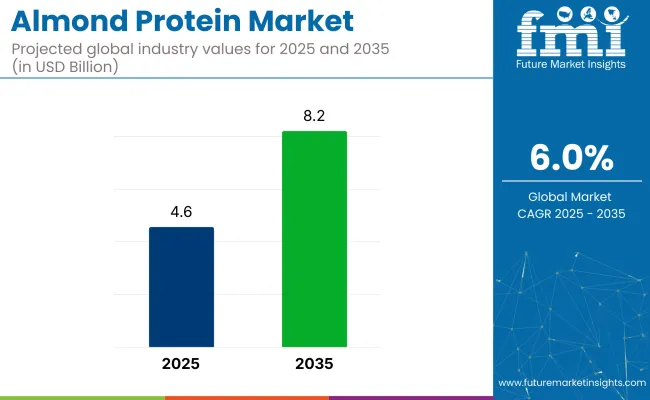
The almond protein market is expected to rise from USD 4.6 billion in 2025 to USD 8.2 billion by 2035, registering a CAGR of 6% over the forecast period. Growth is likely to be driven by rising demand for plant-based protein alternatives, particularly in dairy-free, gluten-free, and clean-label nutrition products.
Quick Stats in Almond Protein Market

  • Market Value (2025): USD 4.6 billion
  • Forecast Value (2035): USD 8.2 billion
  • Forecast CAGR: 6%
  • Top Application Segment: Beverages (45% market share in 2025)
  • Leading Distribution Channel: Online (40% market share in 2025)
  • Key Growth Country: Germany (7.8% CAGR)

Almond Protein Market

Metric Value
Market Size in 2025 USD 4.6 billion
Projected Market Size in 2035 USD 8.2 billion
CAGR (2025 to 2035) 6%

North America continues to be the largest producer and consumer, while Europe and East Asia are increasingly adopting almond protein across functional foods and supplements.

In 2025, the almond protein market holds a small but steadily growing share across several broader parent markets. Within the global plant-based protein market, it contributes approximately 2-3%, as it competes with soy, pea, and rice proteins for clean-label, allergen-friendly applications. In the nut ingredients market, almond protein makes up about 4-6%, driven by increased demand for high-protein formulations from almonds.

Within the dairy alternatives market, its share is around 1-2%, primarily in protein-fortified plant-based milks and yogurts. In the functional food ingredients market, almond protein contributes roughly 1-2%, valued for its nutritional profile and mild taste. In the sports and nutrition supplements market, its presence is estimated at 1-1.5%, as a niche option among plant-based protein powders.

Processing innovations such as cold-press defatting and fine-particle milling are helping manufacturers retain more nutrients and improve solubility. As brands position themselves around clean and simple ingredients, almond protein is being marketed not just as a supplement, but as a whole-food-based protein source. With increased focus on digestive tolerance, taste optimization, and versatile functionality, almond protein is well-placed to become a foundational ingredient across wellness-focused food formulations.

Analyzing Almond Protein Market by Top Investment Segments

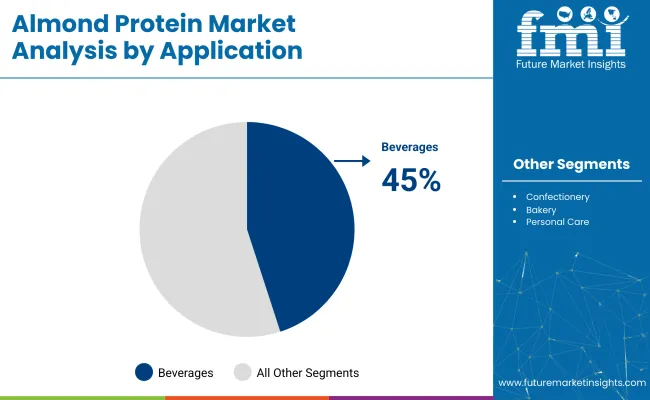
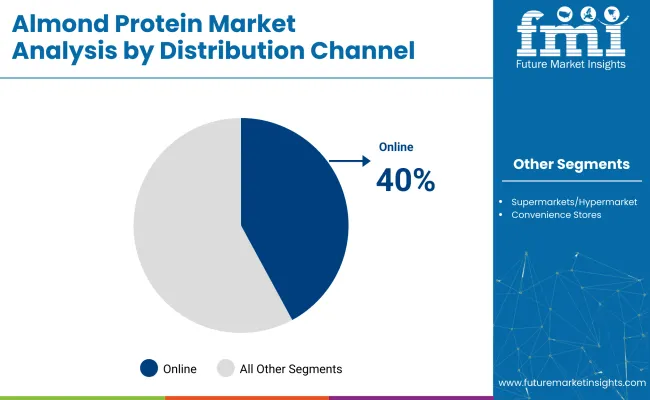
Beverages are expected to lead the application segment with a 45% market share by 2025, while online platforms are anticipated to dominate the distribution channel segment with a 40% share, supported by growing demand for plant-based protein alternatives and the convenience of digital retail.

Beverages to Dominate the Application Segment with 45% Market Share

Almond protein is projected to command 45% of the application segment in beverages by 2025, driven by rising consumer preference for dairy alternatives and clean-label formulations.
  • Functional beverages incorporating almond protein have gained popularity among health-conscious consumers seeking plant-based nutrition. These products offer high digestibility, mild flavor, and essential amino acids.
  • Increased innovation in vegan drinks, smoothies, and meal replacements, almond protein is being incorporated into ready-to-drink formats. Beverage producers are also leveraging almond protein for its creamy texture and emulsifying properties, making it a preferred ingredient in non-dairy beverages.

Almond Protein Market Analysis By Application

Online to Lead the Distribution Channel Segment with 40% Market Share

Online distribution channels are set to hold 40% of the market share for almond protein products by 2025, fueled by increasing e-commerce adoption and the expansion of health-focused digital retail.
  • Almond protein powders and supplements are frequently purchased via online platforms due to greater product variety, detailed nutritional information, and attractive pricing. Consumer trust in digital health and wellness stores has grown significantly.
  • Digital channels enable direct-to-consumer marketing strategies and subscription-based models for almond protein brands. The convenience of doorstep delivery and growing interest in vegan protein options are encouraging online shopping, particularly among millennials and fitness enthusiasts.

Almond Protein Market Analysis By Distribution Channel

Top Almond Protein Market Dynamics

The market is experiencing strong growth driven by rising consumer interest in plant-based nutrition, clean-label ingredients, and allergen-friendly alternatives to soy and dairy. Manufacturers are expanding almond protein applications across beverages, snacks, and sports nutrition, with a focus on flavor, texture, and sustainability.

Expanding Use in Plant-Based Beverages and Dairy Alternatives

Almond protein is increasingly used in plant-based milk, yogurts, and creamers to boost protein content while maintaining a smooth texture and mild taste. Its neutral flavor and compatibility with other plant-based ingredients make it a preferred choice for clean-label formulations. As consumer demand for non-dairy, allergen-conscious products rises, almond protein is gaining traction among health-conscious buyers.

  • Used to enhance protein content in almond milk and dairy-free yogurts.
  • Favored for clean-label, soy-free, and allergen-friendly product development.
  • Delivers smooth texture and mild flavor in plant-based beverage applications.

Rising Adoption in Protein Powders, Bars, and Functional Snacks

Almond protein is gaining popularity in the sports nutrition and healthy snacking segments due to its high nutrient density, digestibility, and plant-based origin. It is used in protein shakes, bars, and meal replacements to provide a balanced amino acid profile and sustained energy. Consumers seeking natural and minimally processed protein options increasingly prefer almond over highly processed isolates.
  • Included in protein powders and bars for plant-based nutritional support.
  • Offers digestible, minimally processed protein for clean-label formulations.
  • Used in functional snacks targeting fitness, energy, and meal replacement needs.

Analysis of Top Countries Developing, Processing, and Consuming Almond Protein Globally

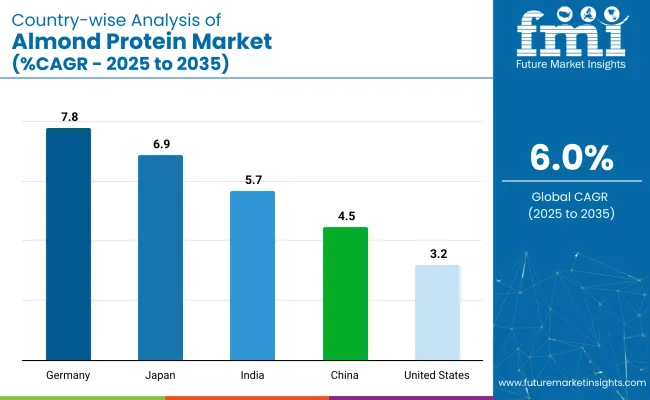
Country Wise Analysis Of Almond Protein Market

Countries CAGR (2025 to 2035)
Germany 7.8%
Japan 6.9%
India 5.7%
China 4.5%
United States 3.2%

The almond protein market is gaining momentum globally as plant-based diets continue to rise, and consumers seek clean-label, allergen-friendly, and high-protein alternatives to dairy and soy. From 2025 to 2035, the market is projected to grow steadily, with Germany leading the top five countries at a CAGR of 7.8%, followed by Japan (6.9%), India (5.7%), China (4.5%), and the USA (3.2%). Growth is being driven by demand in functional foods, sports nutrition, plant-based beverages, and non-dairy baked goods.

OECD countries such as Germany, Japan, and the USA are investing in ingredient purity, innovation, and traceability. BRICS countries like China and India are scaling production and tapping into their growing urban wellness consumer bases.

The report provides insights across 40+ countries. The five below are highlighted for their strategic influence and growth trajectory.

Germany Almond Protein Market Outlook

Germany is projected to grow at a CAGR of 7.8%, the highest among key countries, as consumer interest in vegan protein and allergen-free food alternatives continues to surge. As part of the EU27, OECD, and Sustainability-Focused Nations, Germany emphasizes traceability, organic sourcing, and reduced environmental impact.

Almond protein is being adopted in plant-based yogurts, snack bars, and meat alternatives as a functional, soy-free option. Retailers are pushing clean-label and low-processed ingredient claims, prompting food manufacturers to reformulate with high-protein nut-based ingredients.

  • Strong clean-label demand is accelerating almond protein use.
  • Applications expanding in dairy-free, soy-free, and keto products.
  • Sustainability credentials align with consumer and EU priorities.

Japan Almond Protein Market Performance

Japan is expected to grow at a CAGR of 6.9%, supported by demand for functional nutrition in aging populations and premium non-dairy formulations. As an OECD country with a reputation for innovation and safety, Japan favors almond protein in applications such as protein-enriched drinks, healthy confectionery, and gluten-free bakery.

Consumer interest in natural ingredients and low-allergen alternatives is prompting major food brands to incorporate almond protein in fortified foods. Domestic processors are also exploring almond protein in beauty supplements and clinical nutrition blends targeting gut health and metabolism.

  • Used in functional foods for seniors and health-conscious adults.
  • Integration into beauty and clinical nutrition supplements is rising.
  • Consumer preference leans toward clean, allergen-friendly proteins.

India Almond Protein Market Trends

Indian market is projected to grow at a CAGR of 5.7%, driven by increased awareness of plant-based nutrition and changing dietary patterns. As a BRICS and Emerging Market, India is witnessing growth in non-dairy protein sources for vegetarian consumers, with almond protein gaining favor in nutritional shakes, energy snacks, and diabetic-friendly foods.

Domestic startups are introducing almond protein blends in meal replacement powders and fortified drink mixes. Growth is further supported by urban demand for low-carb, lactose-free options among fitness-conscious consumers.

  • Non-dairy and diabetic food sectors are driving almond protein use.
  • Startups introducing almond-based protein blends for daily nutrition.
  • Urban consumers adopting almond protein for low-carb diets.

China Almond Protein Market Overview

China is forecast to grow at a CAGR of 4.5%, fueled by growing demand for plant-based ingredients in meal replacements, snacks, and beverage categories. As a BRICS and Protein-Transition Market, China is investing in functional nutrition platforms that support weight management, gut health, and lactose-free lifestyles.

Almond protein is gaining visibility in premium ready-to-drink shakes and imported wellness products. Domestic producers are also exploring almond protein as a cleaner alternative to soy, particularly in urban Tier 1 cities where Western-style diets are gaining ground.

  • Almond protein used in RTD shakes and functional snack bars.
  • Local brands exploring almond as a soy-free protein alternative.
  • Demand concentrated in urban, health-aware consumer segments.

USA Almond Protein Market Insights

The USA market is expected to grow at a CAGR of 3.2%, reflecting its position as a mature but innovation-driven space. As an OECD and Agri-food Tech Pioneer, the USA leads in almond production, providing a strong foundation for protein extraction.

Growth is led by food-tech firms developing almond protein for plant-based milks, protein powders, and clean-label bars. While pea and soy dominate the market, almond protein is gaining a niche presence due to its hypoallergenic appeal and smooth flavor. Sustainability efforts are also steering manufacturers toward value-added almond co-products.

  • Almond protein gaining traction in bars, powders, and RTD drinks.
  • Hypoallergenic appeal supports use in kids’ and senior nutrition.
  • Innovation centers on co-product utilization and zero-waste strategies.

Leading Almond Protein Brands

The market is moderately fragmented, with a mix of established nutraceutical players and emerging natural ingredient specialists driving innovation. Blue Diamond Ingredients and Almond Pro Foods are key players offering high-purity almond protein powders catering to the growing demand for plant-based and allergen-friendly nutrition. Noosh Brands differentiates with value-added almond protein formulations focused on sports and wellness markets.

BASF and Sabinsa Corporation contribute by incorporating almond-derived bioactives into broader nutraceutical and functional food applications. Companies like InovoBiologic Inc., BioFlora LLC, and Celtic Sea Minerals are exploring synergies between almond protein and mineral or botanical blends. AlescoS.r.l. and Humates and Seaweeds Pvt Ltd focus on clean-label and organic product development, enhancing competitiveness in niche consumer segments.

Recent Almond Protein Industry News

In September 2024, Blue Diamond Growers partnered with Divert, Inc. to repurpose almond processing byproducts into renewable energy. The initiative centers aroundDivert’s Turlock, California facility, which has the capacity to process up to 100,000 tons of organic waste annually.

Leading Players in Almond Protein Industry

  • InovoBiologic Inc.
  • Celtic Sea Minerals
  • Maxicrop USA
  • BioFlora, LLC
  • AlescoS.r.l.
  • Humates and Seaweeds Pvt Ltd
  • Blue Diamond Ingredients
  • Noosh Brands
  • Almond Pro Foods
  • BASF
  • Sabinsa Corporation

Report Coverage and Scope Summary

Report Attributes Details
Market Size (2025) USD 4.6 billion
Projected Market Size (2035) USD 8.2 billion
CAGR (2025 to 2035) 6%
Base Year for Estimation 2024
Historical Period 2020 to 2024
Projections Period 2025 to 2035
Quantitative Units USD billion for market value
Applications Analyzed (Segment 1) Beverages, Confectionery & Bakery, Personal Care
Distribution Channels Analyzed Online Platforms, Supermarkets/Hypermarkets, Convenience Stores
Regions Covered North America, Latin America, Western Europe, Eastern Europe, East Asia, South Asia & Pacific, Central Asia, Russia & Belarus, Balkan & Baltic Countries, Middle East & Africa
Countries Covered United States, Canada, Germany, United Kingdom, France, Japan, China, India, South Korea, Brazil
Key Players InovoBiologic Inc., Celtic Sea Minerals, Maxicrop USA, BioFlora LLC, Alesco S.r.l ., Humates and Seaweeds Pvt Ltd, Blue Diamond Ingredients, Noosh Brands, Almond Pro Foods, BASF, Sabinsa Corporation
Additional Attributes Dollar sales by application and distribution, growing demand in plant-based nutrition, expansion of clean-label food offerings, and increased retail visibility across global health-conscious markets.

Key Segments

By Application:

The product is used in beverages, confectionery and bakery, and personal care.

By Distribution Channel:

Sales take place through online platforms, supermarkets/hypermarkets, and convenience stores.

By Region:

The market is segmented as North America, Latin America, Western Europe, Eastern Europe, East Asia, South Asia & Pacific, Central Asia, Russia and Belarus, Balkan & Baltic Countries, Middle East and Africa.

Table of Content

  1. Executive Summary
    • Global Market Outlook
    • Demand-side Trends
    • Supply-side Trends
    • Technology Roadmap Analysis
    • Analysis and Recommendations
  2. Market Overview
    • Market Coverage / Taxonomy
    • Market Definition / Scope / Limitations
  3. Market Background
    • Market Dynamics
      • Drivers
      • Restraints
      • Opportunity
      • Trends
    • Scenario Forecast
      • Demand in Optimistic Scenario
      • Demand in Likely Scenario
      • Demand in Conservative Scenario
    • Opportunity Map Analysis
    • Product Life Cycle Analysis
    • Supply Chain Analysis
      • Supply Side Participants and their Roles
        • Producers
        • Mid-Level Participants (Traders/ Agents/ Brokers)
        • Wholesalers and Distributors
      • Value Added and Value Created at Node in the Supply Chain
      • List of Raw Material Suppliers
      • List of Existing and Potential Buyer’s
    • Investment Feasibility Matrix
    • Value Chain Analysis
      • Profit Margin Analysis
      • Wholesalers and Distributors
      • Retailers
    • PESTLE and Porter’s Analysis
    • Regulatory Landscape
      • By Key Regions
      • By Key Countries
    • Regional Parent Market Outlook
    • Production and Consumption Statistics
    • Import and Export Statistics
  4. Global Market Analysis 2020 to 2024 and Forecast, 2025 to 2035
    • Historical Market Size Value (USD Billion) & Volume (Metric tons) Analysis, 2020 to 2024
    • Current and Future Market Size Value (USD Billion) & Volume (Metric tons) Projections, 2025 to 2035
      • Y-o-Y Growth Trend Analysis
      • Absolute $ Opportunity Analysis
  5. Global Market Pricing Analysis 2020 to 2024 and Forecast 2025 to 2035
  6. Global Market Analysis 2020 to 2024 and Forecast 2025 to 2035, By Application
    • Introduction / Key Findings
    • Historical Market Size Value (USD Billion) & Volume (Metric tons) Analysis By Application, 2020 to 2024
    • Current and Future Market Size Value (USD Billion) & Volume (Metric tons) Analysis and Forecast By Application, 2025 to 2035
      • Beverages
      • Confectionery & Bakery
      • Personal Care
    • Y-o-Y Growth Trend Analysis By Application, 2020 to 2024
    • Absolute $ Opportunity Analysis By Application, 2025 to 2035
  7. Global Market Analysis 2020 to 2024 and Forecast 2025 to 2035, By Distribution Channel
    • Introduction / Key Findings
    • Historical Market Size Value (USD Billion) & Volume (Metric tons) Analysis By Distribution Channel, 2020 to 2024
    • Current and Future Market Size Value (USD Billion) & Volume (Metric tons) Analysis and Forecast By Distribution Channel, 2025 to 2035
      • Online
      • Supermarkets/Hypermarkets
      • Convenience Store
    • Y-o-Y Growth Trend Analysis By Distribution Channel, 2020 to 2024
    • Absolute $ Opportunity Analysis By Distribution Channel, 2025 to 2035
  8. Global Market Analysis 2020 to 2024 and Forecast 2025 to 2035, By Region
    • Introduction
    • Historical Market Size Value (USD Billion) & Volume (Metric tons) Analysis By Region, 2020 to 2024
    • Current Market Size Value (USD Billion) & Volume (Metric tons) Analysis and Forecast By Region, 2025 to 2035
      • North America
      • Latin America
      • Western Europe
      • Eastern Europe
      • East Asia
      • South Asia & Pacific
      • Middle East and Africa
    • Market Attractiveness Analysis By Region
  9. North America Market Analysis 2020 to 2024 and Forecast 2025 to 2035, By Country
    • Historical Market Size Value (USD Billion) & Volume (Metric tons) Trend Analysis By Market Taxonomy, 2020 to 2024
    • Market Size Value (USD Billion) & Volume (Metric tons) Forecast By Market Taxonomy, 2025 to 2035
      • By Country
        • USA
        • Canada
        • Mexico
      • By Application
      • By Distribution Channel
    • Market Attractiveness Analysis
      • By Country
      • By Application
      • By Distribution Channel
    • Key Takeaways
  10. Latin America Market Analysis 2020 to 2024 and Forecast 2025 to 2035, By Country
    • Historical Market Size Value (USD Billion) & Volume (Metric tons) Trend Analysis By Market Taxonomy, 2020 to 2024
    • Market Size Value (USD Billion) & Volume (Metric tons) Forecast By Market Taxonomy, 2025 to 2035
      • By Country
        • Brazil
        • Argentina
        • Rest of LATAM
      • By Application
      • By Distribution Channel
    • Market Attractiveness Analysis
      • By Country
      • By Application
      • By Distribution Channel
    • Key Takeaways
  11. Western Europe Market Analysis 2020 to 2024 and Forecast 2025 to 2035, By Country
    • Historical Market Size Value (USD Billion) & Volume (Metric tons) Trend Analysis By Market Taxonomy, 2020 to 2024
    • Market Size Value (USD Billion) & Volume (Metric tons) Forecast By Market Taxonomy, 2025 to 2035
      • By Country
        • Germany
        • Italy
        • France
        • UK
        • Spain
        • BENELUX
        • Nordic
        • Rest of W.Europe
      • By Application
      • By Distribution Channel
    • Market Attractiveness Analysis
      • By Country
      • By Application
      • By Distribution Channel
    • Key Takeaways
  12. Eastern Europe Market Analysis 2020 to 2024 and Forecast 2025 to 2035, By Country
    • Historical Market Size Value (USD Billion) & Volume (Metric tons) Trend Analysis By Market Taxonomy, 2020 to 2024
    • Market Size Value (USD Billion) & Volume (Metric tons) Forecast By Market Taxonomy, 2025 to 2035
      • By Country
        • Russia
        • Hungary
        • Poland
        • Balkan & Baltics
        • Rest of E. Europe
      • By Application
      • By Distribution Channel
    • Market Attractiveness Analysis
      • By Country
      • By Application
      • By Distribution Channel
    • Key Takeaways
  13. East Asia Market Analysis 2020 to 2024 and Forecast 2025 to 2035, By Country
    • Historical Market Size Value (USD Billion) & Volume (Metric tons) Trend Analysis By Market Taxonomy, 2020 to 2024
    • Market Size Value (USD Billion) & Volume (Metric tons) Forecast By Market Taxonomy, 2025 to 2035
      • By Country
        • China
        • Japan
        • South Korea
      • By Application
      • By Distribution Channel
    • Market Attractiveness Analysis
      • By Country
      • By Application
      • By Distribution Channel
    • Key Takeaways
  14. South Asia & Pacific Market Analysis 2020 to 2024 and Forecast 2025 to 2035, By Country
    • Historical Market Size Value (USD Billion) & Volume (Metric tons) Trend Analysis By Market Taxonomy, 2020 to 2024
    • Market Size Value (USD Billion) & Volume (Metric tons) Forecast By Market Taxonomy, 2025 to 2035
      • By Country
        • India
        • Australia & New Zealand
        • ASEAN
        • Rest of SAP
      • By Application
      • By Distribution Channel
    • Market Attractiveness Analysis
      • By Country
      • By Application
      • By Distribution Channel
    • Key Takeaways
  15. Middle East and Africa Market Analysis 2020 to 2024 and Forecast 2025 to 2035, By Country
    • Historical Market Size Value (USD Billion) & Volume (Metric tons) Trend Analysis By Market Taxonomy, 2020 to 2024
    • Market Size Value (USD Billion) & Volume (Metric tons) Forecast By Market Taxonomy, 2025 to 2035
      • By Country
        • GCC Countries
        • Northern Africa
        • South Africa
        • Turkiye
        • Rest of MEA
      • By Application
      • By Distribution Channel
    • Market Attractiveness Analysis
      • By Country
      • By Application
      • By Distribution Channel
    • Key Takeaways
  16. Key Countries Market Analysis
    • USA
      • Pricing Analysis
      • Market Share Analysis, 2024
        • By Application
        • By Distribution Channel
    • Canada
      • Pricing Analysis
      • Market Share Analysis, 2024
        • By Application
        • By Distribution Channel
    • Brazil
      • Pricing Analysis
      • Market Share Analysis, 2024
        • By Application
        • By Distribution Channel
    • Mexico
      • Pricing Analysis
      • Market Share Analysis, 2024
        • By Application
        • By Distribution Channel
    • Argentina
      • Pricing Analysis
      • Market Share Analysis, 2024
        • By Application
        • By Distribution Channel
  17. Market Structure Analysis
    • Competition Dashboard
    • Competition Benchmarking
    • Market Share Analysis of Top Players
      • By Regional
      • By Application
      • By Distribution Channel
  18. Competition Analysis
    • Competition Deep Dive
      • InovoBiologic Inc.
        • Overview
        • Product Portfolio
        • Profitability by Market Segments (Product/Age /Sales Channel/Region)
        • Sales Footprint
        • Strategy Overview
          • Marketing Strategy
          • Product Strategy
          • Channel Strategy
      • Celtic Sea Minerals
        • Overview
        • Product Portfolio
        • Profitability by Market Segments (Product/Age /Sales Channel/Region)
        • Sales Footprint
        • Strategy Overview
          • Marketing Strategy
          • Product Strategy
          • Channel Strategy
      • Maxicrop USA
        • Overview
        • Product Portfolio
        • Profitability by Market Segments (Product/Age /Sales Channel/Region)
        • Sales Footprint
        • Strategy Overview
          • Marketing Strategy
          • Product Strategy
          • Channel Strategy
      • BioFlora, LLC
        • Overview
        • Product Portfolio
        • Profitability by Market Segments (Product/Age /Sales Channel/Region)
        • Sales Footprint
        • Strategy Overview
          • Marketing Strategy
          • Product Strategy
          • Channel Strategy
      • Alesco S.r.l.
        • Overview
        • Product Portfolio
        • Profitability by Market Segments (Product/Age /Sales Channel/Region)
        • Sales Footprint
        • Strategy Overview
          • Marketing Strategy
          • Product Strategy
          • Channel Strategy
      • Humates and Seaweeds Pvt Ltd
        • Overview
        • Product Portfolio
        • Profitability by Market Segments (Product/Age /Sales Channel/Region)
        • Sales Footprint
        • Strategy Overview
          • Marketing Strategy
          • Product Strategy
          • Channel Strategy
      • Blue Diamond Ingredients
        • Overview
        • Product Portfolio
        • Profitability by Market Segments (Product/Age /Sales Channel/Region)
        • Sales Footprint
        • Strategy Overview
          • Marketing Strategy
          • Product Strategy
          • Channel Strategy
      • Noosh Brands
        • Overview
        • Product Portfolio
        • Profitability by Market Segments (Product/Age /Sales Channel/Region)
        • Sales Footprint
        • Strategy Overview
          • Marketing Strategy
          • Product Strategy
          • Channel Strategy
      • Almond Pro Foods
        • Overview
        • Product Portfolio
        • Profitability by Market Segments (Product/Age /Sales Channel/Region)
        • Sales Footprint
        • Strategy Overview
          • Marketing Strategy
          • Product Strategy
          • Channel Strategy
      • BASF
        • Overview
        • Product Portfolio
        • Profitability by Market Segments (Product/Age /Sales Channel/Region)
        • Sales Footprint
        • Strategy Overview
          • Marketing Strategy
          • Product Strategy
          • Channel Strategy
      • Sabinsa Corporation
        • Overview
        • Product Portfolio
        • Profitability by Market Segments (Product/Age /Sales Channel/Region)
        • Sales Footprint
        • Strategy Overview
          • Marketing Strategy
          • Product Strategy
          • Channel Strategy
  19. Assumptions & Acronyms Used
  20. Research Methodology

List of Tables

  • Table 1: Global Market Value (USD Billion) Forecast by Region, 2020-2035
  • Table 2: Global Market Volume (Metric tons) Forecast by Region, 2020-2035
  • Table 3: Global Market Value (USD Billion) Forecast by Application, 2020-2035
  • Table 4: Global Market Volume (Metric tons) Forecast by Application, 2020-2035
  • Table 5: Global Market Value (USD Billion) Forecast by Distribution Channel, 2020-2035
  • Table 6: Global Market Volume (Metric tons) Forecast by Distribution Channel, 2020-2035
  • Table 7: North America Market Value (USD Billion) Forecast by Country, 2020-2035
  • Table 8: North America Market Volume (Metric tons) Forecast by Country, 2020-2035
  • Table 9: North America Market Value (USD Billion) Forecast by Application, 2020-2035
  • Table 10: North America Market Volume (Metric tons) Forecast by Application, 2020-2035
  • Table 11: North America Market Value (USD Billion) Forecast by Distribution Channel, 2020-2035
  • Table 12: North America Market Volume (Metric tons) Forecast by Distribution Channel, 2020-2035
  • Table 13: Latin America Market Value (USD Billion) Forecast by Country, 2020-2035
  • Table 14: Latin America Market Volume (Metric tons) Forecast by Country, 2020-2035
  • Table 15: Latin America Market Value (USD Billion) Forecast by Application, 2020-2035
  • Table 16: Latin America Market Volume (Metric tons) Forecast by Application, 2020-2035
  • Table 17: Latin America Market Value (USD Billion) Forecast by Distribution Channel, 2020-2035
  • Table 18: Latin America Market Volume (Metric tons) Forecast by Distribution Channel, 2020-2035
  • Table 19: Western Europe Market Value (USD Billion) Forecast by Country, 2020-2035
  • Table 20: Western Europe Market Volume (Metric tons) Forecast by Country, 2020-2035
  • Table 21: Western Europe Market Value (USD Billion) Forecast by Application, 2020-2035
  • Table 22: Western Europe Market Volume (Metric tons) Forecast by Application, 2020-2035
  • Table 23: Western Europe Market Value (USD Billion) Forecast by Distribution Channel, 2020-2035
  • Table 24: Western Europe Market Volume (Metric tons) Forecast by Distribution Channel, 2020-2035
  • Table 25: Eastern Europe Market Value (USD Billion) Forecast by Country, 2020-2035
  • Table 26: Eastern Europe Market Volume (Metric tons) Forecast by Country, 2020-2035
  • Table 27: Eastern Europe Market Value (USD Billion) Forecast by Application, 2020-2035
  • Table 28: Eastern Europe Market Volume (Metric tons) Forecast by Application, 2020-2035
  • Table 29: Eastern Europe Market Value (USD Billion) Forecast by Distribution Channel, 2020-2035
  • Table 30: Eastern Europe Market Volume (Metric tons) Forecast by Distribution Channel, 2020-2035
  • Table 31: East Asia Market Value (USD Billion) Forecast by Country, 2020-2035
  • Table 32: East Asia Market Volume (Metric tons) Forecast by Country, 2020-2035
  • Table 33: East Asia Market Value (USD Billion) Forecast by Application, 2020-2035
  • Table 34: East Asia Market Volume (Metric tons) Forecast by Application, 2020-2035
  • Table 35: East Asia Market Value (USD Billion) Forecast by Distribution Channel, 2020-2035
  • Table 36: East Asia Market Volume (Metric tons) Forecast by Distribution Channel, 2020-2035
  • Table 37: South Asia & Pacific Market Value (USD Billion) Forecast by Country, 2020-2035
  • Table 38: South Asia & Pacific Market Volume (Metric tons) Forecast by Country, 2020-2035
  • Table 39: South Asia & Pacific Market Value (USD Billion) Forecast by Application, 2020-2035
  • Table 40: South Asia & Pacific Market Volume (Metric tons) Forecast by Application, 2020-2035
  • Table 41: South Asia & Pacific Market Value (USD Billion) Forecast by Distribution Channel, 2020-2035
  • Table 42: South Asia & Pacific Market Volume (Metric tons) Forecast by Distribution Channel, 2020-2035
  • Table 43: Middle East and Africa Market Value (USD Billion) Forecast by Country, 2020-2035
  • Table 44: Middle East and Africa Market Volume (Metric tons) Forecast by Country, 2020-2035
  • Table 45: Middle East and Africa Market Value (USD Billion) Forecast by Application, 2020-2035
  • Table 46: Middle East and Africa Market Volume (Metric tons) Forecast by Application, 2020-2035
  • Table 47: Middle East and Africa Market Value (USD Billion) Forecast by Distribution Channel, 2020-2035
  • Table 48: Middle East and Africa Market Volume (Metric tons) Forecast by Distribution Channel, 2020-2035

List of Figures

  • Figure 1: Global Market Volume (Metric tons) Forecast 2020-2035
  • Figure 2: Global Market Pricing Analysis
  • Figure 3: Global Market Value (USD Billion) Forecast 2020-2035
  • Figure 4: Global Market Value Share and BPS Analysis by Application, 2025 and 2035
  • Figure 5: Global Market Y-o-Y Growth Comparison by Application, 2025-2035
  • Figure 6: Global Market Attractiveness Analysis by Application
  • Figure 7: Global Market Value Share and BPS Analysis by Distribution Channel, 2025 and 2035
  • Figure 8: Global Market Y-o-Y Growth Comparison by Distribution Channel, 2025-2035
  • Figure 9: Global Market Attractiveness Analysis by Distribution Channel
  • Figure 10: Global Market Value (USD Billion) Share and BPS Analysis by Region, 2025 and 2035
  • Figure 11: Global Market Y-o-Y Growth Comparison by Region, 2025-2035
  • Figure 12: Global Market Attractiveness Analysis by Region
  • Figure 13: North America Market Incremental $ Opportunity, 2025-2035
  • Figure 14: Latin America Market Incremental $ Opportunity, 2025-2035
  • Figure 15: Western Europe Market Incremental $ Opportunity, 2025-2035
  • Figure 16: Eastern Europe Market Incremental $ Opportunity, 2025-2035
  • Figure 17: East Asia Market Incremental $ Opportunity, 2025-2035
  • Figure 18: South Asia & Pacific Market Incremental $ Opportunity, 2025-2035
  • Figure 19: Middle East and Africa Market Incremental $ Opportunity, 2025-2035
  • Figure 20: North America Market Value Share and BPS Analysis by Country, 2025 and 2035
  • Figure 21: North America Market Value Share and BPS Analysis by Application, 2025 and 2035
  • Figure 22: North America Market Y-o-Y Growth Comparison by Application, 2025-2035
  • Figure 23: North America Market Attractiveness Analysis by Application
  • Figure 24: North America Market Value Share and BPS Analysis by Distribution Channel, 2025 and 2035
  • Figure 25: North America Market Y-o-Y Growth Comparison by Distribution Channel, 2025-2035
  • Figure 26: North America Market Attractiveness Analysis by Distribution Channel
  • Figure 27: Latin America Market Value Share and BPS Analysis by Country, 2025 and 2035
  • Figure 28: Latin America Market Value Share and BPS Analysis by Application, 2025 and 2035
  • Figure 29: Latin America Market Y-o-Y Growth Comparison by Application, 2025-2035
  • Figure 30: Latin America Market Attractiveness Analysis by Application
  • Figure 31: Latin America Market Value Share and BPS Analysis by Distribution Channel, 2025 and 2035
  • Figure 32: Latin America Market Y-o-Y Growth Comparison by Distribution Channel, 2025-2035
  • Figure 33: Latin America Market Attractiveness Analysis by Distribution Channel
  • Figure 34: Western Europe Market Value Share and BPS Analysis by Country, 2025 and 2035
  • Figure 35: Western Europe Market Value Share and BPS Analysis by Application, 2025 and 2035
  • Figure 36: Western Europe Market Y-o-Y Growth Comparison by Application, 2025-2035
  • Figure 37: Western Europe Market Attractiveness Analysis by Application
  • Figure 38: Western Europe Market Value Share and BPS Analysis by Distribution Channel, 2025 and 2035
  • Figure 39: Western Europe Market Y-o-Y Growth Comparison by Distribution Channel, 2025-2035
  • Figure 40: Western Europe Market Attractiveness Analysis by Distribution Channel
  • Figure 41: Eastern Europe Market Value Share and BPS Analysis by Country, 2025 and 2035
  • Figure 42: Eastern Europe Market Value Share and BPS Analysis by Application, 2025 and 2035
  • Figure 43: Eastern Europe Market Y-o-Y Growth Comparison by Application, 2025-2035
  • Figure 44: Eastern Europe Market Attractiveness Analysis by Application
  • Figure 45: Eastern Europe Market Value Share and BPS Analysis by Distribution Channel, 2025 and 2035
  • Figure 46: Eastern Europe Market Y-o-Y Growth Comparison by Distribution Channel, 2025-2035
  • Figure 47: Eastern Europe Market Attractiveness Analysis by Distribution Channel
  • Figure 48: East Asia Market Value Share and BPS Analysis by Country, 2025 and 2035
  • Figure 49: East Asia Market Value Share and BPS Analysis by Application, 2025 and 2035
  • Figure 50: East Asia Market Y-o-Y Growth Comparison by Application, 2025-2035
  • Figure 51: East Asia Market Attractiveness Analysis by Application
  • Figure 52: East Asia Market Value Share and BPS Analysis by Distribution Channel, 2025 and 2035
  • Figure 53: East Asia Market Y-o-Y Growth Comparison by Distribution Channel, 2025-2035
  • Figure 54: East Asia Market Attractiveness Analysis by Distribution Channel
  • Figure 55: South Asia & Pacific Market Value Share and BPS Analysis by Country, 2025 and 2035
  • Figure 56: South Asia & Pacific Market Value Share and BPS Analysis by Application, 2025 and 2035
  • Figure 57: South Asia & Pacific Market Y-o-Y Growth Comparison by Application, 2025-2035
  • Figure 58: South Asia & Pacific Market Attractiveness Analysis by Application
  • Figure 59: South Asia & Pacific Market Value Share and BPS Analysis by Distribution Channel, 2025 and 2035
  • Figure 60: South Asia & Pacific Market Y-o-Y Growth Comparison by Distribution Channel, 2025-2035
  • Figure 61: South Asia & Pacific Market Attractiveness Analysis by Distribution Channel
  • Figure 62: Middle East and Africa Market Value Share and BPS Analysis by Country, 2025 and 2035
  • Figure 63: Middle East and Africa Market Value Share and BPS Analysis by Application, 2025 and 2035
  • Figure 64: Middle East and Africa Market Y-o-Y Growth Comparison by Application, 2025-2035
  • Figure 65: Middle East and Africa Market Attractiveness Analysis by Application
  • Figure 66: Middle East and Africa Market Value Share and BPS Analysis by Distribution Channel, 2025 and 2035
  • Figure 67: Middle East and Africa Market Y-o-Y Growth Comparison by Distribution Channel, 2025-2035
  • Figure 68: Middle East and Africa Market Attractiveness Analysis by Distribution Channel
  • Figure 69: Global Market - Tier Structure Analysis
  • Figure 70: Global Market - Company Share Analysis

Frequently Asked Questions

What is the projected size of the global almond protein market by 2035?

The market is expected to reach USD 8.2 billion by 2035.

What is the estimated market size of the global almond protein market in 2025?

The market size is projected to be USD 4.6 billion in 2025.

What is the CAGR of the almond protein market from 2025 to 2035?

The market is expected to grow at a CAGR of 6% from 2025 to 2035.

Which application segment leads the almond protein market in 2025?

Beverages are expected to lead the application segment with a 45% market share in 2025.

Which country is expected to record the highest CAGR in the almond protein market from 2025 to 2035?

Germany is anticipated to grow at the highest CAGR of 7.8% from 2025 to 2035.

Explore Similar Insights

Future Market Insights

Almond Protein Market