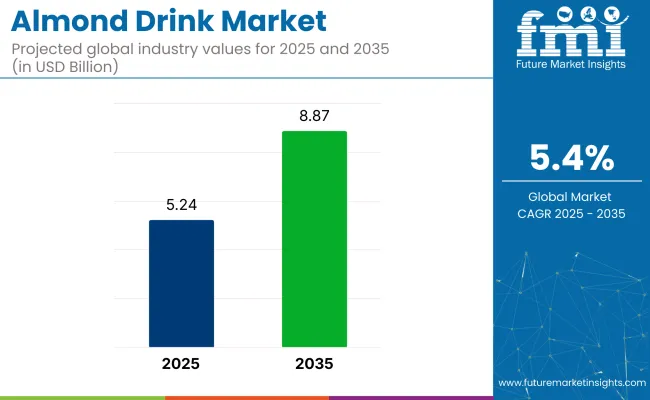
In 2023, the global almond drink market was valued at USD 4,719.5 million. The market is expected to reach approximately USD 7,751.1 million by 2033, with a growing CAGR of 5.1% from 2023 to 2033. These two crucial factors will boost the demand for almond drinks in the future.
Around the world, almond drinks are mostly consumed as milk substitutes which are widely popular amongst the health-conscious population. Almond milk is plant-based milk extracted from almonds, which is usually creamy in texture and nutty in flavor. The global almond drink market is also anticipated to boom during the forecast period owing to increasing application in the food and beverage industry and expanding patient populations suffering from lactose deficiency or intolerance.
Almond drinks are hugely popular and broadly accepted as a substitute for dairy substitutes because they offer several health benefits like stronger bones, aid in digestion, helps with weight management, and are a lactose-free alternative to dairy milk.
The global almond drink market is one of the most swiftly booming non-dairy and vegan milk sectors. The growing awareness of almond milk’s health benefits, along with increasing obesity in developed countries such as the USA, is accountable for the growth of the market.
Report Attribute | Details |
---|---|
Almond Drink Market Value (2023) | USD 4,719.5 million |
Almond Drink Market Anticipated Value (2033) | USD 7,751.1 million |
Almond Drink Projected Growth Rate (2023 to 2033) | 5.1% |
Lactose Intolerance
A growing number of populations who are lactose intolerant is one of the crucial factors responsible for the growth of the almond drinks market across the globe. These consumers are often looking for substitutes for dairy in their diets. Almond milk is the most preferred substitute since it is vegan, lactose-free, and high in plant protein. Therefore, the consumption of almond drinks is rising amongst this population.
Improving Taste
Lactose intolerant populations opt for almond milk mostly because of its nutty taste and because it’s a healthy option. Almond milk and other almond drinks also benefit those with hypercholesterolemia (very high levels of low-density lipoprotein (LDL) cholesterol in their blood).
Health Benefits
Almond drinks consist of polyunsaturated fatty acids which are effective in lowering cholesterol levels in the bloodstream and decreasing inflammation, therefore promoting the revenue growth of the almond milk market. Almond drinks enhance health and maintain balance in body weight which is projected to drive the growth of the almond drink market during the forecast period.
Growing Veganism
Recently, there has been an increase in the vegan population who do not consume animal products that consist of milk and eggs. Growing product acceptance by the vegan population is predicted to drive the almond drink market over the forecast period. Increasing concerns pertaining to animal welfare are growing amongst the mass population towards veganism.
Environmental Concerns
Besides, the prospective almond milk health benefits coupled with environmental protection are presently responsible for the growth of the market. The growing acceptance of veganism by consumers has been witnessed in developed countries and slowly but gradually the suburbs and cities of emerging countries too are catching up.
Consumers' Demand for Transparency of Products
Globally, there is a greater awareness among consumers who prefer eating clean. Such consumers prefer detailed information related to the sources of raw materials and the overall processing method of final products. Demand for detailed information on products has pushed manufacturers to deliver to the most satisfactory level.
The North American almond drink market is accountable for 32.5% market share globally.
This region's market is predicted to grow steadily during the forecast period due to the growing demand for ready-to-drink beverages and frozen desert. Consumers prefer healthy snacking over junk food, which will further impact the market's growth. Moreover, enhanced lifestyles and adopting healthy living with cleaner eating habits are said to promote the revenue growth of the North American market.
The health-conscious population of North America is more aware of the health benefits of consuming vegan, non-dairy, and non-GMO beverages. The growing adoption of almond drinks in the everyday life of consumers due to booming environmental concerns is anticipated to drive the regional market further.
The Europe region accounts for 28.4% market share in the global almond drinks market.
This region is witnessing considerable growth owing to the increasing popularity of flexitarian and vegan diets. Also, consumers' growing demand for functional beverages is likely to encourage the demand for almond drinks in Europe.
Mass awareness about veganism in European countries has led to even the younger population's option for vegan diets. Almond milk is the most popular vegan alternative to dairy milk and has been widely consumed by the youth of European countries.
Key Players in the Market
Fuerst Day Lawson
Fuerst Day Lawson is a company which offers a wide spectrum of products, along with almond milk. It is especially well known for its flavour in lattes and other forms of coffee beverages. It has markets in Europe, the Middle East, Asia, Australia, North America, Africa, and Central/South America.
The Pressery
The Pressery provides lactose-free, creamy, and delicious almond milk, among other dairy free drinks for vegan consumers. Their products are nutritious, high quality, and plant-based.
Recent Developments by the Existing Almond Drink Market Players
Table 1: Global Market Value (US$ Million) Forecast by Region, 2018 to 2033
Table 2: Global Market Volume (Litre) Forecast by Region, 2018 to 2033
Table 3: Global Market Value (US$ Million) Forecast by Form, 2018 to 2033
Table 4: Global Market Volume (Litre) Forecast by Form, 2018 to 2033
Table 5: Global Market Value (US$ Million) Forecast by Application, 2018 to 2033
Table 6: Global Market Volume (Litre) Forecast by Application, 2018 to 2033
Table 7: Global Market Value (US$ Million) Forecast by Distribution Channel, 2018 to 2033
Table 8: Global Market Volume (Litre) Forecast by Distribution Channel, 2018 to 2033
Table 9: North America Market Value (US$ Million) Forecast by Country, 2018 to 2033
Table 10: North America Market Volume (Litre) Forecast by Country, 2018 to 2033
Table 11: North America Market Value (US$ Million) Forecast by Form, 2018 to 2033
Table 12: North America Market Volume (Litre) Forecast by Form, 2018 to 2033
Table 13: North America Market Value (US$ Million) Forecast by Application, 2018 to 2033
Table 14: North America Market Volume (Litre) Forecast by Application, 2018 to 2033
Table 15: North America Market Value (US$ Million) Forecast by Distribution Channel, 2018 to 2033
Table 16: North America Market Volume (Litre) Forecast by Distribution Channel, 2018 to 2033
Table 17: Latin America Market Value (US$ Million) Forecast by Country, 2018 to 2033
Table 18: Latin America Market Volume (Litre) Forecast by Country, 2018 to 2033
Table 19: Latin America Market Value (US$ Million) Forecast by Form, 2018 to 2033
Table 20: Latin America Market Volume (Litre) Forecast by Form, 2018 to 2033
Table 21: Latin America Market Value (US$ Million) Forecast by Application, 2018 to 2033
Table 22: Latin America Market Volume (Litre) Forecast by Application, 2018 to 2033
Table 23: Latin America Market Value (US$ Million) Forecast by Distribution Channel, 2018 to 2033
Table 24: Latin America Market Volume (Litre) Forecast by Distribution Channel, 2018 to 2033
Table 25: Western Europe Market Value (US$ Million) Forecast by Country, 2018 to 2033
Table 26: Western Europe Market Volume (Litre) Forecast by Country, 2018 to 2033
Table 27: Western Europe Market Value (US$ Million) Forecast by Form, 2018 to 2033
Table 28: Western Europe Market Volume (Litre) Forecast by Form, 2018 to 2033
Table 29: Western Europe Market Value (US$ Million) Forecast by Application, 2018 to 2033
Table 30: Western Europe Market Volume (Litre) Forecast by Application, 2018 to 2033
Table 31: Western Europe Market Value (US$ Million) Forecast by Distribution Channel, 2018 to 2033
Table 32: Western Europe Market Volume (Litre) Forecast by Distribution Channel, 2018 to 2033
Table 33: Eastern Europe Market Value (US$ Million) Forecast by Country, 2018 to 2033
Table 34: Eastern Europe Market Volume (Litre) Forecast by Country, 2018 to 2033
Table 35: Eastern Europe Market Value (US$ Million) Forecast by Form, 2018 to 2033
Table 36: Eastern Europe Market Volume (Litre) Forecast by Form, 2018 to 2033
Table 37: Eastern Europe Market Value (US$ Million) Forecast by Application, 2018 to 2033
Table 38: Eastern Europe Market Volume (Litre) Forecast by Application, 2018 to 2033
Table 39: Eastern Europe Market Value (US$ Million) Forecast by Distribution Channel, 2018 to 2033
Table 40: Eastern Europe Market Volume (Litre) Forecast by Distribution Channel, 2018 to 2033
Table 41: South Asia and Pacific Market Value (US$ Million) Forecast by Country, 2018 to 2033
Table 42: South Asia and Pacific Market Volume (Litre) Forecast by Country, 2018 to 2033
Table 43: South Asia and Pacific Market Value (US$ Million) Forecast by Form, 2018 to 2033
Table 44: South Asia and Pacific Market Volume (Litre) Forecast by Form, 2018 to 2033
Table 45: South Asia and Pacific Market Value (US$ Million) Forecast by Application, 2018 to 2033
Table 46: South Asia and Pacific Market Volume (Litre) Forecast by Application, 2018 to 2033
Table 47: South Asia and Pacific Market Value (US$ Million) Forecast by Distribution Channel, 2018 to 2033
Table 48: South Asia and Pacific Market Volume (Litre) Forecast by Distribution Channel, 2018 to 2033
Table 49: East Asia Market Value (US$ Million) Forecast by Country, 2018 to 2033
Table 50: East Asia Market Volume (Litre) Forecast by Country, 2018 to 2033
Table 51: East Asia Market Value (US$ Million) Forecast by Form, 2018 to 2033
Table 52: East Asia Market Volume (Litre) Forecast by Form, 2018 to 2033
Table 53: East Asia Market Value (US$ Million) Forecast by Application, 2018 to 2033
Table 54: East Asia Market Volume (Litre) Forecast by Application, 2018 to 2033
Table 55: East Asia Market Value (US$ Million) Forecast by Distribution Channel, 2018 to 2033
Table 56: East Asia Market Volume (Litre) Forecast by Distribution Channel, 2018 to 2033
Table 57: Middle East and Africa Market Value (US$ Million) Forecast by Country, 2018 to 2033
Table 58: Middle East and Africa Market Volume (Litre) Forecast by Country, 2018 to 2033
Table 59: Middle East and Africa Market Value (US$ Million) Forecast by Form, 2018 to 2033
Table 60: Middle East and Africa Market Volume (Litre) Forecast by Form, 2018 to 2033
Table 61: Middle East and Africa Market Value (US$ Million) Forecast by Application, 2018 to 2033
Table 62: Middle East and Africa Market Volume (Litre) Forecast by Application, 2018 to 2033
Table 63: Middle East and Africa Market Value (US$ Million) Forecast by Distribution Channel, 2018 to 2033
Table 64: Middle East and Africa Market Volume (Litre) Forecast by Distribution Channel, 2018 to 2033
Figure 1: Global Market Value (US$ Million) by Form, 2023 to 2033
Figure 2: Global Market Value (US$ Million) by Application, 2023 to 2033
Figure 3: Global Market Value (US$ Million) by Distribution Channel, 2023 to 2033
Figure 4: Global Market Value (US$ Million) by Region, 2023 to 2033
Figure 5: Global Market Value (US$ Million) Analysis by Region, 2018 to 2033
Figure 6: Global Market Volume (Litre) Analysis by Region, 2018 to 2033
Figure 7: Global Market Value Share (%) and BPS Analysis by Region, 2023 to 2033
Figure 8: Global Market Y-o-Y Growth (%) Projections by Region, 2023 to 2033
Figure 9: Global Market Value (US$ Million) Analysis by Form, 2018 to 2033
Figure 10: Global Market Volume (Litre) Analysis by Form, 2018 to 2033
Figure 11: Global Market Value Share (%) and BPS Analysis by Form, 2023 to 2033
Figure 12: Global Market Y-o-Y Growth (%) Projections by Form, 2023 to 2033
Figure 13: Global Market Value (US$ Million) Analysis by Application, 2018 to 2033
Figure 14: Global Market Volume (Litre) Analysis by Application, 2018 to 2033
Figure 15: Global Market Value Share (%) and BPS Analysis by Application, 2023 to 2033
Figure 16: Global Market Y-o-Y Growth (%) Projections by Application, 2023 to 2033
Figure 17: Global Market Value (US$ Million) Analysis by Distribution Channel, 2018 to 2033
Figure 18: Global Market Volume (Litre) Analysis by Distribution Channel, 2018 to 2033
Figure 19: Global Market Value Share (%) and BPS Analysis by Distribution Channel, 2023 to 2033
Figure 20: Global Market Y-o-Y Growth (%) Projections by Distribution Channel, 2023 to 2033
Figure 21: Global Market Attractiveness by Form, 2023 to 2033
Figure 22: Global Market Attractiveness by Application, 2023 to 2033
Figure 23: Global Market Attractiveness by Distribution Channel, 2023 to 2033
Figure 24: Global Market Attractiveness by Region, 2023 to 2033
Figure 25: North America Market Value (US$ Million) by Form, 2023 to 2033
Figure 26: North America Market Value (US$ Million) by Application, 2023 to 2033
Figure 27: North America Market Value (US$ Million) by Distribution Channel, 2023 to 2033
Figure 28: North America Market Value (US$ Million) by Country, 2023 to 2033
Figure 29: North America Market Value (US$ Million) Analysis by Country, 2018 to 2033
Figure 30: North America Market Volume (Litre) Analysis by Country, 2018 to 2033
Figure 31: North America Market Value Share (%) and BPS Analysis by Country, 2023 to 2033
Figure 32: North America Market Y-o-Y Growth (%) Projections by Country, 2023 to 2033
Figure 33: North America Market Value (US$ Million) Analysis by Form, 2018 to 2033
Figure 34: North America Market Volume (Litre) Analysis by Form, 2018 to 2033
Figure 35: North America Market Value Share (%) and BPS Analysis by Form, 2023 to 2033
Figure 36: North America Market Y-o-Y Growth (%) Projections by Form, 2023 to 2033
Figure 37: North America Market Value (US$ Million) Analysis by Application, 2018 to 2033
Figure 38: North America Market Volume (Litre) Analysis by Application, 2018 to 2033
Figure 39: North America Market Value Share (%) and BPS Analysis by Application, 2023 to 2033
Figure 40: North America Market Y-o-Y Growth (%) Projections by Application, 2023 to 2033
Figure 41: North America Market Value (US$ Million) Analysis by Distribution Channel, 2018 to 2033
Figure 42: North America Market Volume (Litre) Analysis by Distribution Channel, 2018 to 2033
Figure 43: North America Market Value Share (%) and BPS Analysis by Distribution Channel, 2023 to 2033
Figure 44: North America Market Y-o-Y Growth (%) Projections by Distribution Channel, 2023 to 2033
Figure 45: North America Market Attractiveness by Form, 2023 to 2033
Figure 46: North America Market Attractiveness by Application, 2023 to 2033
Figure 47: North America Market Attractiveness by Distribution Channel, 2023 to 2033
Figure 48: North America Market Attractiveness by Country, 2023 to 2033
Figure 49: Latin America Market Value (US$ Million) by Form, 2023 to 2033
Figure 50: Latin America Market Value (US$ Million) by Application, 2023 to 2033
Figure 51: Latin America Market Value (US$ Million) by Distribution Channel, 2023 to 2033
Figure 52: Latin America Market Value (US$ Million) by Country, 2023 to 2033
Figure 53: Latin America Market Value (US$ Million) Analysis by Country, 2018 to 2033
Figure 54: Latin America Market Volume (Litre) Analysis by Country, 2018 to 2033
Figure 55: Latin America Market Value Share (%) and BPS Analysis by Country, 2023 to 2033
Figure 56: Latin America Market Y-o-Y Growth (%) Projections by Country, 2023 to 2033
Figure 57: Latin America Market Value (US$ Million) Analysis by Form, 2018 to 2033
Figure 58: Latin America Market Volume (Litre) Analysis by Form, 2018 to 2033
Figure 59: Latin America Market Value Share (%) and BPS Analysis by Form, 2023 to 2033
Figure 60: Latin America Market Y-o-Y Growth (%) Projections by Form, 2023 to 2033
Figure 61: Latin America Market Value (US$ Million) Analysis by Application, 2018 to 2033
Figure 62: Latin America Market Volume (Litre) Analysis by Application, 2018 to 2033
Figure 63: Latin America Market Value Share (%) and BPS Analysis by Application, 2023 to 2033
Figure 64: Latin America Market Y-o-Y Growth (%) Projections by Application, 2023 to 2033
Figure 65: Latin America Market Value (US$ Million) Analysis by Distribution Channel, 2018 to 2033
Figure 66: Latin America Market Volume (Litre) Analysis by Distribution Channel, 2018 to 2033
Figure 67: Latin America Market Value Share (%) and BPS Analysis by Distribution Channel, 2023 to 2033
Figure 68: Latin America Market Y-o-Y Growth (%) Projections by Distribution Channel, 2023 to 2033
Figure 69: Latin America Market Attractiveness by Form, 2023 to 2033
Figure 70: Latin America Market Attractiveness by Application, 2023 to 2033
Figure 71: Latin America Market Attractiveness by Distribution Channel, 2023 to 2033
Figure 72: Latin America Market Attractiveness by Country, 2023 to 2033
Figure 73: Western Europe Market Value (US$ Million) by Form, 2023 to 2033
Figure 74: Western Europe Market Value (US$ Million) by Application, 2023 to 2033
Figure 75: Western Europe Market Value (US$ Million) by Distribution Channel, 2023 to 2033
Figure 76: Western Europe Market Value (US$ Million) by Country, 2023 to 2033
Figure 77: Western Europe Market Value (US$ Million) Analysis by Country, 2018 to 2033
Figure 78: Western Europe Market Volume (Litre) Analysis by Country, 2018 to 2033
Figure 79: Western Europe Market Value Share (%) and BPS Analysis by Country, 2023 to 2033
Figure 80: Western Europe Market Y-o-Y Growth (%) Projections by Country, 2023 to 2033
Figure 81: Western Europe Market Value (US$ Million) Analysis by Form, 2018 to 2033
Figure 82: Western Europe Market Volume (Litre) Analysis by Form, 2018 to 2033
Figure 83: Western Europe Market Value Share (%) and BPS Analysis by Form, 2023 to 2033
Figure 84: Western Europe Market Y-o-Y Growth (%) Projections by Form, 2023 to 2033
Figure 85: Western Europe Market Value (US$ Million) Analysis by Application, 2018 to 2033
Figure 86: Western Europe Market Volume (Litre) Analysis by Application, 2018 to 2033
Figure 87: Western Europe Market Value Share (%) and BPS Analysis by Application, 2023 to 2033
Figure 88: Western Europe Market Y-o-Y Growth (%) Projections by Application, 2023 to 2033
Figure 89: Western Europe Market Value (US$ Million) Analysis by Distribution Channel, 2018 to 2033
Figure 90: Western Europe Market Volume (Litre) Analysis by Distribution Channel, 2018 to 2033
Figure 91: Western Europe Market Value Share (%) and BPS Analysis by Distribution Channel, 2023 to 2033
Figure 92: Western Europe Market Y-o-Y Growth (%) Projections by Distribution Channel, 2023 to 2033
Figure 93: Western Europe Market Attractiveness by Form, 2023 to 2033
Figure 94: Western Europe Market Attractiveness by Application, 2023 to 2033
Figure 95: Western Europe Market Attractiveness by Distribution Channel, 2023 to 2033
Figure 96: Western Europe Market Attractiveness by Country, 2023 to 2033
Figure 97: Eastern Europe Market Value (US$ Million) by Form, 2023 to 2033
Figure 98: Eastern Europe Market Value (US$ Million) by Application, 2023 to 2033
Figure 99: Eastern Europe Market Value (US$ Million) by Distribution Channel, 2023 to 2033
Figure 100: Eastern Europe Market Value (US$ Million) by Country, 2023 to 2033
Figure 101: Eastern Europe Market Value (US$ Million) Analysis by Country, 2018 to 2033
Figure 102: Eastern Europe Market Volume (Litre) Analysis by Country, 2018 to 2033
Figure 103: Eastern Europe Market Value Share (%) and BPS Analysis by Country, 2023 to 2033
Figure 104: Eastern Europe Market Y-o-Y Growth (%) Projections by Country, 2023 to 2033
Figure 105: Eastern Europe Market Value (US$ Million) Analysis by Form, 2018 to 2033
Figure 106: Eastern Europe Market Volume (Litre) Analysis by Form, 2018 to 2033
Figure 107: Eastern Europe Market Value Share (%) and BPS Analysis by Form, 2023 to 2033
Figure 108: Eastern Europe Market Y-o-Y Growth (%) Projections by Form, 2023 to 2033
Figure 109: Eastern Europe Market Value (US$ Million) Analysis by Application, 2018 to 2033
Figure 110: Eastern Europe Market Volume (Litre) Analysis by Application, 2018 to 2033
Figure 111: Eastern Europe Market Value Share (%) and BPS Analysis by Application, 2023 to 2033
Figure 112: Eastern Europe Market Y-o-Y Growth (%) Projections by Application, 2023 to 2033
Figure 113: Eastern Europe Market Value (US$ Million) Analysis by Distribution Channel, 2018 to 2033
Figure 114: Eastern Europe Market Volume (Litre) Analysis by Distribution Channel, 2018 to 2033
Figure 115: Eastern Europe Market Value Share (%) and BPS Analysis by Distribution Channel, 2023 to 2033
Figure 116: Eastern Europe Market Y-o-Y Growth (%) Projections by Distribution Channel, 2023 to 2033
Figure 117: Eastern Europe Market Attractiveness by Form, 2023 to 2033
Figure 118: Eastern Europe Market Attractiveness by Application, 2023 to 2033
Figure 119: Eastern Europe Market Attractiveness by Distribution Channel, 2023 to 2033
Figure 120: Eastern Europe Market Attractiveness by Country, 2023 to 2033
Figure 121: South Asia and Pacific Market Value (US$ Million) by Form, 2023 to 2033
Figure 122: South Asia and Pacific Market Value (US$ Million) by Application, 2023 to 2033
Figure 123: South Asia and Pacific Market Value (US$ Million) by Distribution Channel, 2023 to 2033
Figure 124: South Asia and Pacific Market Value (US$ Million) by Country, 2023 to 2033
Figure 125: South Asia and Pacific Market Value (US$ Million) Analysis by Country, 2018 to 2033
Figure 126: South Asia and Pacific Market Volume (Litre) Analysis by Country, 2018 to 2033
Figure 127: South Asia and Pacific Market Value Share (%) and BPS Analysis by Country, 2023 to 2033
Figure 128: South Asia and Pacific Market Y-o-Y Growth (%) Projections by Country, 2023 to 2033
Figure 129: South Asia and Pacific Market Value (US$ Million) Analysis by Form, 2018 to 2033
Figure 130: South Asia and Pacific Market Volume (Litre) Analysis by Form, 2018 to 2033
Figure 131: South Asia and Pacific Market Value Share (%) and BPS Analysis by Form, 2023 to 2033
Figure 132: South Asia and Pacific Market Y-o-Y Growth (%) Projections by Form, 2023 to 2033
Figure 133: South Asia and Pacific Market Value (US$ Million) Analysis by Application, 2018 to 2033
Figure 134: South Asia and Pacific Market Volume (Litre) Analysis by Application, 2018 to 2033
Figure 135: South Asia and Pacific Market Value Share (%) and BPS Analysis by Application, 2023 to 2033
Figure 136: South Asia and Pacific Market Y-o-Y Growth (%) Projections by Application, 2023 to 2033
Figure 137: South Asia and Pacific Market Value (US$ Million) Analysis by Distribution Channel, 2018 to 2033
Figure 138: South Asia and Pacific Market Volume (Litre) Analysis by Distribution Channel, 2018 to 2033
Figure 139: South Asia and Pacific Market Value Share (%) and BPS Analysis by Distribution Channel, 2023 to 2033
Figure 140: South Asia and Pacific Market Y-o-Y Growth (%) Projections by Distribution Channel, 2023 to 2033
Figure 141: South Asia and Pacific Market Attractiveness by Form, 2023 to 2033
Figure 142: South Asia and Pacific Market Attractiveness by Application, 2023 to 2033
Figure 143: South Asia and Pacific Market Attractiveness by Distribution Channel, 2023 to 2033
Figure 144: South Asia and Pacific Market Attractiveness by Country, 2023 to 2033
Figure 145: East Asia Market Value (US$ Million) by Form, 2023 to 2033
Figure 146: East Asia Market Value (US$ Million) by Application, 2023 to 2033
Figure 147: East Asia Market Value (US$ Million) by Distribution Channel, 2023 to 2033
Figure 148: East Asia Market Value (US$ Million) by Country, 2023 to 2033
Figure 149: East Asia Market Value (US$ Million) Analysis by Country, 2018 to 2033
Figure 150: East Asia Market Volume (Litre) Analysis by Country, 2018 to 2033
Figure 151: East Asia Market Value Share (%) and BPS Analysis by Country, 2023 to 2033
Figure 152: East Asia Market Y-o-Y Growth (%) Projections by Country, 2023 to 2033
Figure 153: East Asia Market Value (US$ Million) Analysis by Form, 2018 to 2033
Figure 154: East Asia Market Volume (Litre) Analysis by Form, 2018 to 2033
Figure 155: East Asia Market Value Share (%) and BPS Analysis by Form, 2023 to 2033
Figure 156: East Asia Market Y-o-Y Growth (%) Projections by Form, 2023 to 2033
Figure 157: East Asia Market Value (US$ Million) Analysis by Application, 2018 to 2033
Figure 158: East Asia Market Volume (Litre) Analysis by Application, 2018 to 2033
Figure 159: East Asia Market Value Share (%) and BPS Analysis by Application, 2023 to 2033
Figure 160: East Asia Market Y-o-Y Growth (%) Projections by Application, 2023 to 2033
Figure 161: East Asia Market Value (US$ Million) Analysis by Distribution Channel, 2018 to 2033
Figure 162: East Asia Market Volume (Litre) Analysis by Distribution Channel, 2018 to 2033
Figure 163: East Asia Market Value Share (%) and BPS Analysis by Distribution Channel, 2023 to 2033
Figure 164: East Asia Market Y-o-Y Growth (%) Projections by Distribution Channel, 2023 to 2033
Figure 165: East Asia Market Attractiveness by Form, 2023 to 2033
Figure 166: East Asia Market Attractiveness by Application, 2023 to 2033
Figure 167: East Asia Market Attractiveness by Distribution Channel, 2023 to 2033
Figure 168: East Asia Market Attractiveness by Country, 2023 to 2033
Figure 169: Middle East and Africa Market Value (US$ Million) by Form, 2023 to 2033
Figure 170: Middle East and Africa Market Value (US$ Million) by Application, 2023 to 2033
Figure 171: Middle East and Africa Market Value (US$ Million) by Distribution Channel, 2023 to 2033
Figure 172: Middle East and Africa Market Value (US$ Million) by Country, 2023 to 2033
Figure 173: Middle East and Africa Market Value (US$ Million) Analysis by Country, 2018 to 2033
Figure 174: Middle East and Africa Market Volume (Litre) Analysis by Country, 2018 to 2033
Figure 175: Middle East and Africa Market Value Share (%) and BPS Analysis by Country, 2023 to 2033
Figure 176: Middle East and Africa Market Y-o-Y Growth (%) Projections by Country, 2023 to 2033
Figure 177: Middle East and Africa Market Value (US$ Million) Analysis by Form, 2018 to 2033
Figure 178: Middle East and Africa Market Volume (Litre) Analysis by Form, 2018 to 2033
Figure 179: Middle East and Africa Market Value Share (%) and BPS Analysis by Form, 2023 to 2033
Figure 180: Middle East and Africa Market Y-o-Y Growth (%) Projections by Form, 2023 to 2033
Figure 181: Middle East and Africa Market Value (US$ Million) Analysis by Application, 2018 to 2033
Figure 182: Middle East and Africa Market Volume (Litre) Analysis by Application, 2018 to 2033
Figure 183: Middle East and Africa Market Value Share (%) and BPS Analysis by Application, 2023 to 2033
Figure 184: Middle East and Africa Market Y-o-Y Growth (%) Projections by Application, 2023 to 2033
Figure 185: Middle East and Africa Market Value (US$ Million) Analysis by Distribution Channel, 2018 to 2033
Figure 186: Middle East and Africa Market Volume (Litre) Analysis by Distribution Channel, 2018 to 2033
Figure 187: Middle East and Africa Market Value Share (%) and BPS Analysis by Distribution Channel, 2023 to 2033
Figure 188: Middle East and Africa Market Y-o-Y Growth (%) Projections by Distribution Channel, 2023 to 2033
Figure 189: Middle East and Africa Market Attractiveness by Form, 2023 to 2033
Figure 190: Middle East and Africa Market Attractiveness by Application, 2023 to 2033
Figure 191: Middle East and Africa Market Attractiveness by Distribution Channel, 2023 to 2033
Figure 192: Middle East and Africa Market Attractiveness by Country, 2023 to 2033
The market in 2023 is valued at USD 4,719.5 million.
Based on product type, the phage probiotics segment is highly preferred.
The North American market is accountable for 32.5% market share globally.
The industry will reach USD 7,751.1 million by 2033.
Europe accounts for 28.4% market share in the global market.
Explore Similar Insights
Thank you!
You will receive an email from our Business Development Manager. Please be sure to check your SPAM/JUNK folder too.