Hormonal Acne Solutions Market Size and Share Forecast Outlook 2025 to 2035

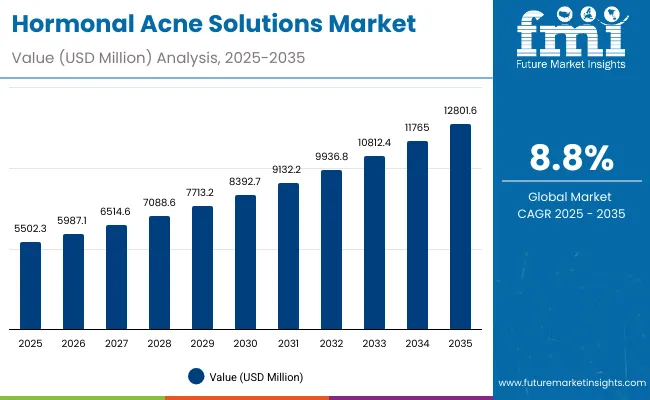
The Hormonal Acne Solutions Market is expected to record a valuation of USD 5,502.3 million in 2025 and USD 12,801.6 million in 2035, with an increase of USD 7,299.3 million, which equals a growth of 133% over the decade. The overall expansion represents a CAGR of 8.8% and more than a 2X increase in market size.
Quick Stats for Hormonal Acne Solutions Market

  • Hormonal Acne Solutions Market Value (2025): USD 5,502.3 million
  • Hormonal Acne Solutions Market Forecast Value (2035): USD 12,801.6 million
  • Hormonal Acne Solutions Market Forecast CAGR: 8.8%
  • Leading Segment in Hormonal Acne Solutions Market in 2025: Topical creams/gels (44%)
  • Key Growth Regions in the Hormonal Acne Solutions Market: North America, East Asia, South Asia & Pacific
  • Top Key Players in Hormonal Acne Solutions Market: Differin, La Roche-Posay, Murad, Paula’s Choice, Neutrogena, AcneFree, Bioderma, AlumierMD, SkinCeuticals, Proactiv

Hormonal Acne Solutions Market

Hormonal Acne Solutions Market Key Takeaways

Metric Value
Hormonal Acne Solutions Market Estimated Value in (2025E) USD 5,502.3 million
Hormonal Acne Solutions Market Forecast Value in (2035F) USD 12,801.6 million
Forecast CAGR (2025 to 2035) 8.8%

During the first five-year period from 2025 to 2030, the market rises from USD 5,502.3 million to USD 8,392.7 million, adding USD 2,890.4 million, which accounts for nearly 40% of the total decade growth. This phase records steady adoption in dermatology clinics, pharmacies, and e-commerce, driven by high demand from adult women who remain the most impacted group for hormonal acne. Topical creams/gels and oral medications dominate during this period as consumers seek clinically validated treatments that provide fast relief, often under dermatological guidance.

The second half from 2030 to 2035 contributes USD 4,408.9 million, equal to nearly 60% of total growth, as the market jumps from USD 8,392.7 million to USD 12,801.6 million. This acceleration is powered by e-commerce penetration, nutricosmetic supplements, and hormonal regulators such as spironolactone and zinc, which gain prominence for long-term management. Digital health platforms recommending dermatologist-approved regimens, coupled with increased consumer awareness around "pregnancy-safe" and "clinically proven" claims, are expected to reshape consumer preferences. Premium clinical procedures adjunct to at-home treatments also see higher uptake in urban centers.

From 2020 to 2024, the Hormonal Acne Solutions Market expanded steadily, driven by clinical reliance on topical retinoids, benzoyl peroxide, and salicylic acid formulations. During this period, topical treatments accounted for nearly half of global sales, while pharmaceutical players dominated distribution through drugstores and dermatology clinics. Leading brands such as Differin and Neutrogena strengthened their positioning with dermatologist-backed campaigns, controlling close to 8-10% of total value. The market was characterized by high trust in clinically proven, dermatologist-recommended claims, while supplements and nutricosmetics remained in the early adoption phase, contributing less than 15% of global value.

Demand for hormonal acne solutions is expected to expand to USD 5,502.3 million in 2025, with the revenue mix evolving significantly over the decade. The growth of supplements, hormone-regulating formulations, and pregnancy-safe solutions is expected to reshape competition. Traditional topical leaders are facing rising pressure from digital-first skincare brands leveraging e-commerce to deliver personalized acne solutions. Major global players are pivoting toward holistic regimens combining topical, oral, and supplement-based approaches. Meanwhile, newer entrants emphasizing clean beauty, fragrance-free claims, and nutricosmetic benefits are gaining traction. Competitive advantage is shifting from single-ingredient strength to integrated routines, trust-based claims, and multi-channel accessibility.

Why the Hormonal Acne Solutions Market is Growing?

Advances in dermatological research have validated the role of hormonal regulators and topical retinoids in reducing inflammatory lesions. The rising incidence of adult female acne, particularly post-teen years, is a strong demand driver, with hormonal imbalance cited by dermatologists as a recurring cause. Over-the-counter accessibility of retinoids and benzoyl peroxide, combined with professional dermatology consultations, has made treatment more mainstream.

The expansion of supplements and nutricosmetics has further fueled adoption, as consumers explore long-term acne management via zinc, DIM, and hormonal balance support formulations. In parallel, consumer expectations for dermatologist-recommended, clinically proven, and pregnancy-safe solutions have shaped innovation pipelines. E-commerce platforms have accelerated access by enabling product comparisons, subscriptions, and targeted regimens, leading to higher conversion. Segment growth is expected to be led by topical treatments in the short term, while nutricosmetics and clinical procedure adjuncts will gain higher traction by 2035. Overall, the market is evolving from a purely symptom-relief approach to a holistic skincare and lifestyle-driven management solution, reflecting a fundamental shift in consumer behavior.

Segmental Analysis

The market is segmented by treatment type, active ingredient, function, channel, claim, end user, and region. Treatment types include topical creams/gels, oral medications, supplements or nutricosmetics, and clinical procedures adjunct, representing the primary therapeutic avenues in acne management. Active ingredients span benzoyl peroxide, retinoids, salicylic acid, and hormonal regulators such as spironolactone, DIM, and zinc, each catering to different acne-causing mechanisms. Functions covered in this market include oil control, pore unclogging, anti-inflammatory action, and hormonal balance support, highlighting the multifaceted approaches consumers seek.

Distribution channels range across dermatology clinics, pharmacies and drugstores, e-commerce platforms, and mass retail outlets, reflecting both professional and over-the-counter accessibility. Product claims such as fragrance-free, clinically proven, pregnancy-safe, and dermatologist-recommended serve as key differentiators shaping consumer trust. The end user base is segmented into adolescent females, adult women, and men, acknowledging varied hormonal triggers across demographics. Regionally, the scope spans North America, Europe, East Asia, South Asia and Pacific, Latin America, and the Middle East and Africa, encompassing both mature skincare markets and emerging regions with rising dermatological awareness.
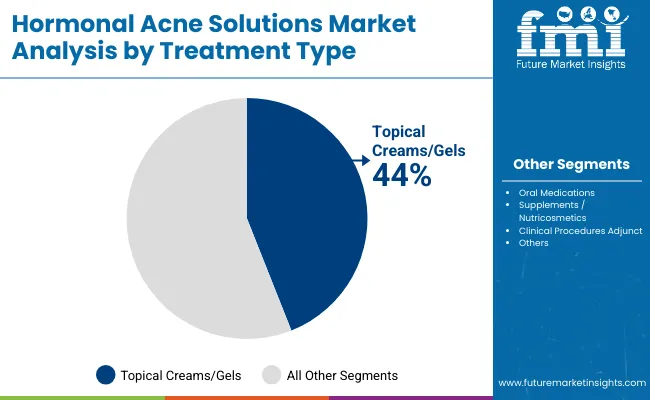
Insights into the Treatment Type Segment with Topical Creams/Gels Leading in Market Share

Hormonal Acne Solutions Market By Treatment

Treatment Type Value Share% 2025
Topical creams/gels 44%
Others 56.0%

The topical creams and gels segment is projected to contribute 44% of the Hormonal Acne Solutions Market revenue in 2025, maintaining its position as the most widely used treatment approach. This dominance is driven by the accessibility of over-the-counter products containing retinoids, benzoyl peroxide, and salicylic acid, which continue to be first-line options for consumers and dermatologists alike. The segment benefits from established consumer trust, dermatologist recommendations, and affordability compared to more complex treatments such as hormonal regulators or clinical procedures.

Growth in this segment is further supported by innovations in formulation, including fragrance-free, pregnancy-safe, and dermatologist-tested claims, which resonate with diverse consumer groups. As e-commerce platforms expand availability, consumers are increasingly turning to topical solutions for self-managed regimens. While supplements and hormonal regulators gain traction for long-term management, topical treatments remain the backbone of acne solutions, providing immediate relief and maintaining the largest share through 2035.
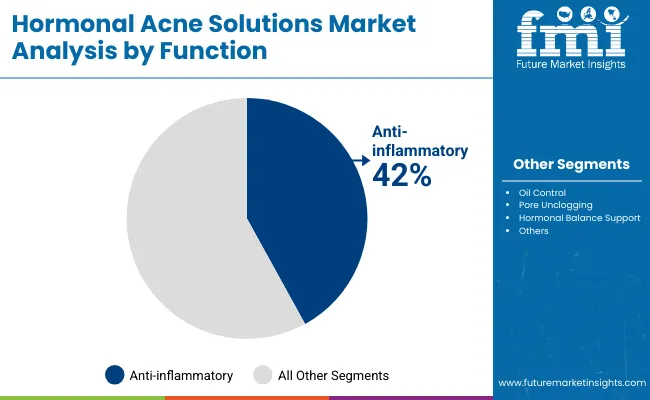
Insights into the Function Segment with Anti-inflammatory Solutions Dominating the Demand

Hormonal Acne Solutions Market By Function

Function Value Share% 2025
Anti-inflammatory 42%
Others 58.0%

The anti-inflammatory function segment is forecasted to hold 42% of the Hormonal Acne Solutions Market share in 2025, reflecting strong consumer demand for treatments that address the visible redness, swelling, and irritation associated with hormonal acne. Products featuring retinoids, benzoyl peroxide, and zinc are particularly valued for their dual role in reducing bacterial activity and calming skin inflammation.

The segment’s appeal is further amplified by the rise of dermatologist-recommended and clinically proven labels, which assure consumers of both safety and efficacy. In markets such as the USA and China, anti-inflammatory formulations dominate due to widespread prescription practices and strong OTC availability. With ongoing R&D into gentler yet effective ingredients, this category aligns with the consumer trend toward skin barrier-friendly acne care. Given its effectiveness in providing both short-term relief and long-term improvement, the anti-inflammatory segment is expected to continue shaping product development and consumer preference globally.
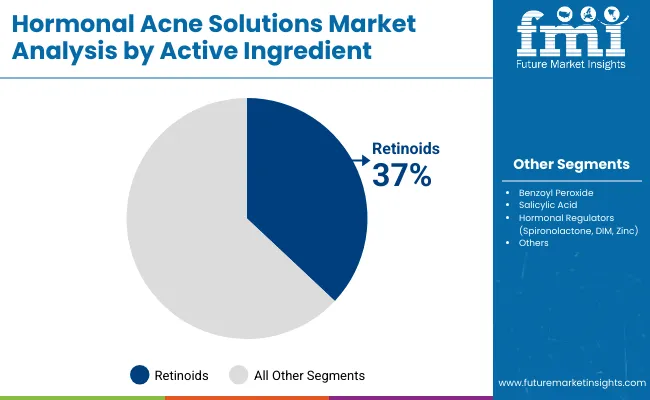
Insights into the Active Ingredient Segment with Retinoids Leading in Market Share

Hormonal Acne Solutions Market By Active Ingrediant

Active Ingredient Value Share% 2025
Retinoids 37%
Others 63.0%

The retinoids segment is projected to account for 37% of the Hormonal Acne Solutions Market revenue in 2025, making it the leading active ingredient group. Retinoids are widely recognized for their ability to regulate cell turnover, unclog pores, and reduce acne-related inflammation, making them highly effective for persistent hormonal acne cases. Their use spans both prescription-strength formulations and widely available OTC products, increasing their penetration across demographics.

Advancements in formulation, such as micro-encapsulation and lower-irritancy blends, have made retinoids more tolerable for sensitive skin, boosting adoption among adolescent and adult users alike. In premium segments, dermatologist-endorsed brands like Differin and SkinCeuticals emphasize retinoid-based therapies, consolidating their market positioning. Despite the rise of alternative actives such as hormonal regulators and nutricosmetics, retinoids remain the cornerstone of evidence-based acne management, sustaining their leadership as the gold-standard active through the forecast period.

What are the Drivers, Restraints, and Key Trends of the Hormonal Acne Solutions Market?

Drivers

Rising Prevalence of Adult Female Hormonal Acne

A growing body of dermatological research highlights that adult women are increasingly affected by hormonal acne, with prevalence rates rising due to stress, dietary shifts, and endocrine imbalances. According to the American Academy of Dermatology (AAD, 2023), nearly 50% of women aged 20-29 and one-third of women in their 30s experience acne, often linked to hormonal fluctuations.

This demographic represents the largest end-user group in the market, fueling demand for both topical treatments and hormonal regulators. As women seek long-term and pregnancy-safe solutions, brands that integrate dermatologist-recommended, clinically proven claims gain significant traction. This driver directly strengthens the growth of retinoids and anti-inflammatory formulations, while also accelerating the supplement and nutricosmetic segment, particularly in the USA, China, and India.

Expanding E-commerce and Digital Dermatology Platforms

The rapid expansion of e-commerce platforms and tele-dermatology services has transformed access to acne solutions. In 2025, online sales already represent a fast-growing channel, with direct-to-consumer (D2C) brands and established players leveraging subscription models, AI-powered skin assessments, and social media dermatology campaigns. This ecosystem allows consumers to compare claims such as "fragrance-free" or "pregnancy-safe" instantly and receive personalized regimens. In China and India, e-commerce is enabling younger consumers to bypass traditional pharmacies, while in North America, online platforms provide convenience and discretion for adult women and men alike. As clinical and OTC acne solutions converge online, digital accessibility stands out as a critical driver of long-term market growth.

Restraints

Side Effects and Safety Concerns Around Hormonal Regulators

While hormonal regulators such as spironolactone and DIM are gaining traction, safety concerns present a significant barrier. Side effects ranging from dizziness to potential contraindications during pregnancy limit the adoption rate in sensitive demographics. Regulatory agencies in Europe and North America continue to impose strict prescription controls, slowing down mainstream adoption. This restraint also extends to consumer hesitancy, as growing awareness around skin barrier sensitivity and systemic effects pushes some users away from long-term oral solutions. Brands must therefore invest in pregnancy-safe formulations and alternative nutricosmetics to offset these concerns, or risk losing share in the adult women category where the unmet need remains highest.

High Competition and Market Fragmentation

The market is highly fragmented with global, regional, and indie brands, making consumer choice complex. Major players such as Differin, La Roche-Posay, and Neutrogena compete alongside smaller niche brands promoting natural or clean-label acne care. This intensifies price pressure in topical creams/gels the largest segment with 44% share in 2025. Fragmentation also dilutes brand loyalty, as consumers frequently switch products due to marketing claims like "dermatologist-recommended" or "clinically proven." In developing regions, local players often undercut international brands with affordable products, further limiting premium brand penetration. This restraint is expected to persist, making competitive positioning and claim differentiation increasingly vital.

Key Trends

Nutricosmetics and Supplements as Adjunct Therapies

A major trend is the rise of supplements and nutricosmetics (zinc, DIM, probiotics, and plant-based extracts) being positioned as adjunct therapies to traditional topical and oral acne treatments. In markets like Japan and India, consumers are increasingly blending oral beauty nutrition with skincare to address hormonal imbalance internally. Global brands are investing in this cross-segment expansion, introducing capsules, powders, and gummies that align with the wellness and lifestyle movement. This trend expands the hormonal acne market beyond pharmaceuticals and cosmetics, creating an integrated skincare-wellness ecosystem that is expected to accelerate post-2030.

Growing Demand for Pregnancy-Safe and Clean-Label Claims

Consumer focus on pregnancy-safe, fragrance-free, and dermatologist-proven claims is shaping product innovation. Retinoids, despite their efficacy, face growing scrutiny in pregnancy contexts, prompting brands to invest in alternative actives and gentler anti-inflammatory solutions. Clean-label trends, particularly in Europe and North America, are driving growth in formulations that minimize harsh preservatives and emphasize skin barrier protection. This demand is shifting R&D pipelines from "stronger" actives toward holistic, tolerable, and safe regimens, reinforcing the premiumization of the market and opening opportunities for new entrants that can bridge clinical efficacy with safety assurances.
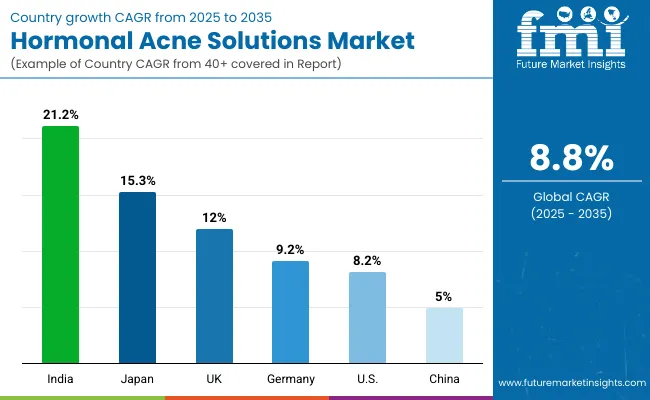
Analysis of Hormonal Acne Solutions Market By Key Countries

Hormonal Acne Solutions Market By Country

Countries Estimated CAGR (2025 to 2035)
China 5.0%
USA 8.2%
India 21.2%
UK 12.0%
Germany 9.2%

The decade outlook shows wide variations in country-level growth, with India leading at 21.2% CAGR, followed by Japan at 15.3% and the UK at 12%, highlighting how demand dynamics differ between emerging and mature skincare markets. India’s rapid growth is fueled by a young demographic base, rising middle-class incomes, and accelerated adoption of both nutricosmetics and e-commerce-driven skincare purchases. Similarly, Japan’s double-digit CAGR is underpinned by high consumer acceptance of nutritional supplements for skin health, integration of clean-label claims, and increased awareness of adult female acne. The UK, while a mature European market, benefits from premiumization trends, strong dermatology networks, and rising awareness of safe formulations during pregnancy, ensuring robust growth momentum compared to other Western countries.

In contrast, the USA (8.2% CAGR) and Germany (9.2% CAGR) reflect steady but more moderate growth, owing to already high market penetration of topical and OTC solutions, coupled with brand maturity. The USA remains the largest single-country market with continued consumer reliance on dermatologist-recommended retinoids and expanding e-commerce. Germany’s growth is shaped by a shift toward dermatologist-supervised treatments and clean-label innovations, although rising local competition slows expansion. China (5.0% CAGR) shows the slowest growth rate among key markets, as the country already exhibits widespread OTC acne product adoption, making incremental growth dependent on innovation in hormonal regulators and supplements rather than conventional topicals.
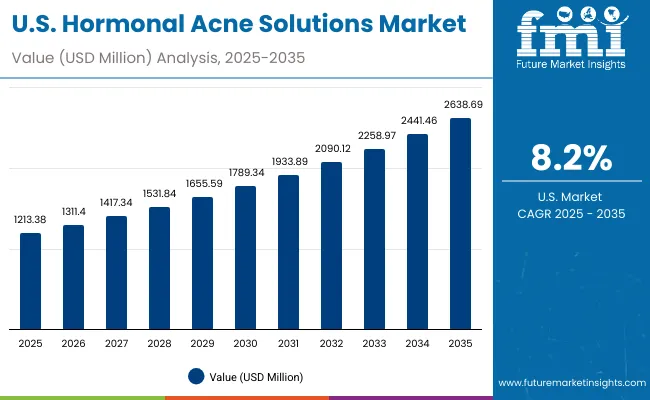
Sales Outlook for Hormonal Acne Solutions in the United States

Hormonal Acne Solutions Market Usa

Year USA Hormonal Acne Solutions Market (USD Million)
2025 1,213.38
2026 1,311.40
2027 1,417.34
2028 1,531.84
2029 1,655.59
2030 1,789.34
2031 1,933.89
2032 2,090.12
2033 2,258.97
2034 2,441.46
2035 2,638.69

The USA Hormonal Acne Solutions Market is projected to grow at a CAGR of 8.2%, driven by strong demand from adult women and rising interest in clinically validated regimens. Topical creams/gels remain the leading treatment, contributing 44% of national sales in 2025, with sustained growth in dermatologist-recommended retinoid and benzoyl peroxide formulations. Supplements and nutricosmetics are steadily expanding, supported by consumer interest in pregnancy-safe and hormone-balancing alternatives. Digital dermatology platforms and e-commerce-driven skincare subscriptions are further propelling adoption, particularly among millennial and Gen Z users seeking personalized solutions. The USA market continues to be shaped by trust in dermatologist guidance, OTC accessibility, and integrated treatment regimens.

  • Topical creams and gels are the dominant treatment, holding 44% share in 2025.
  • E-commerce subscriptions are boosting adoption of supplements and adjunct therapies.
  • Dermatologist-recommended and pregnancy-safe claims are key purchase influencers.

Growth and Expansion Outlook for Hormonal Acne Solutions in the United Kingdom

The UK Hormonal Acne Solutions Market is expected to grow at a CAGR of 12%, supported by strong adoption of premium and clinically proven products. Consumers are increasingly favoring dermatologist-endorsed brands with fragrance-free and pregnancy-safe claims. Rising stress-related acne among young professionals and demand for hormonal balance supplements are expanding the addressable market. Retailers and pharmacies in the UK actively stock international brands such as La Roche-Posay and Paula’s Choice, while local clinics emphasize combination regimens of topical and oral treatments. Government health awareness campaigns and robust dermatology networks enhance consumer education, driving demand for safe, science-backed acne solutions.

  • Premium dermatologist-endorsed brands are leading adoption in retail and pharmacy channels.
  • Hormonal supplements and clean-label nutricosmetics are gaining share among adult women.
  • Pregnancy-safe claims and barrier-friendly formulations are shaping UK product innovation.

Growth and Expansion Outlook for Hormonal Acne Solutions in India

India is witnessing rapid expansion in the Hormonal Acne Solutions Market, forecast to grow at a CAGR of 21.2%, the highest globally. Rising disposable incomes, urbanization, and social media-driven awareness are driving strong uptake across tier-1 and tier-2 cities. Younger demographics and a growing female consumer base are increasingly turning to supplements, hormonal regulators, and e-commerce-driven skincare brands. Localized pricing and availability of clinically proven yet affordable topical treatments are critical for mass-market adoption. Simultaneously, dermatology clinics in urban centers are seeing increased demand for adjunct clinical procedures such as chemical peels, often paired with OTC products. India’s market is transforming into a high-growth hub, driven by both affordability and premiumization trends.
  • Tier-2 city adoption is accelerating due to affordable OTC acne solutions.
  • Nutricosmetics and hormonal balance supplements are a fast-growing category.
  • Urban clinics are combining topical regimens with clinical procedures for premium users.

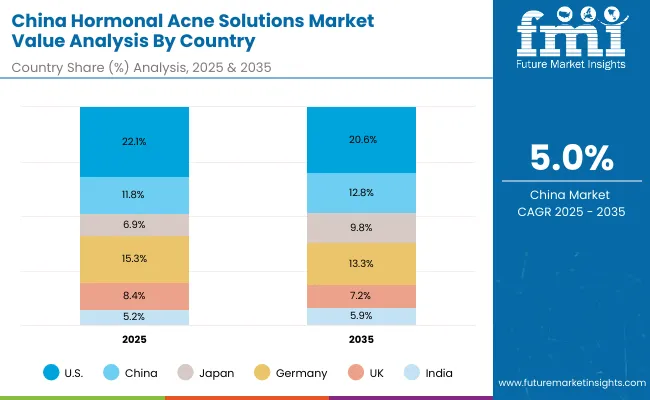
Sales Outlook for Hormonal Acne Solutions in China

Hormonal Acne Solutions Market China

Countries 2025 Share (%)
USA 22.1%
China 11.8%
Japan 6.9%
Germany 15.3%
UK 8.4%
India 5.2%
Countries 2035 Share (%)
USA 20.6%
China 12.8%
Japan 9.8%
Germany 13.3%
UK 7.2%
India 5.9%

The China Hormonal Acne Solutions Market is projected to expand at a CAGR of 5.0%, the slowest among leading economies, due to already high penetration of OTC topical treatments. However, premium growth segments lie in anti-inflammatory solutions, which hold 42% of the market in 2025, and in emerging nutricosmetic supplements. Chinese consumers increasingly prefer dermatologist-recommended, fragrance-free, and clinically proven formulations, and younger women are turning to e-commerce platforms such as Tmall and JD.com for personalized acne care regimens. Growth is being driven more by premiumization and product innovation rather than volume expansion, with global brands competing against strong local players emphasizing affordability and herbal actives.
  • Anti-inflammatory formulations account for 42% of China’s market in 2025.
  • Premium consumers favor pregnancy-safe and fragrance-free claims in urban centers.
  • E-commerce remains the largest channel, enabling cross-border skincare purchases.

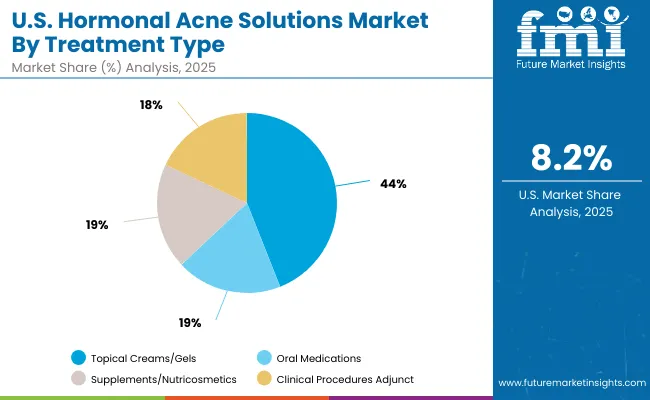
Growth Outlook for Hormonal Acne Solutions Market in the United States

Hormonal Acne Solutions Market Usa 2

USA by Treatment Type Value Share% 2025
Topical creams/gels 44%
Others 56.0%

The USA Hormonal Acne Solutions Market is projected at USD 1,213.38 million in 2025, with topical creams/gels contributing 44% of total value, reaffirming their dominance as first-line solutions. This strength stems from strong reliance on retinoids, benzoyl peroxide, and salicylic acid formulations, all widely available through both pharmacies and e-commerce. The market also shows clear movement toward pregnancy-safe and clinically proven claims, reflecting consumer caution in dermatology products.

The growing digital dermatology ecosystem, including subscription services and telehealth acne consultations, further boosts adoption of integrated regimens that combine topical treatments with supplements. USA consumers demonstrate high trust in dermatologist-recommended solutions, with Differin, La Roche-Posay, and Neutrogena leading positioning. Over the next decade, supplement and nutricosmetic adoption is expected to grow steadily, but topical treatments remain the backbone of acne care.
  • The USA market contributes 22.1% of global share in 2025.
  • Topical creams dominate with 44% share in 2025.
  • Growth supported by dermatologist endorsements and e-commerce subscriptions.

Opportunity Analysis of Hormonal Acne Solutions Market in China

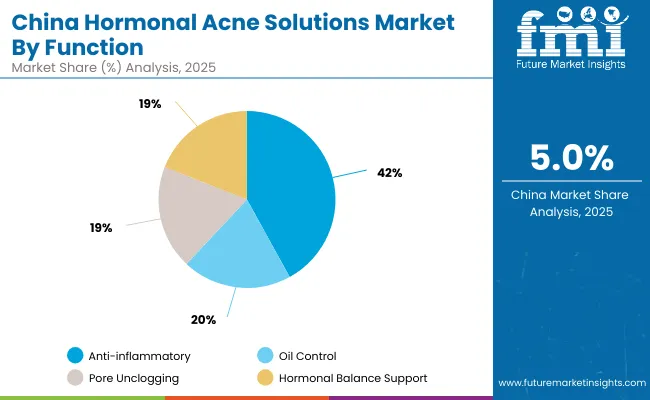
Hormonal Acne Solutions Market China 2

China by Function Value Share% 2025
Anti-inflammatory 42%
Others 58.0%

The China Hormonal Acne Solutions Market is projected at USD 647.26 million in 2025, with anti-inflammatory solutions leading at 42% of total sales. This dominance reflects Chinese consumers’ preference for redness-reducing and irritation-calming formulations, often promoted as fragrance-free and dermatologist-proven. Local innovation also plays a role, with Chinese brands emphasizing herbal actives and gentle formulations to meet growing demand for skin-barrier-friendly acne care.

E-commerce platforms such as Tmall and JD.com act as major distribution channels, enabling both global and domestic players to compete for digitally savvy consumers. While OTC topicals remain highly penetrated, future growth is tied to nutricosmetics and hormonal balance supplements, which align with China’s wellness-oriented skincare culture. The opportunity lies in expanding from simple acne relief into holistic acne management, integrating anti-inflammatory, oil-control, and hormonal balance functions within single regimens.
  • China’s market share rises from 11.8% in 2025 to 12.8% in 2035.
  • Anti-inflammatory leads at 42% due to preference for redness-control solutions.
  • Growth is concentrated in e-commerce and nutricosmetic-driven adoption.

Competitive Landscape of the Hormonal Acne Solutions Market

Hormonal Acne Solutions Market By Company

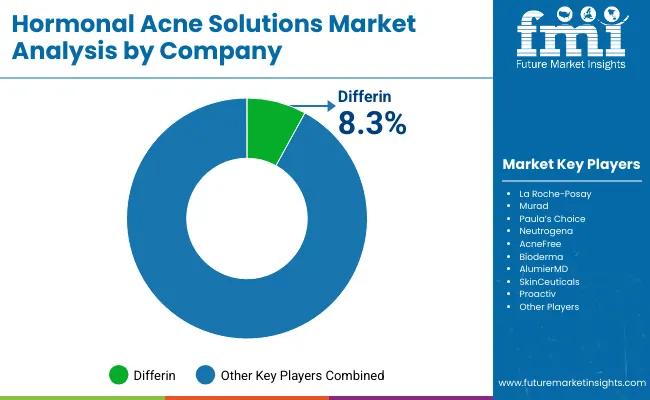
The Hormonal Acne Solutions Market is moderately fragmented, with leading multinational skincare brands, premium dermatology-focused companies, and emerging supplement providers competing across multiple consumer categories. Differin leads with an 8.3% share in 2025, benefiting from strong dermatologist endorsements and broad OTC presence in North America and Europe. La Roche-Posay, Neutrogena, Murad, and Paula’s Choice also capture significant shares through premium positioning, e-commerce-driven strategies, and emphasis on clinically proven claims.

Mid-tier players such as Bioderma, AlumierMD, and SkinCeuticals appeal to niche dermatology clinic and premium skincare channels, building trust with targeted audiences through professional recommendations and clean-label claims. Meanwhile, consumer-focused brands like AcneFree and Proactiv continue to thrive in mass retail and subscription models, particularly among adolescents. Competitive differentiation is shifting away from single active ingredients toward integrated acne regimens that combine topical solutions, hormonal regulators, and supplements. Demand for pregnancy-safe, fragrance-free, and dermatologist-recommended claims is setting the standard for product innovation. Players that build multi-channel ecosystems spanning pharmacies, e-commerce, and dermatology clinics will be better positioned to capture the decade’s growth momentum.

Key Developments in Hormonal Acne Solutions Market

  • On March 11, 2025, La Roche-Posay issued a recall of its Effaclar Duo Acne Spot Treatment in the USA over concerns that the benzoyl peroxide ingredient might degrade under certain conditions (e.g., high temperature or UV exposure) to trace amounts of benzene, a known carcinogen. While the levels were deemed low, the move reflects growing regulatory and consumer sensitivity to safety and formulation stability.
  • Around mid-2024, La Roche-Posay unveiled Mela B3, an over-the-counter serum built for treating persistent post-acne discoloration. It combines 10% niacinamide, their proprietary molecule Melasyl, and thermal spring water. The product is positioned not just for lightening dark spots but for addressing "post-inflammatory hyperpigmentation," especially in skin of all types, backed by clinical trials presented at the IMCAS congress.

Scope of the Report

Item Value
Quantitative Units USD 5,502.3 million
Treatment Type Topical creams/gels, Oral medications, Supplements/nutricosmetics, and Clinical procedures adjunct
Active Ingredient Benzoyl peroxide, Retinoids, Salicylic acid, and Hormonal regulators (spironolactone, DIM, zinc)
Function Oil control, Pore unclogging, Anti-inflammatory, and Hormonal balance support
Channel Dermatology clinics, Pharmacies/drugstores, E-commerce, and Mass retail
Claim Fragrance-free, Clinically proven, Pregnancy-safe, Dermatologist-recommended
End User Adolescent females, Adult women, and Men
Regions Covered North America, Europe, East Asia, South Asia & Pacific, Latin America, Middle East & Africa
Country Covered United States, Canada, Germany, France, United Kingdom, China, Japan, India, Brazil, South Africa
Key Companies Profiled Differin, La Roche-Posay, Murad, Paula’s Choice, Neutrogena, AcneFree, Bioderma, AlumierMD, SkinCeuticals, Proactiv
Additional Attributes Dollar sales by treatment type, function, and ingredient category; adoption trends in e-commerce and tele-dermatology platforms; rising demand for pregnancy-safe and fragrance-free claims; segment-specific growth in supplements and nutricosmetics; revenue segmentation by topical vs. oral vs. clinical procedures; innovation in hormonal regulators and barrier-friendly actives; regional trends shaped by dermatology networks and digital-first brands; and R&D in low-irritancy retinoids and hormonal balance support formulations.

Key Segments

By Treatment Type:

  • Topical creams/gels
  • Oral medications
  • Supplements/nutricosmetics
  • Clinical procedures adjunct

By Function:

  • Oil control
  • Pore unclogging
  • Anti-inflammatory
  • Hormonal balance support

By Channel:

  • E-commerce
  • Pharmacies/drugstores
  • Mass retail
  • Dermatology clinics

By Claim:

  • Dermatologist-recommended
  • Pregnancy-safe
  • Fragrance-free
  • Clinically proven

By Active Ingredient:

  • Benzoyl peroxide
  • Retinoids
  • Salicylic acid
  • Hormonal regulators (spironolactone, DIM, zinc)

By End User:

  • Adolescent females
  • Adult women
  • Men

By Region:

  • North America
  • Latin America
  • Europe
  • East Asia
  • South Asia & Pacific
  • Middle East and Africa

Table of Content

  1. Executive Summary
    • Global Market Outlook
    • Demand-side Trends
    • Supply-side Trends
    • Technology Roadmap Analysis
    • Analysis and Recommendations
  2. Market Overview
    • Market Coverage / Taxonomy
    • Market Definition / Scope / Limitations
  3. Market Background
    • Market Dynamics
      • Drivers
      • Restraints
      • Opportunity
      • Trends
    • Scenario Forecast
      • Demand in Optimistic Scenario
      • Demand in Likely Scenario
      • Demand in Conservative Scenario
    • Opportunity Map Analysis
    • Product Life Cycle Analysis
    • Supply Chain Analysis
      • Supply Side Participants and their Roles
        • Producers
        • Mid-Level Participants (Traders/ Agents/ Brokers)
        • Wholesalers and Distributors
      • Value Added and Value Created at Node in the Supply Chain
      • List of Raw Material Suppliers
      • List of Existing and Potential Buyer’s
    • Investment Feasibility Matrix
    • Value Chain Analysis
      • Profit Margin Analysis
      • Wholesalers and Distributors
      • Retailers
    • PESTLE and Porter’s Analysis
    • Regulatory Landscape
      • By Key Regions
      • By Key Countries
    • Regional Parent Market Outlook
    • Production and Consumption Statistics
    • Import and Export Statistics
  4. Global Market Analysis 2020 to 2024 and Forecast, 2025 to 2035
    • Historical Market Size Value (USD Million) & Volume (Units) Analysis, 2020 to 2024
    • Current and Future Market Size Value (USD Million) & Volume (Units) Projections, 2025 to 2035
      • Y-o-Y Growth Trend Analysis
      • Absolute $ Opportunity Analysis
  5. Global Market Analysis 2020 to 2024 and Forecast 2025 to 2035, By Treatment Type
    • Introduction / Key Findings
    • Historical Market Size Value (USD Million) & Volume (Units) Analysis By Treatment Type, 2020 to 2024
    • Current and Future Market Size Value (USD Million) & Volume (Units) Analysis and Forecast By Treatment Type, 2025 to 2035
      • Topical creams/gels
      • Oral medications
      • Supplements/nutricosmetics
      • Clinical procedures adjunct
    • Y-o-Y Growth Trend Analysis By Treatment Type, 2020 to 2024
    • Absolute $ Opportunity Analysis By Treatment Type, 2025 to 2035
  6. Global Market Analysis 2020 to 2024 and Forecast 2025 to 2035, By Function
    • Introduction / Key Findings
    • Historical Market Size Value (USD Million) & Volume (Units) Analysis By Function, 2020 to 2024
    • Current and Future Market Size Value (USD Million) & Volume (Units) Analysis and Forecast By Function, 2025 to 2035
      • Oil control
      • Pore unclogging
      • Anti-inflammatory
      • Hormonal balance support
    • Y-o-Y Growth Trend Analysis By Function, 2020 to 2024
    • Absolute $ Opportunity Analysis By Function, 2025 to 2035
  7. Global Market Analysis 2020 to 2024 and Forecast 2025 to 2035, By Channel
    • Introduction / Key Findings
    • Historical Market Size Value (USD Million) & Volume (Units) Analysis By Channel, 2020 to 2024
    • Current and Future Market Size Value (USD Million) & Volume (Units) Analysis and Forecast By Channel, 2025 to 2035
      • E-commerce
      • Pharmacies/drugstores
      • Mass retail
      • Dermatology clinics
    • Y-o-Y Growth Trend Analysis By Channel, 2020 to 2024
    • Absolute $ Opportunity Analysis By Channel, 2025 to 2035
  8. Global Market Analysis 2020 to 2024 and Forecast 2025 to 2035, By Claim
    • Introduction / Key Findings
    • Historical Market Size Value (USD Million) & Volume (Units) Analysis By Claim, 2020 to 2024
    • Current and Future Market Size Value (USD Million) & Volume (Units) Analysis and Forecast By Claim, 2025 to 2035
      • Dermatologist-recommended
      • Pregnancy-safe
      • Fragrance-free
      • Clinically proven
    • Y-o-Y Growth Trend Analysis By Claim, 2020 to 2024
    • Absolute $ Opportunity Analysis By Claim, 2025 to 2035
  9. Global Market Analysis 2020 to 2024 and Forecast 2025 to 2035, By Active Ingredient
    • Introduction / Key Findings
    • Historical Market Size Value (USD Million) & Volume (Units) Analysis By Active Ingredient, 2020 to 2024
    • Current and Future Market Size Value (USD Million) & Volume (Units) Analysis and Forecast By Active Ingredient, 2025 to 2035
      • Benzoyl peroxide
      • Retinoids
      • Salicylic acid
      • Hormonal regulators (spironolactone, DIM, zinc)
    • Y-o-Y Growth Trend Analysis By Active Ingredient, 2020 to 2024
    • Absolute $ Opportunity Analysis By Active Ingredient, 2025 to 2035
  10. Global Market Analysis 2020 to 2024 and Forecast 2025 to 2035, By End User
    • Introduction / Key Findings
    • Historical Market Size Value (USD Million) & Volume (Units) Analysis By End User, 2020 to 2024
    • Current and Future Market Size Value (USD Million) & Volume (Units) Analysis and Forecast By End User, 2025 to 2035
      • Adolescent females
      • Adult women
      • Men
    • Y-o-Y Growth Trend Analysis By End User, 2020 to 2024
    • Absolute $ Opportunity Analysis By End User, 2025 to 2035
  11. Global Market Analysis 2020 to 2024 and Forecast 2025 to 2035, By Region
    • Introduction
    • Historical Market Size Value (USD Million) & Volume (Units) Analysis By Region, 2020 to 2024
    • Current Market Size Value (USD Million) & Volume (Units) Analysis and Forecast By Region, 2025 to 2035
      • North America
      • Latin America
      • Europe
      • East Asia
      • South Asia & Pacific
      • Middle East and Africa
    • Market Attractiveness Analysis By Region
  12. North America Market Analysis 2020 to 2024 and Forecast 2025 to 2035, By Country
    • Historical Market Size Value (USD Million) & Volume (Units) Trend Analysis By Market Taxonomy, 2020 to 2024
    • Market Size Value (USD Million) & Volume (Units) Forecast By Market Taxonomy, 2025 to 2035
      • By Country
        • USA
        • Canada
      • By Treatment Type
      • By Function
      • By Channel
      • By Claim
      • By Active Ingredient
      • By End User
    • Market Attractiveness Analysis
      • By Country
      • By Treatment Type
      • By Function
      • By Channel
      • By Claim
      • By Active Ingredient
      • By End User
    • Key Takeaways
  13. Latin America Market Analysis 2020 to 2024 and Forecast 2025 to 2035, By Country
    • Historical Market Size Value (USD Million) & Volume (Units) Trend Analysis By Market Taxonomy, 2020 to 2024
    • Market Size Value (USD Million) & Volume (Units) Forecast By Market Taxonomy, 2025 to 2035
      • By Country
        • Brazil
        • Mexico
        • Colombia
        • Rest of Latin America
      • By Treatment Type
      • By Function
      • By Channel
      • By Claim
      • By Active Ingredient
      • By End User
    • Market Attractiveness Analysis
      • By Country
      • By Treatment Type
      • By Function
      • By Channel
      • By Claim
      • By Active Ingredient
      • By End User
    • Key Takeaways
  14. Europe Market Analysis 2020 to 2024 and Forecast 2025 to 2035, By Country
    • Historical Market Size Value (USD Million) & Volume (Units) Trend Analysis By Market Taxonomy, 2020 to 2024
    • Market Size Value (USD Million) & Volume (Units) Forecast By Market Taxonomy, 2025 to 2035
      • By Country
        • Germany
        • UK
        • France
        • Italy
        • Spain
        • Belgium
        • Netherlands
        • Nordic
        • Switzerland
        • Russia
        • Poland
        • Rest of Europe
      • By Treatment Type
      • By Function
      • By Channel
      • By Claim
      • By Active Ingredient
      • By End User
    • Market Attractiveness Analysis
      • By Country
      • By Treatment Type
      • By Function
      • By Channel
      • By Claim
      • By Active Ingredient
      • By End User
    • Key Takeaways
  15. East Asia Market Analysis 2020 to 2024 and Forecast 2025 to 2035, By Country
    • Historical Market Size Value (USD Million) & Volume (Units) Trend Analysis By Market Taxonomy, 2020 to 2024
    • Market Size Value (USD Million) & Volume (Units) Forecast By Market Taxonomy, 2025 to 2035
      • By Country
        • China
        • Japan
        • South Korea
      • By Treatment Type
      • By Function
      • By Channel
      • By Claim
      • By Active Ingredient
      • By End User
    • Market Attractiveness Analysis
      • By Country
      • By Treatment Type
      • By Function
      • By Channel
      • By Claim
      • By Active Ingredient
      • By End User
    • Key Takeaways
  16. South Asia & Pacific Market Analysis 2020 to 2024 and Forecast 2025 to 2035, By Country
    • Historical Market Size Value (USD Million) & Volume (Units) Trend Analysis By Market Taxonomy, 2020 to 2024
    • Market Size Value (USD Million) & Volume (Units) Forecast By Market Taxonomy, 2025 to 2035
      • By Country
        • India
        • Thailand
        • Malaysia
        • Indonesia
        • Singapore
        • Vietnam
        • Australia
        • New Zealand
        • Rest of South Asia
      • By Treatment Type
      • By Function
      • By Channel
      • By Claim
      • By Active Ingredient
      • By End User
    • Market Attractiveness Analysis
      • By Country
      • By Treatment Type
      • By Function
      • By Channel
      • By Claim
      • By Active Ingredient
      • By End User
    • Key Takeaways
  17. Middle East and Africa Market Analysis 2020 to 2024 and Forecast 2025 to 2035, By Country
    • Historical Market Size Value (USD Million) & Volume (Units) Trend Analysis By Market Taxonomy, 2020 to 2024
    • Market Size Value (USD Million) & Volume (Units) Forecast By Market Taxonomy, 2025 to 2035
      • By Country
        • Turkey
        • UAE
        • Saudi Arabia
        • Israel
        • Other GCC Countries
        • North Africa
        • South Africa
      • By Treatment Type
      • By Function
      • By Channel
      • By Claim
      • By Active Ingredient
      • By End User
    • Market Attractiveness Analysis
      • By Country
      • By Treatment Type
      • By Function
      • By Channel
      • By Claim
      • By Active Ingredient
      • By End User
    • Key Takeaways
  18. Key Countries Market Analysis
    • USA
      • Pricing Analysis
      • Market Share Analysis, 2024
        • By Treatment Type
        • By Function
        • By Channel
        • By Claim
        • By Active Ingredient
        • By End User
    • Canada
      • Pricing Analysis
      • Market Share Analysis, 2024
        • By Treatment Type
        • By Function
        • By Channel
        • By Claim
        • By Active Ingredient
        • By End User
    • Brazil
      • Pricing Analysis
      • Market Share Analysis, 2024
        • By Treatment Type
        • By Function
        • By Channel
        • By Claim
        • By Active Ingredient
        • By End User
    • Mexico
      • Pricing Analysis
      • Market Share Analysis, 2024
        • By Treatment Type
        • By Function
        • By Channel
        • By Claim
        • By Active Ingredient
        • By End User
    • Colombia
      • Pricing Analysis
      • Market Share Analysis, 2024
        • By Treatment Type
        • By Function
        • By Channel
        • By Claim
        • By Active Ingredient
        • By End User
    • Germany
      • Pricing Analysis
      • Market Share Analysis, 2024
        • By Treatment Type
        • By Function
        • By Channel
        • By Claim
        • By Active Ingredient
        • By End User
    • UK
      • Pricing Analysis
      • Market Share Analysis, 2024
        • By Treatment Type
        • By Function
        • By Channel
        • By Claim
        • By Active Ingredient
        • By End User
    • France
      • Pricing Analysis
      • Market Share Analysis, 2024
        • By Treatment Type
        • By Function
        • By Channel
        • By Claim
        • By Active Ingredient
        • By End User
    • Italy
      • Pricing Analysis
      • Market Share Analysis, 2024
        • By Treatment Type
        • By Function
        • By Channel
        • By Claim
        • By Active Ingredient
        • By End User
    • Spain
      • Pricing Analysis
      • Market Share Analysis, 2024
        • By Treatment Type
        • By Function
        • By Channel
        • By Claim
        • By Active Ingredient
        • By End User
    • Belgium
      • Pricing Analysis
      • Market Share Analysis, 2024
        • By Treatment Type
        • By Function
        • By Channel
        • By Claim
        • By Active Ingredient
        • By End User
    • Netherlands
      • Pricing Analysis
      • Market Share Analysis, 2024
        • By Treatment Type
        • By Function
        • By Channel
        • By Claim
        • By Active Ingredient
        • By End User
    • Nordic
      • Pricing Analysis
      • Market Share Analysis, 2024
        • By Treatment Type
        • By Function
        • By Channel
        • By Claim
        • By Active Ingredient
        • By End User
    • Switzerland
      • Pricing Analysis
      • Market Share Analysis, 2024
        • By Treatment Type
        • By Function
        • By Channel
        • By Claim
        • By Active Ingredient
        • By End User
    • Russia
      • Pricing Analysis
      • Market Share Analysis, 2024
        • By Treatment Type
        • By Function
        • By Channel
        • By Claim
        • By Active Ingredient
        • By End User
    • Poland
      • Pricing Analysis
      • Market Share Analysis, 2024
        • By Treatment Type
        • By Function
        • By Channel
        • By Claim
        • By Active Ingredient
        • By End User
    • China
      • Pricing Analysis
      • Market Share Analysis, 2024
        • By Treatment Type
        • By Function
        • By Channel
        • By Claim
        • By Active Ingredient
        • By End User
    • Japan
      • Pricing Analysis
      • Market Share Analysis, 2024
        • By Treatment Type
        • By Function
        • By Channel
        • By Claim
        • By Active Ingredient
        • By End User
    • South Korea
      • Pricing Analysis
      • Market Share Analysis, 2024
        • By Treatment Type
        • By Function
        • By Channel
        • By Claim
        • By Active Ingredient
        • By End User
    • India
      • Pricing Analysis
      • Market Share Analysis, 2024
        • By Treatment Type
        • By Function
        • By Channel
        • By Claim
        • By Active Ingredient
        • By End User
    • Thailand
      • Pricing Analysis
      • Market Share Analysis, 2024
        • By Treatment Type
        • By Function
        • By Channel
        • By Claim
        • By Active Ingredient
        • By End User
    • Indonesia
      • Pricing Analysis
      • Market Share Analysis, 2024
        • By Treatment Type
        • By Function
        • By Channel
        • By Claim
        • By Active Ingredient
        • By End User
    • Australia
      • Pricing Analysis
      • Market Share Analysis, 2024
        • By Treatment Type
        • By Function
        • By Channel
        • By Claim
        • By Active Ingredient
        • By End User
    • New Zealand
      • Pricing Analysis
      • Market Share Analysis, 2024
        • By Treatment Type
        • By Function
        • By Channel
        • By Claim
        • By Active Ingredient
        • By End User
    • Turkey
      • Pricing Analysis
      • Market Share Analysis, 2024
        • By Treatment Type
        • By Function
        • By Channel
        • By Claim
        • By Active Ingredient
        • By End User
    • UAE
      • Pricing Analysis
      • Market Share Analysis, 2024
        • By Treatment Type
        • By Function
        • By Channel
        • By Claim
        • By Active Ingredient
        • By End User
    • Saudi Arabia
      • Pricing Analysis
      • Market Share Analysis, 2024
        • By Treatment Type
        • By Function
        • By Channel
        • By Claim
        • By Active Ingredient
        • By End User
    • Israel
      • Pricing Analysis
      • Market Share Analysis, 2024
        • By Treatment Type
        • By Function
        • By Channel
        • By Claim
        • By Active Ingredient
        • By End User
    • North Africa
      • Pricing Analysis
      • Market Share Analysis, 2024
        • By Treatment Type
        • By Function
        • By Channel
        • By Claim
        • By Active Ingredient
        • By End User
    • South Africa
      • Pricing Analysis
      • Market Share Analysis, 2024
        • By Treatment Type
        • By Function
        • By Channel
        • By Claim
        • By Active Ingredient
        • By End User
  19. Market Structure Analysis
    • Competition Dashboard
    • Competition Benchmarking
    • Market Share Analysis of Top Players
      • By Regional
      • By Treatment Type
      • By Function
      • By Channel
      • By Claim
      • By Active Ingredient
      • By End User
  20. Competition Analysis
    • Competition Deep Dive
      • Differin
        • Overview
        • Product Portfolio
        • Profitability by Market Segments (Product/Age /Sales Channel/Region)
        • Sales Footprint
        • Strategy Overview
          • Marketing Strategy
          • Product Strategy
          • Channel Strategy
      • La Roche-Posay
        • Overview
        • Product Portfolio
        • Profitability by Market Segments (Product/Age /Sales Channel/Region)
        • Sales Footprint
        • Strategy Overview
          • Marketing Strategy
          • Product Strategy
          • Channel Strategy
      • Murad
        • Overview
        • Product Portfolio
        • Profitability by Market Segments (Product/Age /Sales Channel/Region)
        • Sales Footprint
        • Strategy Overview
          • Marketing Strategy
          • Product Strategy
          • Channel Strategy
      • Paula’s Choice
        • Overview
        • Product Portfolio
        • Profitability by Market Segments (Product/Age /Sales Channel/Region)
        • Sales Footprint
        • Strategy Overview
          • Marketing Strategy
          • Product Strategy
          • Channel Strategy
      • Neutrogena
        • Overview
        • Product Portfolio
        • Profitability by Market Segments (Product/Age /Sales Channel/Region)
        • Sales Footprint
        • Strategy Overview
          • Marketing Strategy
          • Product Strategy
          • Channel Strategy
      • AcneFree
        • Overview
        • Product Portfolio
        • Profitability by Market Segments (Product/Age /Sales Channel/Region)
        • Sales Footprint
        • Strategy Overview
          • Marketing Strategy
          • Product Strategy
          • Channel Strategy
      • Bioderma
        • Overview
        • Product Portfolio
        • Profitability by Market Segments (Product/Age /Sales Channel/Region)
        • Sales Footprint
        • Strategy Overview
          • Marketing Strategy
          • Product Strategy
          • Channel Strategy
      • AlumierMD
        • Overview
        • Product Portfolio
        • Profitability by Market Segments (Product/Age /Sales Channel/Region)
        • Sales Footprint
        • Strategy Overview
          • Marketing Strategy
          • Product Strategy
          • Channel Strategy
      • SkinCeuticals
        • Overview
        • Product Portfolio
        • Profitability by Market Segments (Product/Age /Sales Channel/Region)
        • Sales Footprint
        • Strategy Overview
          • Marketing Strategy
          • Product Strategy
          • Channel Strategy
      • Proactiv
        • Overview
        • Product Portfolio
        • Profitability by Market Segments (Product/Age /Sales Channel/Region)
        • Sales Footprint
        • Strategy Overview
          • Marketing Strategy
          • Product Strategy
          • Channel Strategy
  21. Assumptions & Acronyms Used
  22. Research Methodology

List of Tables

  • Table 1: Global Market Value (USD Million) Forecast by Region, 2020-2035
  • Table 2: Global Market Volume (Units) Forecast by Region, 2020-2035
  • Table 3: Global Market Value (USD Million) Forecast by Treatment Type, 2020-2035
  • Table 4: Global Market Volume (Units) Forecast by Treatment Type, 2020-2035
  • Table 5: Global Market Value (USD Million) Forecast by Function, 2020-2035
  • Table 6: Global Market Volume (Units) Forecast by Function, 2020-2035
  • Table 7: Global Market Value (USD Million) Forecast by Channel, 2020-2035
  • Table 8: Global Market Volume (Units) Forecast by Channel, 2020-2035
  • Table 9: Global Market Value (USD Million) Forecast by Claim, 2020-2035
  • Table 10: Global Market Volume (Units) Forecast by Claim, 2020-2035
  • Table 11: Global Market Value (USD Million) Forecast by Active Ingredient, 2020-2035
  • Table 12: Global Market Volume (Units) Forecast by Active Ingredient, 2020-2035
  • Table 13: Global Market Value (USD Million) Forecast by End User, 2020-2035
  • Table 14: Global Market Volume (Units) Forecast by End User, 2020-2035
  • Table 15: North America Market Value (USD Million) Forecast by Country, 2020-2035
  • Table 16: North America Market Volume (Units) Forecast by Country, 2020-2035
  • Table 17: North America Market Value (USD Million) Forecast by Treatment Type, 2020-2035
  • Table 18: North America Market Volume (Units) Forecast by Treatment Type, 2020-2035
  • Table 19: North America Market Value (USD Million) Forecast by Function, 2020-2035
  • Table 20: North America Market Volume (Units) Forecast by Function, 2020-2035
  • Table 21: North America Market Value (USD Million) Forecast by Channel, 2020-2035
  • Table 22: North America Market Volume (Units) Forecast by Channel, 2020-2035
  • Table 23: North America Market Value (USD Million) Forecast by Claim, 2020-2035
  • Table 24: North America Market Volume (Units) Forecast by Claim, 2020-2035
  • Table 25: North America Market Value (USD Million) Forecast by Active Ingredient, 2020-2035
  • Table 26: North America Market Volume (Units) Forecast by Active Ingredient, 2020-2035
  • Table 27: North America Market Value (USD Million) Forecast by End User, 2020-2035
  • Table 28: North America Market Volume (Units) Forecast by End User, 2020-2035
  • Table 29: Latin America Market Value (USD Million) Forecast by Country, 2020-2035
  • Table 30: Latin America Market Volume (Units) Forecast by Country, 2020-2035
  • Table 31: Latin America Market Value (USD Million) Forecast by Treatment Type, 2020-2035
  • Table 32: Latin America Market Volume (Units) Forecast by Treatment Type, 2020-2035
  • Table 33: Latin America Market Value (USD Million) Forecast by Function, 2020-2035
  • Table 34: Latin America Market Volume (Units) Forecast by Function, 2020-2035
  • Table 35: Latin America Market Value (USD Million) Forecast by Channel, 2020-2035
  • Table 36: Latin America Market Volume (Units) Forecast by Channel, 2020-2035
  • Table 37: Latin America Market Value (USD Million) Forecast by Claim, 2020-2035
  • Table 38: Latin America Market Volume (Units) Forecast by Claim, 2020-2035
  • Table 39: Latin America Market Value (USD Million) Forecast by Active Ingredient, 2020-2035
  • Table 40: Latin America Market Volume (Units) Forecast by Active Ingredient, 2020-2035
  • Table 41: Latin America Market Value (USD Million) Forecast by End User, 2020-2035
  • Table 42: Latin America Market Volume (Units) Forecast by End User, 2020-2035
  • Table 43: Europe Market Value (USD Million) Forecast by Country, 2020-2035
  • Table 44: Europe Market Volume (Units) Forecast by Country, 2020-2035
  • Table 45: Europe Market Value (USD Million) Forecast by Treatment Type, 2020-2035
  • Table 46: Europe Market Volume (Units) Forecast by Treatment Type, 2020-2035
  • Table 47: Europe Market Value (USD Million) Forecast by Function, 2020-2035
  • Table 48: Europe Market Volume (Units) Forecast by Function, 2020-2035
  • Table 49: Europe Market Value (USD Million) Forecast by Channel, 2020-2035
  • Table 50: Europe Market Volume (Units) Forecast by Channel, 2020-2035
  • Table 51: Europe Market Value (USD Million) Forecast by Claim, 2020-2035
  • Table 52: Europe Market Volume (Units) Forecast by Claim, 2020-2035
  • Table 53: Europe Market Value (USD Million) Forecast by Active Ingredient, 2020-2035
  • Table 54: Europe Market Volume (Units) Forecast by Active Ingredient, 2020-2035
  • Table 55: Europe Market Value (USD Million) Forecast by End User, 2020-2035
  • Table 56: Europe Market Volume (Units) Forecast by End User, 2020-2035
  • Table 57: East Asia Market Value (USD Million) Forecast by Country, 2020-2035
  • Table 58: East Asia Market Volume (Units) Forecast by Country, 2020-2035
  • Table 59: East Asia Market Value (USD Million) Forecast by Treatment Type, 2020-2035
  • Table 60: East Asia Market Volume (Units) Forecast by Treatment Type, 2020-2035
  • Table 61: East Asia Market Value (USD Million) Forecast by Function, 2020-2035
  • Table 62: East Asia Market Volume (Units) Forecast by Function, 2020-2035
  • Table 63: East Asia Market Value (USD Million) Forecast by Channel, 2020-2035
  • Table 64: East Asia Market Volume (Units) Forecast by Channel, 2020-2035
  • Table 65: East Asia Market Value (USD Million) Forecast by Claim, 2020-2035
  • Table 66: East Asia Market Volume (Units) Forecast by Claim, 2020-2035
  • Table 67: East Asia Market Value (USD Million) Forecast by Active Ingredient, 2020-2035
  • Table 68: East Asia Market Volume (Units) Forecast by Active Ingredient, 2020-2035
  • Table 69: East Asia Market Value (USD Million) Forecast by End User, 2020-2035
  • Table 70: East Asia Market Volume (Units) Forecast by End User, 2020-2035
  • Table 71: South Asia & Pacific Market Value (USD Million) Forecast by Country, 2020-2035
  • Table 72: South Asia & Pacific Market Volume (Units) Forecast by Country, 2020-2035
  • Table 73: South Asia & Pacific Market Value (USD Million) Forecast by Treatment Type, 2020-2035
  • Table 74: South Asia & Pacific Market Volume (Units) Forecast by Treatment Type, 2020-2035
  • Table 75: South Asia & Pacific Market Value (USD Million) Forecast by Function, 2020-2035
  • Table 76: South Asia & Pacific Market Volume (Units) Forecast by Function, 2020-2035
  • Table 77: South Asia & Pacific Market Value (USD Million) Forecast by Channel, 2020-2035
  • Table 78: South Asia & Pacific Market Volume (Units) Forecast by Channel, 2020-2035
  • Table 79: South Asia & Pacific Market Value (USD Million) Forecast by Claim, 2020-2035
  • Table 80: South Asia & Pacific Market Volume (Units) Forecast by Claim, 2020-2035
  • Table 81: South Asia & Pacific Market Value (USD Million) Forecast by Active Ingredient, 2020-2035
  • Table 82: South Asia & Pacific Market Volume (Units) Forecast by Active Ingredient, 2020-2035
  • Table 83: South Asia & Pacific Market Value (USD Million) Forecast by End User, 2020-2035
  • Table 84: South Asia & Pacific Market Volume (Units) Forecast by End User, 2020-2035
  • Table 85: Middle East and Africa Market Value (USD Million) Forecast by Country, 2020-2035
  • Table 86: Middle East and Africa Market Volume (Units) Forecast by Country, 2020-2035
  • Table 87: Middle East and Africa Market Value (USD Million) Forecast by Treatment Type, 2020-2035
  • Table 88: Middle East and Africa Market Volume (Units) Forecast by Treatment Type, 2020-2035
  • Table 89: Middle East and Africa Market Value (USD Million) Forecast by Function, 2020-2035
  • Table 90: Middle East and Africa Market Volume (Units) Forecast by Function, 2020-2035
  • Table 91: Middle East and Africa Market Value (USD Million) Forecast by Channel, 2020-2035
  • Table 92: Middle East and Africa Market Volume (Units) Forecast by Channel, 2020-2035
  • Table 93: Middle East and Africa Market Value (USD Million) Forecast by Claim, 2020-2035
  • Table 94: Middle East and Africa Market Volume (Units) Forecast by Claim, 2020-2035
  • Table 95: Middle East and Africa Market Value (USD Million) Forecast by Active Ingredient, 2020-2035
  • Table 96: Middle East and Africa Market Volume (Units) Forecast by Active Ingredient, 2020-2035
  • Table 97: Middle East and Africa Market Value (USD Million) Forecast by End User, 2020-2035
  • Table 98: Middle East and Africa Market Volume (Units) Forecast by End User, 2020-2035

List of Figures

  • Figure 1: Global Market Value (USD Million) by Treatment Type, 2025-2035
  • Figure 2: Global Market Value (USD Million) by Function, 2025-2035
  • Figure 3: Global Market Value (USD Million) by Channel, 2025-2035
  • Figure 4: Global Market Value (USD Million) by Claim, 2025-2035
  • Figure 5: Global Market Value (USD Million) by Active Ingredient, 2025-2035
  • Figure 6: Global Market Value (USD Million) by End User, 2025-2035
  • Figure 7: Global Market Value (USD Million) by Region, 2025-2035
  • Figure 8: Global Market Value (USD Million) Analysis by Region, 2020-2035
  • Figure 9: Global Market Volume (Units) Analysis by Region, 2020-2035
  • Figure 10: Global Market Value Share (%) and BPS Analysis by Region, 2025-2035
  • Figure 11: Global Market Y-o-Y Growth (%) Projections by Region, 2025-2035
  • Figure 12: Global Market Value (USD Million) Analysis by Treatment Type, 2020-2035
  • Figure 13: Global Market Volume (Units) Analysis by Treatment Type, 2020-2035
  • Figure 14: Global Market Value Share (%) and BPS Analysis by Treatment Type, 2025-2035
  • Figure 15: Global Market Y-o-Y Growth (%) Projections by Treatment Type, 2025-2035
  • Figure 16: Global Market Value (USD Million) Analysis by Function, 2020-2035
  • Figure 17: Global Market Volume (Units) Analysis by Function, 2020-2035
  • Figure 18: Global Market Value Share (%) and BPS Analysis by Function, 2025-2035
  • Figure 19: Global Market Y-o-Y Growth (%) Projections by Function, 2025-2035
  • Figure 20: Global Market Value (USD Million) Analysis by Channel, 2020-2035
  • Figure 21: Global Market Volume (Units) Analysis by Channel, 2020-2035
  • Figure 22: Global Market Value Share (%) and BPS Analysis by Channel, 2025-2035
  • Figure 23: Global Market Y-o-Y Growth (%) Projections by Channel, 2025-2035
  • Figure 24: Global Market Value (USD Million) Analysis by Claim, 2020-2035
  • Figure 25: Global Market Volume (Units) Analysis by Claim, 2020-2035
  • Figure 26: Global Market Value Share (%) and BPS Analysis by Claim, 2025-2035
  • Figure 27: Global Market Y-o-Y Growth (%) Projections by Claim, 2025-2035
  • Figure 28: Global Market Value (USD Million) Analysis by Active Ingredient, 2020-2035
  • Figure 29: Global Market Volume (Units) Analysis by Active Ingredient, 2020-2035
  • Figure 30: Global Market Value Share (%) and BPS Analysis by Active Ingredient, 2025-2035
  • Figure 31: Global Market Y-o-Y Growth (%) Projections by Active Ingredient, 2025-2035
  • Figure 32: Global Market Value (USD Million) Analysis by End User, 2020-2035
  • Figure 33: Global Market Volume (Units) Analysis by End User, 2020-2035
  • Figure 34: Global Market Value Share (%) and BPS Analysis by End User, 2025-2035
  • Figure 35: Global Market Y-o-Y Growth (%) Projections by End User, 2025-2035
  • Figure 36: Global Market Attractiveness by Treatment Type, 2025-2035
  • Figure 37: Global Market Attractiveness by Function, 2025-2035
  • Figure 38: Global Market Attractiveness by Channel, 2025-2035
  • Figure 39: Global Market Attractiveness by Claim, 2025-2035
  • Figure 40: Global Market Attractiveness by Active Ingredient, 2025-2035
  • Figure 41: Global Market Attractiveness by End User, 2025-2035
  • Figure 42: Global Market Attractiveness by Region, 2025-2035
  • Figure 43: North America Market Value (USD Million) by Treatment Type, 2025-2035
  • Figure 44: North America Market Value (USD Million) by Function, 2025-2035
  • Figure 45: North America Market Value (USD Million) by Channel, 2025-2035
  • Figure 46: North America Market Value (USD Million) by Claim, 2025-2035
  • Figure 47: North America Market Value (USD Million) by Active Ingredient, 2025-2035
  • Figure 48: North America Market Value (USD Million) by End User, 2025-2035
  • Figure 49: North America Market Value (USD Million) by Country, 2025-2035
  • Figure 50: North America Market Value (USD Million) Analysis by Country, 2020-2035
  • Figure 51: North America Market Volume (Units) Analysis by Country, 2020-2035
  • Figure 52: North America Market Value Share (%) and BPS Analysis by Country, 2025-2035
  • Figure 53: North America Market Y-o-Y Growth (%) Projections by Country, 2025-2035
  • Figure 54: North America Market Value (USD Million) Analysis by Treatment Type, 2020-2035
  • Figure 55: North America Market Volume (Units) Analysis by Treatment Type, 2020-2035
  • Figure 56: North America Market Value Share (%) and BPS Analysis by Treatment Type, 2025-2035
  • Figure 57: North America Market Y-o-Y Growth (%) Projections by Treatment Type, 2025-2035
  • Figure 58: North America Market Value (USD Million) Analysis by Function, 2020-2035
  • Figure 59: North America Market Volume (Units) Analysis by Function, 2020-2035
  • Figure 60: North America Market Value Share (%) and BPS Analysis by Function, 2025-2035
  • Figure 61: North America Market Y-o-Y Growth (%) Projections by Function, 2025-2035
  • Figure 62: North America Market Value (USD Million) Analysis by Channel, 2020-2035
  • Figure 63: North America Market Volume (Units) Analysis by Channel, 2020-2035
  • Figure 64: North America Market Value Share (%) and BPS Analysis by Channel, 2025-2035
  • Figure 65: North America Market Y-o-Y Growth (%) Projections by Channel, 2025-2035
  • Figure 66: North America Market Value (USD Million) Analysis by Claim, 2020-2035
  • Figure 67: North America Market Volume (Units) Analysis by Claim, 2020-2035
  • Figure 68: North America Market Value Share (%) and BPS Analysis by Claim, 2025-2035
  • Figure 69: North America Market Y-o-Y Growth (%) Projections by Claim, 2025-2035
  • Figure 70: North America Market Value (USD Million) Analysis by Active Ingredient, 2020-2035
  • Figure 71: North America Market Volume (Units) Analysis by Active Ingredient, 2020-2035
  • Figure 72: North America Market Value Share (%) and BPS Analysis by Active Ingredient, 2025-2035
  • Figure 73: North America Market Y-o-Y Growth (%) Projections by Active Ingredient, 2025-2035
  • Figure 74: North America Market Value (USD Million) Analysis by End User, 2020-2035
  • Figure 75: North America Market Volume (Units) Analysis by End User, 2020-2035
  • Figure 76: North America Market Value Share (%) and BPS Analysis by End User, 2025-2035
  • Figure 77: North America Market Y-o-Y Growth (%) Projections by End User, 2025-2035
  • Figure 78: North America Market Attractiveness by Treatment Type, 2025-2035
  • Figure 79: North America Market Attractiveness by Function, 2025-2035
  • Figure 80: North America Market Attractiveness by Channel, 2025-2035
  • Figure 81: North America Market Attractiveness by Claim, 2025-2035
  • Figure 82: North America Market Attractiveness by Active Ingredient, 2025-2035
  • Figure 83: North America Market Attractiveness by End User, 2025-2035
  • Figure 84: North America Market Attractiveness by Country, 2025-2035
  • Figure 85: Latin America Market Value (USD Million) by Treatment Type, 2025-2035
  • Figure 86: Latin America Market Value (USD Million) by Function, 2025-2035
  • Figure 87: Latin America Market Value (USD Million) by Channel, 2025-2035
  • Figure 88: Latin America Market Value (USD Million) by Claim, 2025-2035
  • Figure 89: Latin America Market Value (USD Million) by Active Ingredient, 2025-2035
  • Figure 90: Latin America Market Value (USD Million) by End User, 2025-2035
  • Figure 91: Latin America Market Value (USD Million) by Country, 2025-2035
  • Figure 92: Latin America Market Value (USD Million) Analysis by Country, 2020-2035
  • Figure 93: Latin America Market Volume (Units) Analysis by Country, 2020-2035
  • Figure 94: Latin America Market Value Share (%) and BPS Analysis by Country, 2025-2035
  • Figure 95: Latin America Market Y-o-Y Growth (%) Projections by Country, 2025-2035
  • Figure 96: Latin America Market Value (USD Million) Analysis by Treatment Type, 2020-2035
  • Figure 97: Latin America Market Volume (Units) Analysis by Treatment Type, 2020-2035
  • Figure 98: Latin America Market Value Share (%) and BPS Analysis by Treatment Type, 2025-2035
  • Figure 99: Latin America Market Y-o-Y Growth (%) Projections by Treatment Type, 2025-2035
  • Figure 100: Latin America Market Value (USD Million) Analysis by Function, 2020-2035
  • Figure 101: Latin America Market Volume (Units) Analysis by Function, 2020-2035
  • Figure 102: Latin America Market Value Share (%) and BPS Analysis by Function, 2025-2035
  • Figure 103: Latin America Market Y-o-Y Growth (%) Projections by Function, 2025-2035
  • Figure 104: Latin America Market Value (USD Million) Analysis by Channel, 2020-2035
  • Figure 105: Latin America Market Volume (Units) Analysis by Channel, 2020-2035
  • Figure 106: Latin America Market Value Share (%) and BPS Analysis by Channel, 2025-2035
  • Figure 107: Latin America Market Y-o-Y Growth (%) Projections by Channel, 2025-2035
  • Figure 108: Latin America Market Value (USD Million) Analysis by Claim, 2020-2035
  • Figure 109: Latin America Market Volume (Units) Analysis by Claim, 2020-2035
  • Figure 110: Latin America Market Value Share (%) and BPS Analysis by Claim, 2025-2035
  • Figure 111: Latin America Market Y-o-Y Growth (%) Projections by Claim, 2025-2035
  • Figure 112: Latin America Market Value (USD Million) Analysis by Active Ingredient, 2020-2035
  • Figure 113: Latin America Market Volume (Units) Analysis by Active Ingredient, 2020-2035
  • Figure 114: Latin America Market Value Share (%) and BPS Analysis by Active Ingredient, 2025-2035
  • Figure 115: Latin America Market Y-o-Y Growth (%) Projections by Active Ingredient, 2025-2035
  • Figure 116: Latin America Market Value (USD Million) Analysis by End User, 2020-2035
  • Figure 117: Latin America Market Volume (Units) Analysis by End User, 2020-2035
  • Figure 118: Latin America Market Value Share (%) and BPS Analysis by End User, 2025-2035
  • Figure 119: Latin America Market Y-o-Y Growth (%) Projections by End User, 2025-2035
  • Figure 120: Latin America Market Attractiveness by Treatment Type, 2025-2035
  • Figure 121: Latin America Market Attractiveness by Function, 2025-2035
  • Figure 122: Latin America Market Attractiveness by Channel, 2025-2035
  • Figure 123: Latin America Market Attractiveness by Claim, 2025-2035
  • Figure 124: Latin America Market Attractiveness by Active Ingredient, 2025-2035
  • Figure 125: Latin America Market Attractiveness by End User, 2025-2035
  • Figure 126: Latin America Market Attractiveness by Country, 2025-2035
  • Figure 127: Europe Market Value (USD Million) by Treatment Type, 2025-2035
  • Figure 128: Europe Market Value (USD Million) by Function, 2025-2035
  • Figure 129: Europe Market Value (USD Million) by Channel, 2025-2035
  • Figure 130: Europe Market Value (USD Million) by Claim, 2025-2035
  • Figure 131: Europe Market Value (USD Million) by Active Ingredient, 2025-2035
  • Figure 132: Europe Market Value (USD Million) by End User, 2025-2035
  • Figure 133: Europe Market Value (USD Million) by Country, 2025-2035
  • Figure 134: Europe Market Value (USD Million) Analysis by Country, 2020-2035
  • Figure 135: Europe Market Volume (Units) Analysis by Country, 2020-2035
  • Figure 136: Europe Market Value Share (%) and BPS Analysis by Country, 2025-2035
  • Figure 137: Europe Market Y-o-Y Growth (%) Projections by Country, 2025-2035
  • Figure 138: Europe Market Value (USD Million) Analysis by Treatment Type, 2020-2035
  • Figure 139: Europe Market Volume (Units) Analysis by Treatment Type, 2020-2035
  • Figure 140: Europe Market Value Share (%) and BPS Analysis by Treatment Type, 2025-2035
  • Figure 141: Europe Market Y-o-Y Growth (%) Projections by Treatment Type, 2025-2035
  • Figure 142: Europe Market Value (USD Million) Analysis by Function, 2020-2035
  • Figure 143: Europe Market Volume (Units) Analysis by Function, 2020-2035
  • Figure 144: Europe Market Value Share (%) and BPS Analysis by Function, 2025-2035
  • Figure 145: Europe Market Y-o-Y Growth (%) Projections by Function, 2025-2035
  • Figure 146: Europe Market Value (USD Million) Analysis by Channel, 2020-2035
  • Figure 147: Europe Market Volume (Units) Analysis by Channel, 2020-2035
  • Figure 148: Europe Market Value Share (%) and BPS Analysis by Channel, 2025-2035
  • Figure 149: Europe Market Y-o-Y Growth (%) Projections by Channel, 2025-2035
  • Figure 150: Europe Market Value (USD Million) Analysis by Claim, 2020-2035
  • Figure 151: Europe Market Volume (Units) Analysis by Claim, 2020-2035
  • Figure 152: Europe Market Value Share (%) and BPS Analysis by Claim, 2025-2035
  • Figure 153: Europe Market Y-o-Y Growth (%) Projections by Claim, 2025-2035
  • Figure 154: Europe Market Value (USD Million) Analysis by Active Ingredient, 2020-2035
  • Figure 155: Europe Market Volume (Units) Analysis by Active Ingredient, 2020-2035
  • Figure 156: Europe Market Value Share (%) and BPS Analysis by Active Ingredient, 2025-2035
  • Figure 157: Europe Market Y-o-Y Growth (%) Projections by Active Ingredient, 2025-2035
  • Figure 158: Europe Market Value (USD Million) Analysis by End User, 2020-2035
  • Figure 159: Europe Market Volume (Units) Analysis by End User, 2020-2035
  • Figure 160: Europe Market Value Share (%) and BPS Analysis by End User, 2025-2035
  • Figure 161: Europe Market Y-o-Y Growth (%) Projections by End User, 2025-2035
  • Figure 162: Europe Market Attractiveness by Treatment Type, 2025-2035
  • Figure 163: Europe Market Attractiveness by Function, 2025-2035
  • Figure 164: Europe Market Attractiveness by Channel, 2025-2035
  • Figure 165: Europe Market Attractiveness by Claim, 2025-2035
  • Figure 166: Europe Market Attractiveness by Active Ingredient, 2025-2035
  • Figure 167: Europe Market Attractiveness by End User, 2025-2035
  • Figure 168: Europe Market Attractiveness by Country, 2025-2035
  • Figure 169: East Asia Market Value (USD Million) by Treatment Type, 2025-2035
  • Figure 170: East Asia Market Value (USD Million) by Function, 2025-2035
  • Figure 171: East Asia Market Value (USD Million) by Channel, 2025-2035
  • Figure 172: East Asia Market Value (USD Million) by Claim, 2025-2035
  • Figure 173: East Asia Market Value (USD Million) by Active Ingredient, 2025-2035
  • Figure 174: East Asia Market Value (USD Million) by End User, 2025-2035
  • Figure 175: East Asia Market Value (USD Million) by Country, 2025-2035
  • Figure 176: East Asia Market Value (USD Million) Analysis by Country, 2020-2035
  • Figure 177: East Asia Market Volume (Units) Analysis by Country, 2020-2035
  • Figure 178: East Asia Market Value Share (%) and BPS Analysis by Country, 2025-2035
  • Figure 179: East Asia Market Y-o-Y Growth (%) Projections by Country, 2025-2035
  • Figure 180: East Asia Market Value (USD Million) Analysis by Treatment Type, 2020-2035
  • Figure 181: East Asia Market Volume (Units) Analysis by Treatment Type, 2020-2035
  • Figure 182: East Asia Market Value Share (%) and BPS Analysis by Treatment Type, 2025-2035
  • Figure 183: East Asia Market Y-o-Y Growth (%) Projections by Treatment Type, 2025-2035
  • Figure 184: East Asia Market Value (USD Million) Analysis by Function, 2020-2035
  • Figure 185: East Asia Market Volume (Units) Analysis by Function, 2020-2035
  • Figure 186: East Asia Market Value Share (%) and BPS Analysis by Function, 2025-2035
  • Figure 187: East Asia Market Y-o-Y Growth (%) Projections by Function, 2025-2035
  • Figure 188: East Asia Market Value (USD Million) Analysis by Channel, 2020-2035
  • Figure 189: East Asia Market Volume (Units) Analysis by Channel, 2020-2035
  • Figure 190: East Asia Market Value Share (%) and BPS Analysis by Channel, 2025-2035
  • Figure 191: East Asia Market Y-o-Y Growth (%) Projections by Channel, 2025-2035
  • Figure 192: East Asia Market Value (USD Million) Analysis by Claim, 2020-2035
  • Figure 193: East Asia Market Volume (Units) Analysis by Claim, 2020-2035
  • Figure 194: East Asia Market Value Share (%) and BPS Analysis by Claim, 2025-2035
  • Figure 195: East Asia Market Y-o-Y Growth (%) Projections by Claim, 2025-2035
  • Figure 196: East Asia Market Value (USD Million) Analysis by Active Ingredient, 2020-2035
  • Figure 197: East Asia Market Volume (Units) Analysis by Active Ingredient, 2020-2035
  • Figure 198: East Asia Market Value Share (%) and BPS Analysis by Active Ingredient, 2025-2035
  • Figure 199: East Asia Market Y-o-Y Growth (%) Projections by Active Ingredient, 2025-2035
  • Figure 200: East Asia Market Value (USD Million) Analysis by End User, 2020-2035
  • Figure 201: East Asia Market Volume (Units) Analysis by End User, 2020-2035
  • Figure 202: East Asia Market Value Share (%) and BPS Analysis by End User, 2025-2035
  • Figure 203: East Asia Market Y-o-Y Growth (%) Projections by End User, 2025-2035
  • Figure 204: East Asia Market Attractiveness by Treatment Type, 2025-2035
  • Figure 205: East Asia Market Attractiveness by Function, 2025-2035
  • Figure 206: East Asia Market Attractiveness by Channel, 2025-2035
  • Figure 207: East Asia Market Attractiveness by Claim, 2025-2035
  • Figure 208: East Asia Market Attractiveness by Active Ingredient, 2025-2035
  • Figure 209: East Asia Market Attractiveness by End User, 2025-2035
  • Figure 210: East Asia Market Attractiveness by Country, 2025-2035
  • Figure 211: South Asia & Pacific Market Value (USD Million) by Treatment Type, 2025-2035
  • Figure 212: South Asia & Pacific Market Value (USD Million) by Function, 2025-2035
  • Figure 213: South Asia & Pacific Market Value (USD Million) by Channel, 2025-2035
  • Figure 214: South Asia & Pacific Market Value (USD Million) by Claim, 2025-2035
  • Figure 215: South Asia & Pacific Market Value (USD Million) by Active Ingredient, 2025-2035
  • Figure 216: South Asia & Pacific Market Value (USD Million) by End User, 2025-2035
  • Figure 217: South Asia & Pacific Market Value (USD Million) by Country, 2025-2035
  • Figure 218: South Asia & Pacific Market Value (USD Million) Analysis by Country, 2020-2035
  • Figure 219: South Asia & Pacific Market Volume (Units) Analysis by Country, 2020-2035
  • Figure 220: South Asia & Pacific Market Value Share (%) and BPS Analysis by Country, 2025-2035
  • Figure 221: South Asia & Pacific Market Y-o-Y Growth (%) Projections by Country, 2025-2035
  • Figure 222: South Asia & Pacific Market Value (USD Million) Analysis by Treatment Type, 2020-2035
  • Figure 223: South Asia & Pacific Market Volume (Units) Analysis by Treatment Type, 2020-2035
  • Figure 224: South Asia & Pacific Market Value Share (%) and BPS Analysis by Treatment Type, 2025-2035
  • Figure 225: South Asia & Pacific Market Y-o-Y Growth (%) Projections by Treatment Type, 2025-2035
  • Figure 226: South Asia & Pacific Market Value (USD Million) Analysis by Function, 2020-2035
  • Figure 227: South Asia & Pacific Market Volume (Units) Analysis by Function, 2020-2035
  • Figure 228: South Asia & Pacific Market Value Share (%) and BPS Analysis by Function, 2025-2035
  • Figure 229: South Asia & Pacific Market Y-o-Y Growth (%) Projections by Function, 2025-2035
  • Figure 230: South Asia & Pacific Market Value (USD Million) Analysis by Channel, 2020-2035
  • Figure 231: South Asia & Pacific Market Volume (Units) Analysis by Channel, 2020-2035
  • Figure 232: South Asia & Pacific Market Value Share (%) and BPS Analysis by Channel, 2025-2035
  • Figure 233: South Asia & Pacific Market Y-o-Y Growth (%) Projections by Channel, 2025-2035
  • Figure 234: South Asia & Pacific Market Value (USD Million) Analysis by Claim, 2020-2035
  • Figure 235: South Asia & Pacific Market Volume (Units) Analysis by Claim, 2020-2035
  • Figure 236: South Asia & Pacific Market Value Share (%) and BPS Analysis by Claim, 2025-2035
  • Figure 237: South Asia & Pacific Market Y-o-Y Growth (%) Projections by Claim, 2025-2035
  • Figure 238: South Asia & Pacific Market Value (USD Million) Analysis by Active Ingredient, 2020-2035
  • Figure 239: South Asia & Pacific Market Volume (Units) Analysis by Active Ingredient, 2020-2035
  • Figure 240: South Asia & Pacific Market Value Share (%) and BPS Analysis by Active Ingredient, 2025-2035
  • Figure 241: South Asia & Pacific Market Y-o-Y Growth (%) Projections by Active Ingredient, 2025-2035
  • Figure 242: South Asia & Pacific Market Value (USD Million) Analysis by End User, 2020-2035
  • Figure 243: South Asia & Pacific Market Volume (Units) Analysis by End User, 2020-2035
  • Figure 244: South Asia & Pacific Market Value Share (%) and BPS Analysis by End User, 2025-2035
  • Figure 245: South Asia & Pacific Market Y-o-Y Growth (%) Projections by End User, 2025-2035
  • Figure 246: South Asia & Pacific Market Attractiveness by Treatment Type, 2025-2035
  • Figure 247: South Asia & Pacific Market Attractiveness by Function, 2025-2035
  • Figure 248: South Asia & Pacific Market Attractiveness by Channel, 2025-2035
  • Figure 249: South Asia & Pacific Market Attractiveness by Claim, 2025-2035
  • Figure 250: South Asia & Pacific Market Attractiveness by Active Ingredient, 2025-2035
  • Figure 251: South Asia & Pacific Market Attractiveness by End User, 2025-2035
  • Figure 252: South Asia & Pacific Market Attractiveness by Country, 2025-2035
  • Figure 253: Middle East and Africa Market Value (USD Million) by Treatment Type, 2025-2035
  • Figure 254: Middle East and Africa Market Value (USD Million) by Function, 2025-2035
  • Figure 255: Middle East and Africa Market Value (USD Million) by Channel, 2025-2035
  • Figure 256: Middle East and Africa Market Value (USD Million) by Claim, 2025-2035
  • Figure 257: Middle East and Africa Market Value (USD Million) by Active Ingredient, 2025-2035
  • Figure 258: Middle East and Africa Market Value (USD Million) by End User, 2025-2035
  • Figure 259: Middle East and Africa Market Value (USD Million) by Country, 2025-2035
  • Figure 260: Middle East and Africa Market Value (USD Million) Analysis by Country, 2020-2035
  • Figure 261: Middle East and Africa Market Volume (Units) Analysis by Country, 2020-2035
  • Figure 262: Middle East and Africa Market Value Share (%) and BPS Analysis by Country, 2025-2035
  • Figure 263: Middle East and Africa Market Y-o-Y Growth (%) Projections by Country, 2025-2035
  • Figure 264: Middle East and Africa Market Value (USD Million) Analysis by Treatment Type, 2020-2035
  • Figure 265: Middle East and Africa Market Volume (Units) Analysis by Treatment Type, 2020-2035
  • Figure 266: Middle East and Africa Market Value Share (%) and BPS Analysis by Treatment Type, 2025-2035
  • Figure 267: Middle East and Africa Market Y-o-Y Growth (%) Projections by Treatment Type, 2025-2035
  • Figure 268: Middle East and Africa Market Value (USD Million) Analysis by Function, 2020-2035
  • Figure 269: Middle East and Africa Market Volume (Units) Analysis by Function, 2020-2035
  • Figure 270: Middle East and Africa Market Value Share (%) and BPS Analysis by Function, 2025-2035
  • Figure 271: Middle East and Africa Market Y-o-Y Growth (%) Projections by Function, 2025-2035
  • Figure 272: Middle East and Africa Market Value (USD Million) Analysis by Channel, 2020-2035
  • Figure 273: Middle East and Africa Market Volume (Units) Analysis by Channel, 2020-2035
  • Figure 274: Middle East and Africa Market Value Share (%) and BPS Analysis by Channel, 2025-2035
  • Figure 275: Middle East and Africa Market Y-o-Y Growth (%) Projections by Channel, 2025-2035
  • Figure 276: Middle East and Africa Market Value (USD Million) Analysis by Claim, 2020-2035
  • Figure 277: Middle East and Africa Market Volume (Units) Analysis by Claim, 2020-2035
  • Figure 278: Middle East and Africa Market Value Share (%) and BPS Analysis by Claim, 2025-2035
  • Figure 279: Middle East and Africa Market Y-o-Y Growth (%) Projections by Claim, 2025-2035
  • Figure 280: Middle East and Africa Market Value (USD Million) Analysis by Active Ingredient, 2020-2035
  • Figure 281: Middle East and Africa Market Volume (Units) Analysis by Active Ingredient, 2020-2035
  • Figure 282: Middle East and Africa Market Value Share (%) and BPS Analysis by Active Ingredient, 2025-2035
  • Figure 283: Middle East and Africa Market Y-o-Y Growth (%) Projections by Active Ingredient, 2025-2035
  • Figure 284: Middle East and Africa Market Value (USD Million) Analysis by End User, 2020-2035
  • Figure 285: Middle East and Africa Market Volume (Units) Analysis by End User, 2020-2035
  • Figure 286: Middle East and Africa Market Value Share (%) and BPS Analysis by End User, 2025-2035
  • Figure 287: Middle East and Africa Market Y-o-Y Growth (%) Projections by End User, 2025-2035
  • Figure 288: Middle East and Africa Market Attractiveness by Treatment Type, 2025-2035
  • Figure 289: Middle East and Africa Market Attractiveness by Function, 2025-2035
  • Figure 290: Middle East and Africa Market Attractiveness by Channel, 2025-2035
  • Figure 291: Middle East and Africa Market Attractiveness by Claim, 2025-2035
  • Figure 292: Middle East and Africa Market Attractiveness by Active Ingredient, 2025-2035
  • Figure 293: Middle East and Africa Market Attractiveness by End User, 2025-2035
  • Figure 294: Middle East and Africa Market Attractiveness by Country, 2025-2035

Frequently Asked Questions

How big is the Hormonal Acne Solutions Market in 2025?

The Hormonal Acne Solutions Market is estimated to be valued at USD 5,502.3 million in 2025.

What will be the size of the Hormonal Acne Solutions Market in 2035?

The market size for the Hormonal Acne Solutions Market is projected to reach USD 12,801.6 million by 2035.

How much will the Hormonal Acne Solutions Market grow between 2025 and 2035?

The Hormonal Acne Solutions Market is expected to grow at a CAGR of 8.8% between 2025 and 2035.

What are the key treatment types in the Hormonal Acne Solutions Market?

The key treatment types in the Hormonal Acne Solutions Market are topical creams/gels, oral medications, supplements/nutricosmetics, and clinical procedures adjunct.

Which function segment will contribute the most in the Hormonal Acne Solutions Market in 2025?

In terms of function, the anti-inflammatory segment is projected to command 42% share of the Hormonal Acne Solutions Market in 2025.

Explore Similar Insights

Future Market Insights

Hormonal Acne Solutions Market

Chat With

MaRIA

Hi There, I am MaRIA, Your Market Research Intelligence Assistant. How may I help you?