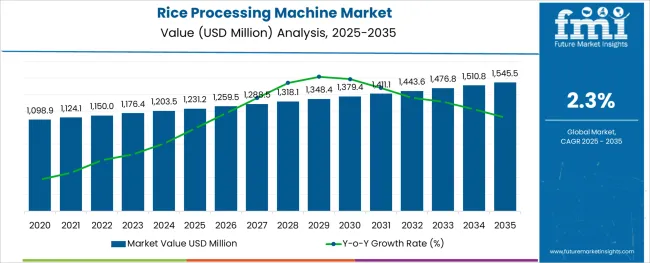
The Rice Processing Machine Market is estimated to be valued at USD 1231.2 million in 2025 and is projected to reach USD 1545.5 million by 2035, registering a compound annual growth rate (CAGR) of 2.3% over the forecast period.

The rice processing machine market is witnessing consistent growth as technological advancements, operational efficiency demands, and evolving consumer expectations reshape the industry landscape. Rising global rice consumption, coupled with increasing emphasis on minimizing wastage and improving grain quality, has accelerated the adoption of advanced processing machines.
Manufacturers are focusing on integrating precision engineering and automation to enhance output quality while reducing energy consumption and operational costs. Regulatory emphasis on food safety and quality standards has further supported innovation and modernization across processing facilities.
In the coming years, growth is expected to be driven by the adoption of intelligent monitoring systems, modular designs, and improved durability of equipment, which are paving the way for greater productivity and sustainability in rice milling operations.
The market is segmented by Product Type, Mechanism, and Application and region. By Product Type, the market is divided into Horizontal Roller and Vertical Roller. In terms of Mechanism, the market is classified into Fraction Rice Milling Machine and Grind Rice Milling Machine. Based on Application, the market is segmented into Rice Whitening Machinery, Pre-cleaning Machinery, Separating Machinery, Grading Machinery, and Other Operations. Regionally, the market is classified into North America, Latin America, Western Europe, Eastern Europe, Balkan & Baltic Countries, Russia & Belarus, Central Asia, East Asia, South Asia & Pacific, and the Middle East & Africa.
The market is segmented by Product Type, Mechanism, and Application and region. By Product Type, the market is divided into Horizontal Roller and Vertical Roller. In terms of Mechanism, the market is classified into Fraction Rice Milling Machine and Grind Rice Milling Machine. Based on Application, the market is segmented into Rice Whitening Machinery, Pre-cleaning Machinery, Separating Machinery, Grading Machinery, and Other Operations. Regionally, the market is classified into North America, Latin America, Western Europe, Eastern Europe, Balkan & Baltic Countries, Russia & Belarus, Central Asia, East Asia, South Asia & Pacific, and the Middle East & Africa.

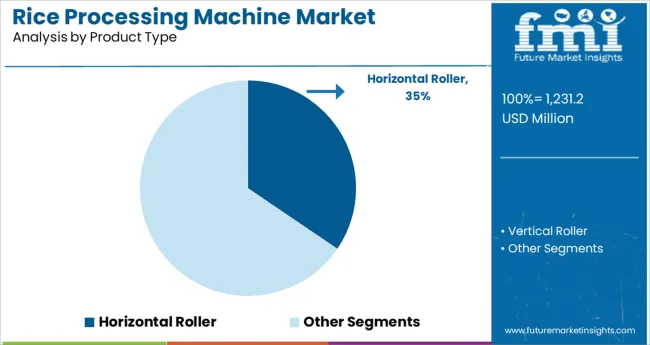
When segmented by product type, horizontal roller is expected to command 34.5 % of the total market revenue in 2025, emerging as the leading product type. Its leadership is supported by the robust and efficient design that facilitates uniform polishing and reduced breakage during processing.
The horizontal orientation has been recognized for enabling better pressure control and consistent contact between grains and abrasive surfaces, resulting in higher quality output. Operational longevity and reduced maintenance requirements have also contributed to its preference in large-scale facilities.
The ability to handle a variety of rice types with precision and to integrate seamlessly into existing processing lines has strengthened the position of horizontal roller machines, ensuring their continued dominance in the market.

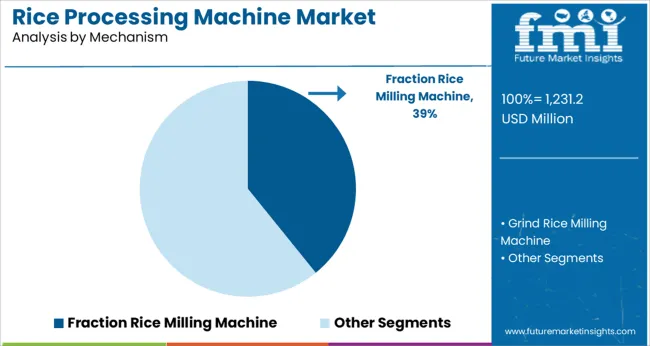
Segmented by mechanism, fraction rice milling machines are projected to hold 39.2 % of the overall market revenue in 2025, maintaining their position as the leading mechanism segment. This prominence is attributed to the ability of fraction milling machines to separate grains based on precise quality parameters, resulting in higher yields of premium-grade rice.
The mechanism’s capability to reduce broken grains and achieve optimal whiteness levels without compromising structural integrity has made it indispensable in modern milling operations. Additionally, the flexibility to adjust settings for different varieties and grades has provided millers with greater control over final product quality.
Enhanced energy efficiency and reduced operational losses have further reinforced the widespread adoption of fraction rice milling machines, establishing them as the preferred choice for achieving high-quality output at scale.

In terms of application, rice whitening machinery is anticipated to account for 27.8 % of the market revenue in 2025, positioning it as the leading application segment. This dominance is driven by the critical role of whitening machines in improving the aesthetic appeal and marketability of rice.
The machines are valued for their ability to remove bran layers efficiently while minimizing kernel damage and maintaining nutritional value. Their contribution to producing bright, polished grains that meet consumer preferences has reinforced their importance in the processing chain.
Technological improvements enabling uniform whitening, lower energy use, and reduced heat generation have enhanced performance and reliability, further boosting adoption. The role of rice whitening machinery as an essential step in achieving high-grade finished products has solidified its leadership in the application segment of the market.
As per the analysis of FMI, healthy snack variants are gaining wide popularity among consumers in many countries. The rising demand for rice-based snacks has encouraged many manufacturers to launch new packaged snacks. For instance, in January 2024, LT Foods Ltd. (LT Foods) formed a joint venture with Kameda Seika to enter the healthy premium snack food segment.
Together, they launched a range of rice crackers with the brand name KARI KARI. Therefore, the increasing demand for food products based on rice is anticipated to contribute to the advancement of the rice processing machines market, owing to the long shelf-life of packaged rice products.
After analyzing the market in-depth, the experts of FMI have unveiled that the rice processing machine market has been witnessing an unprecedented surge in the past few years. There is an approximate rise of USD 1231.2 million surge in the total market value from 2025 to 2025. The market during the period 2020 to 2025 registered a CAGR of 2.1%.
The spike in the sale of rice processing machines can be attributed to the demand for certified machinery. It is identified that adherence to Hazard Analysis and Critical Control Points (HACCP) in amalgamation with optimized wild rice processing equipment designs has supported the industry in achieving high-quality and sage rice processing machinery that meets consumer and regulatory expectations.
Besides this, aspects like the removal of all impurities from rice and ensuring that the processed rice is free from all types of foreign bodies is a key factor driving the growth of the rice processing machine market through the estimated period of study.
Horizontal Roller - By Product Type
It is identified that the horizontal roller rice processing machines are the most recognized in the product type category, and have accounted for major shares during the base year. Currently, the horizontal roller segment is anticipated to propel at a slow pace, registering a CAGR of 2.9%. The segment accounted for a historical CAGR of 2.1% during the base period of 2020 to 2025. The reasons attributing to the steady advancement of horizontal roller processing machines are identified as follows:
Pre-cleaning Machinery - By Operation Type
FMI has analyzed that the pre-cleaning machinery segment accounts for the highest market share in the global rice processing machine market. At present, this segment is moving forward at a moderate pace, recording a CAGR of 3.3%. The segment accounted for a historical CAGR of 2.4% during the period 2020 to 2025. The reasons contributing to the growth of this segment are as follows:

| Country | United States |
|---|---|
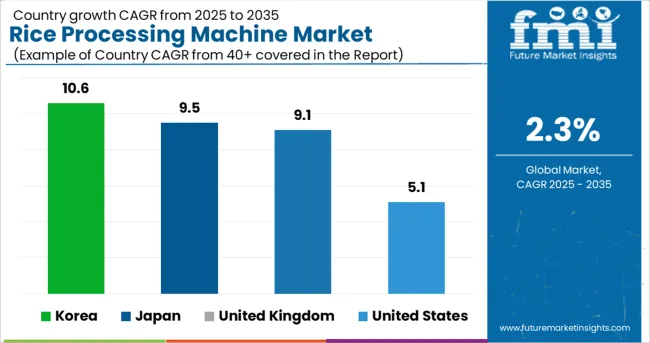
| Statistics | The rice processing machine market in the USA currently holds the maximum number of shares and has registered a market valuation of USD 1231.2 million in 2025. The market is projected to reach a valuation of USD 1545.5 million by the end of 2035. An approximate rise of USD 159.01 million has been witnessed from the base year to the current. CAGR for 2025 to 2035: 5.1% Historical CAGR (2020 to 2025): 4.4% |
| Growth propellants | The expanding market shares can be attributed to:
|
| Country | United Kingdom |
|---|---|
| Statistics | Europe is identified to hold a significant market share in the rice processing machine market. Currently, the United Kingdom is the leading country and is accountable for a market valuation of USD 64.70 million in 2025, advancing at a moderate-paced CAGR of 9.1%. The market valuation is expected to surpass USD 106.40 Million by 2035. There has been an approximate rise of USD 1098.90 million from the base year to the current. Historical CAGR (2020 to 2025): 8.3% |
| Growth propellants | Elements contributing to the growth of the market in the European region are:
|
| Country | Japan |
|---|---|
| Statistics | Japan is projected to advance at a rapid pace, registering a CAGR of 9.5% through the forecast period. The country is currently holding a market valuation of USD 76.47 million in 2025. FMI estimates valuation to surpass USD 189.51 million by the end of 2035. There has been an approximate rise of USD 113.04 million from the past years to current. Historical CAGR (2020 to 2025): 8.6% |
| Growth propellants | Factors contributing to the growth of the rice processing machine market in Japan are:
|
| Country | Korea |
|---|---|
| Statistics | The Korean rice processing machine market is anticipated to advance at a rapid-paced CAGR of 10.6% during the forecast period. At present, the market is holding a valuation of USD 17.65 million in 2025. The analysts at FMI have projected a market value of USD 48.33 million by 2035. There has been an approximate rise of USD 30.68 million from the base the year to current. Historical CAGR (2020 to 2025): 9.7% |
| Growth propellants | The factors attributing to the growth of the market in Korea are:
|
Emerging Companies Add an Edge to the Rice Processing Machine Market Dynamics
The new entrants in the rice processing machine market are leveraging advancements in technology to launch new products and gain a competitive advantage. These firms are continually investing in research and development activities to keep themselves in tandem with the changing consumer preferences and end-use industry demands. Efforts are being made to strengthen their foothold in the forum and aid the further progression of the rice processing machines market.
Top Start-ups to Watch For
Satake - Indian Start-up
This new entrant in the forum produces a comprehensive range of individual machines, integrated systems, and totally engineered solutions for whole-grain rice processing, a procession of wheat, and other whole grains.
Ag Growth International Inc - Canadian Start-up
This start-up company is a leading manufacturer of portable and stationary grain handling, storage, and condition equipment, including augers, belt conveyors, handling accessories, storage bins, and aeration equipment, and is making advancements in its products to acquire more market shares by meeting end-user demands.
Attempts of Key Players in Revamping the Market Dynamics
This statistical study conducted by Future Market Insights of the concerned machinery market encompasses successful business strategies deployed by the key vendors for rice processing after harvesting. The rice processing machinery market is fragmented, and the vendors are deploying organic and inorganic growth strategies to compete in the market.
The manufacturers are heavily investing in research and development activities to make technological advances in the machinery for giving a cleaner and polished rice to the end-users, acquiring more shares in the global market.
Buhler Stir Up the Soup in the Global Forum
Buhler plays a key role in the overall rice milling machines market and processing fast-growing rice volumes and has taken the pole position in the global industrialized rice processing market in the present as well as future forecast. Currently, around 32% of the global rice harvest through its rice milling machines is processed from Buhler.
Many small and medium-sized end-users are investing in pre-used models by Buhler and Satake. The significant differences in prices of pre-used models in comparison with the prices of new models of rice milling machinery are encouraging the use of pre-used units. Indiamart, Intermesh, and Wohl Associates are some of the suppliers that offer pre-used models of rice milling machinery online.
Supple Tek Pvt. Ltd. Strengthens its Foothold
Supple Tek Pvt. Ltd. is a professionally managed organization specializing in providing a comprehensive range of Basmati rice. Their vision underlies in monopolizing the basmati rice processing machinery industry, along with rice export in the forthcoming years. This firm’s manufacturing facilities meet the standard government guidelines and adhere to the health and safety measures too, procuring products from farms directly and maintaining the freshness of the same.
Recent Developments
The global rice processing machine market is estimated to be valued at USD 1,231.2 million in 2025.
It is projected to reach USD 1,545.5 million by 2035.
The market is expected to grow at a 2.3% CAGR between 2025 and 2035.
The key product types are horizontal roller and vertical roller.
fraction rice milling machine segment is expected to dominate with a 39.2% industry share in 2025.


Full Research Suite comprises of:
Market outlook & trends analysis
Interviews & case studies
Strategic recommendations
Vendor profiles & capabilities analysis
5-year forecasts
8 regions and 60+ country-level data splits
Market segment data splits
12 months of continuous data updates
DELIVERED AS:
PDF EXCEL ONLINE
Rice Bran Fatty Alcohols Market Size and Share Forecast Outlook 2025 to 2035
Rice Water Skincare Market Forecast and Outlook 2025 to 2035
Rice Water Haircare Market Size and Share Forecast Outlook 2025 to 2035
Rice Shampoo Bar Market Size and Share Forecast Outlook 2025 to 2035
Rice Bran Oil for Skin Care Market Size and Share Forecast Outlook 2025 to 2035
Rice Bran Oil Infusions Market Analysis - Size and Share Forecast Outlook 2025 to 2035
Rice Bran Derivatives Market Size and Share Forecast Outlook 2025 to 2035
Rice Derivative Market Size and Share Forecast Outlook 2025 to 2035
Rice Water Shampoo Market Size and Share Forecast Outlook 2025 to 2035
Rice Bran Oil Market Analysis by Type, End User, and Region Through 2035
Rice Bran Wax Market Analysis - Size, Share, and Forecast 2025 to 2035
Rice Cake Market Analysis - Size, Share, and Forecast Outlook 2025 to 2035
Rice Milk Market Trends - Dairy-Free Nutrition & Industry Growth 2025 to 2035
Rice-based Products Market Analysis by Product Type, Distribution Channel, and Region Through 2035
Key Players & Market Share in Rice Water Haircare Sector
Market Share Breakdown of Rice Shampoo Bar Manufacturers
Rice Paper Stand Up Pouch Market Growth & Sustainable Packaging 2024-2034
Rice Protein Market
Rice Mill Machine Market Size and Share Forecast Outlook 2025 to 2035
Rice Milling Machine Market Size and Share Forecast Outlook 2025 to 2035

Thank you!
You will receive an email from our Business Development Manager. Please be sure to check your SPAM/JUNK folder too.
Chat With
MaRIA