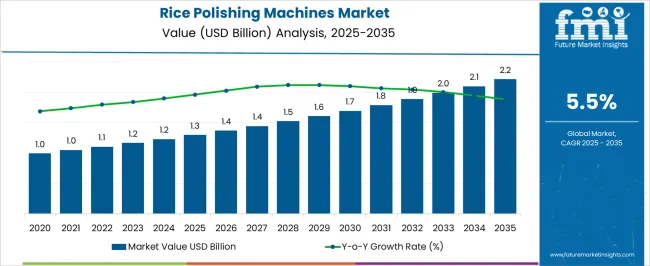
The global rice polishing market is expected to grow at a CAGR of 5.5% in the forecast period from 2023 to 2033. The rice polishing market is projected to reach a valuation of USD 1,9917 Million by the end of 2033. It is set to be valued at USD 1,166.0 Million in 2023.
A rice polishing machine is a system used to switch the physical position of rice. A rice polishing machine is a rugged machine that uses talc and other erratic contaminants to polish the outer bottom of rice grains. The rice polishing system polishes the rice soil by spraying water from the combination chamber and using a rubbing and milling roller to grind most grains.
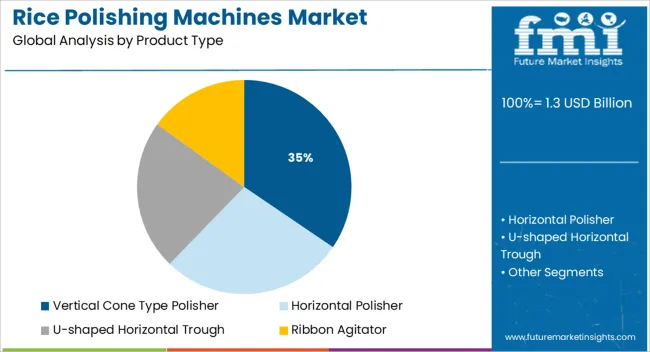
There are various types of rice polishing machines such as vertical cone grinders and horizontal grinders. The global rice polishing machines market is expected to grow rapidly during the forecast period due to rising demand for these machines from the rice milling industry.
The rapidly expanding restaurant and food & beverage industries across the globe are also projected to push sales in the rice polishing machines market during the evaluation period. Rice is considered to be the staple food of more than half of the world's population.
Asia Pacific is mainly set to be the leading consumer of rice polishing machines, which would further foster growth in the global market. In addition to that, continuous developments in the field of rice mill machinery, as well as attractive packaging of such machines would drive the market in emerging economies.
A large number of rice producers are nowadays providing a wide range of products such as wild, jasmine, white, and brown rice, among many other types of rice. However, rice is usually measured as a strategic commodity and is often controlled by governments of various countries.
It is because of the role of rice as a staple diet in several developing and developed countries. Increasing demand for high-quality rice from Gulf and European countries is also projected to bolster the global rice polishing machines market in the next ten years.
Rice is considered to be a convenient form of healthy and nutritious food item that is made available to consumers through retail channels. Technological advancements and developments in the field of rice mill machinery are also expected to accelerate growth in the global market. Apart from that, the high demand for fast food and the rising popularity of online food delivery applications across the globe is projected to aid growth.
Attributes | Key Insights |
---|---|
Global Rice Polishing Machines Market Estimated Size (2023E) | USD 1,166.0 Million |
Projected Market Valuation (2033) | USD 1,9917 Million |
Value-based CAGR (2023 to 2033) | 5.5% |
The global rice polishing machines market exhibited lucrative growth at a CAGR of 4.5% during the historical period of 2017 to 2022. The rising demand for specialty rice varieties in numerous developing countries has pushed the trade for long-grain rice. It has further augmented the global rice polishing machines market.
Continuously changing food habits and lifestyles of consumers are set to drive the fast-food industry, which would subsequently propel the global market in the next ten years. Also, the increasing population and their high disposable income are anticipated to bode well for the global rice polishing machines market. Owing to the aforementioned factors, the market is set to exhibit considerable growth at a CAGR of 5.5% in the assessment period from 2023 to 2033.
High Demand for Long-grain Rice in the USA to Push Sales of Rice Milling and Polishing Machines
As per FMI, the USA rice polishing machines market is projected to remain at the forefront in North America during the forecast period. Growth is attributed to increasing awareness about the significance of a healthy diet among consumers in the country. Also, the easy availability of rice-based food items across the USA through restaurants and hotels is likely to aid growth in the country.
As per the USA Department of Agriculture, long-grain rice production in the USA is concentrated in the South. Arkansas mainly grows 56-58 percent of the USA's long-grain crop. California, on the other hand, is considered to be the main producer of medium-grain rice, usually 70-76 percent of the crop. All USA rice is cultivated in irrigated fields, thereby achieving some of the highest yields across the globe.
Availability of Advanced Rice Huller with Polisher in Japan to Drive Growth
The design and capability of technologically advanced rice polishing machines are not the same as that of a level rice polisher, which is frequently found in a rice shop to clean rice that is to be consumed by large families. The availability of such machines in Japan is set to create clean rice with high quality. These factors are estimated to propel the Japanese rice polishing machines market in the next ten years.
With the introduction of vertical rice mills, rice polishing technology was renewed in the 1930s in Japan, and Ginjo high-quality sake, which was brewed at a low temperature of 60% or less, was eventually mass-produced in the 1980s. Today, in addition to the conventional horizontal rice milling machine, vertical rice polishing machines are used to mill the rice one consumes in Japan, which would eventually propel the market.
Cultivation of Japonica Rice in the UK to Boost Sales of Rice Production Machines
Imports of rice specialties from countries other than Europe are increasing. A particularly attractive product in the UK market is rice husks or milled rice from long-grain Indica rice such as basmati rice. Rice imports are expected to increase in the country during the forecast period.
When it comes to rice, approximately 60% of the demand is covered by European in-house production and so 1.8 million tons of rice husk rice must be imported. The European Union (EU) Agricultural Outlook 2020-2030 assumes that demand for imported rice will increase until 2030. Over the next decade, imports will increase by about 250,000 tons, but this amount will only affect the EU-27 and not the UK.
Japonica varieties (about 75%) are mainly found in the UK and these are distributed & consumed primarily in Southern Europe. Europe is a net exporter of Japonica rice. Common Asian Indica strains are best known in Northern Europe. There are many types of long-grain, aromatic indicators such as basmati rice and jasmine rice in the UK
Availability of Suitable Climate for Cultivation to Drive the Demand for Rice Cleaning Equipment in India
Presence of various renowned rice polishing companies in India such as Panesar Industrial Corporation, Reliable Exports, Global Agro Tech Engineers, M.G. Industries, JAGGO OVERSEAS, Mill Master Machinery Pvt. Ltd., New Bihar Engineering Company, Prakash Industries, and Synergy Exports LLP among others are projected to drive the market in the evaluation period. India is considered to be one of the top ten rice-producing countries in the Asia Pacific.
India is endowed with a wet environment suitable, which is best suited for rice cultivation. Rice-based farming is also considered to be a significant economic activity for hundreds of millions of farmers residing in rural India. As per the India Brand Equity Foundation (IBEF), India captured about 50% of the world market for rice in FY22. It is set to surge at a rapid rate with an increasing population, thereby bolstering the rice polishing machines market.
Demand for Automatic Rice Polisher Machines to Surge by the End of 2033
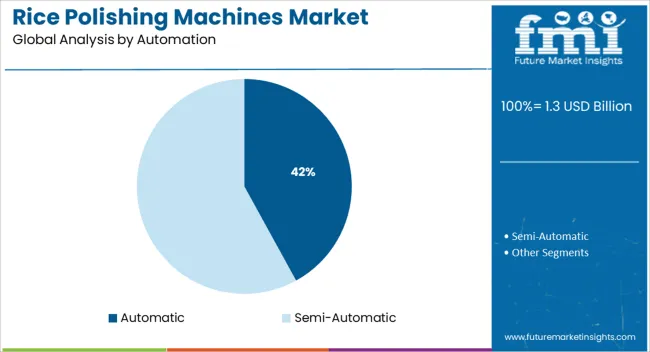
Based on automation, the automatic segment is estimated to lead the global rice polishing machines market in the assessment period. Rising demand for specialty rice and fragrant rice in India and the USA is projected to compel manufacturers to provide their products on time to their clients. Automatic machines help in polishing the rice faster than semi-automatic machines. Owing to the aforementioned factors, the demand for automatic rice polishing machines is likely to increase in the forecast period.
The global rice polishing machines market is highly fragmented and competitive due to the presence of several local and regional companies. Key players are adopting a wide range of marketing strategies such as partnerships, expansions, mergers & acquisitions, and collaborations to compete with their rivals.
Some of the leading companies operating in the rice polishing machines market are SATAKE Group, FH SCHULE Muehlenbau, Pavan Group, Lianyungang Huantai Machinery, IndiaMART InterMESH Limited, Buhler AG, SATAKE INDIA, YANMAR, Hunan Sunfield Machinery, and MILLTEC Machinery among others.
Satake and IndiaMART InterMESH Limited Aim to Offer Sustainable Milling Machinery to Food Processing Zones Globally
A rice polishing machine modifies the physical characteristics of rice. It is applied to rice kernels to polish or buff them. The outer surface of rice kernels is polished by rough machines called rice polishers using talc or other very fine particles. By spraying water through the mixing chamber and causing friction between the grains, either by rubbing or by utilizing milling rollers, a rice polisher machine polishes the surface of the rice. Manufacturers across the globe are focusing on mergers and acquisitions to expand their position in the field of rice polishing machines.
Satake, a leading manufacturer is mainly focusing on maintaining a strong presence in several countries through the expansion strategy. For instance, Satake announced in August 2022 that it is planning to open its new office in Manama, the Kingdom of Bahrain, to further accelerate sales.
Similarly, Satake India, in 2021, declared its plans to supply its rice milling machines to processing units that are being established in the proposed special food processing zones across Telangana at a discounted price. They also offered to establish training and round-the-clock servicing centers within these food processing zones. The milling machinery manufactured by Satake Group uses modern technology with a capacity of 21 tons per hour and the necessary power supply can be generated using the rusk, which is a byproduct of milling.
Another leading rice polishing machine manufacturer is IndiaMART InterMESH Limited. It is primarily focusing on mergers and acquisitions. For instance, in March 2022, it announced an investment of approximately Rs. 45.98 crores in Finlite Technologies for acquiring a 51.09% stake in the company. Also, in 2021, it acquired a stake in trade receivable discounting system services firm M1xchange for Rs 32.4 crore.
Attribute | Details |
---|---|
Estimated Market Size (2023) | USD 1,166.0 Million |
Projected Market Valuation (2033) | USD 1,9917 Million |
Value-based CAGR (2023 to 2033) | 5.5% |
Forecast Period | 2023 to 2033 |
Historical Data Available for | 2017 to 2021 |
Market Analysis | Value (USD Million) |
Key Countries Covered | USA, UK, China, India, Japan, South Korea, Canada, Brazil, Mexico, Argentina, Germany, Spain, Russia, Poland, Nordics, Australia, New Zealand, Thailand, Indonesia |
Key Segments Covered | Product Type, End Use, Region, Capacity, Automation |
Key Companies Profiled | SATAKE INDIA Group; FHSCHULEMuehlenbau; Pavan Group; Lianyungang Huantai Machinery; IndiaMART InterMESH Limited; SATAKE INDIA; YANMAR; Hunan Sunfield Machinery; MILLTEC Machinery Ltd.; Bühler Holding AG; Osaw Industrial Products Pvt. Ltd.; Lianyungang Huantai Machinery Co. Ltd.; SATAKE CORPORATION |
Report Coverage | Market Forecast, Company Share Analysis, Competitive Landscape, Drivers, Restraints, Opportunities and Threats Analysis, Market Dynamics and Challenges, and Strategic Growth Initiatives |
Table 1: Global Market Value (US$ Million) Forecast by Region, 2017 to 2033
Table 2: Global Market Volume (MT) Forecast by Region, 2017 to 2033
Table 3: Global Market Value (US$ Million) Forecast by Product Type, 2017 to 2033
Table 4: Global Market Volume (MT) Forecast by Product Type, 2017 to 2033
Table 5: Global Market Value (US$ Million) Forecast by End Use Application, 2017 to 2033
Table 6: Global Market Volume (MT) Forecast by End Use Application, 2017 to 2033
Table 7: Global Market Value (US$ Million) Forecast by Capacity, 2017 to 2033
Table 8: Global Market Volume (MT) Forecast by Capacity, 2017 to 2033
Table 9: Global Market Value (US$ Million) Forecast by Automation, 2017 to 2033
Table 10: Global Market Volume (MT) Forecast by Automation, 2017 to 2033
Table 11: North America Market Value (US$ Million) Forecast by Country, 2017 to 2033
Table 12: North America Market Volume (MT) Forecast by Country, 2017 to 2033
Table 13: North America Market Value (US$ Million) Forecast by Product Type, 2017 to 2033
Table 14: North America Market Volume (MT) Forecast by Product Type, 2017 to 2033
Table 15: North America Market Value (US$ Million) Forecast by End Use Application, 2017 to 2033
Table 16: North America Market Volume (MT) Forecast by End Use Application, 2017 to 2033
Table 17: North America Market Value (US$ Million) Forecast by Capacity, 2017 to 2033
Table 18: North America Market Volume (MT) Forecast by Capacity, 2017 to 2033
Table 19: North America Market Value (US$ Million) Forecast by Automation, 2017 to 2033
Table 20: North America Market Volume (MT) Forecast by Automation, 2017 to 2033
Table 21: Latin America Market Value (US$ Million) Forecast by Country, 2017 to 2033
Table 22: Latin America Market Volume (MT) Forecast by Country, 2017 to 2033
Table 23: Latin America Market Value (US$ Million) Forecast by Product Type, 2017 to 2033
Table 24: Latin America Market Volume (MT) Forecast by Product Type, 2017 to 2033
Table 25: Latin America Market Value (US$ Million) Forecast by End Use Application, 2017 to 2033
Table 26: Latin America Market Volume (MT) Forecast by End Use Application, 2017 to 2033
Table 27: Latin America Market Value (US$ Million) Forecast by Capacity, 2017 to 2033
Table 28: Latin America Market Volume (MT) Forecast by Capacity, 2017 to 2033
Table 29: Latin America Market Value (US$ Million) Forecast by Automation, 2017 to 2033
Table 30: Latin America Market Volume (MT) Forecast by Automation, 2017 to 2033
Table 31: Europe Market Value (US$ Million) Forecast by Country, 2017 to 2033
Table 32: Europe Market Volume (MT) Forecast by Country, 2017 to 2033
Table 33: Europe Market Value (US$ Million) Forecast by Product Type, 2017 to 2033
Table 34: Europe Market Volume (MT) Forecast by Product Type, 2017 to 2033
Table 35: Europe Market Value (US$ Million) Forecast by End Use Application, 2017 to 2033
Table 36: Europe Market Volume (MT) Forecast by End Use Application, 2017 to 2033
Table 37: Europe Market Value (US$ Million) Forecast by Capacity, 2017 to 2033
Table 38: Europe Market Volume (MT) Forecast by Capacity, 2017 to 2033
Table 39: Europe Market Value (US$ Million) Forecast by Automation, 2017 to 2033
Table 40: Europe Market Volume (MT) Forecast by Automation, 2017 to 2033
Table 41: East Asia Market Value (US$ Million) Forecast by Country, 2017 to 2033
Table 42: East Asia Market Volume (MT) Forecast by Country, 2017 to 2033
Table 43: East Asia Market Value (US$ Million) Forecast by Product Type, 2017 to 2033
Table 44: East Asia Market Volume (MT) Forecast by Product Type, 2017 to 2033
Table 45: East Asia Market Value (US$ Million) Forecast by End Use Application, 2017 to 2033
Table 46: East Asia Market Volume (MT) Forecast by End Use Application, 2017 to 2033
Table 47: East Asia Market Value (US$ Million) Forecast by Capacity, 2017 to 2033
Table 48: East Asia Market Volume (MT) Forecast by Capacity, 2017 to 2033
Table 49: East Asia Market Value (US$ Million) Forecast by Automation, 2017 to 2033
Table 50: East Asia Market Volume (MT) Forecast by Automation, 2017 to 2033
Table 51: South Asia Market Value (US$ Million) Forecast by Country, 2017 to 2033
Table 52: South Asia Market Volume (MT) Forecast by Country, 2017 to 2033
Table 53: South Asia Market Value (US$ Million) Forecast by Product Type, 2017 to 2033
Table 54: South Asia Market Volume (MT) Forecast by Product Type, 2017 to 2033
Table 55: South Asia Market Value (US$ Million) Forecast by End Use Application, 2017 to 2033
Table 56: South Asia Market Volume (MT) Forecast by End Use Application, 2017 to 2033
Table 57: South Asia Market Value (US$ Million) Forecast by Capacity, 2017 to 2033
Table 58: South Asia Market Volume (MT) Forecast by Capacity, 2017 to 2033
Table 59: South Asia Market Value (US$ Million) Forecast by Automation, 2017 to 2033
Table 60: South Asia Market Volume (MT) Forecast by Automation, 2017 to 2033
Table 61: Oceania Market Value (US$ Million) Forecast by Country, 2017 to 2033
Table 62: Oceania Market Volume (MT) Forecast by Country, 2017 to 2033
Table 63: Oceania Market Value (US$ Million) Forecast by Product Type, 2017 to 2033
Table 64: Oceania Market Volume (MT) Forecast by Product Type, 2017 to 2033
Table 65: Oceania Market Value (US$ Million) Forecast by End Use Application, 2017 to 2033
Table 66: Oceania Market Volume (MT) Forecast by End Use Application, 2017 to 2033
Table 67: Oceania Market Value (US$ Million) Forecast by Capacity, 2017 to 2033
Table 68: Oceania Market Volume (MT) Forecast by Capacity, 2017 to 2033
Table 69: Oceania Market Value (US$ Million) Forecast by Automation, 2017 to 2033
Table 70: Oceania Market Volume (MT) Forecast by Automation, 2017 to 2033
Table 71: MEA Market Value (US$ Million) Forecast by Country, 2017 to 2033
Table 72: MEA Market Volume (MT) Forecast by Country, 2017 to 2033
Table 73: MEA Market Value (US$ Million) Forecast by Product Type, 2017 to 2033
Table 74: MEA Market Volume (MT) Forecast by Product Type, 2017 to 2033
Table 75: MEA Market Value (US$ Million) Forecast by End Use Application, 2017 to 2033
Table 76: MEA Market Volume (MT) Forecast by End Use Application, 2017 to 2033
Table 77: MEA Market Value (US$ Million) Forecast by Capacity, 2017 to 2033
Table 78: MEA Market Volume (MT) Forecast by Capacity, 2017 to 2033
Table 79: MEA Market Value (US$ Million) Forecast by Automation, 2017 to 2033
Table 80: MEA Market Volume (MT) Forecast by Automation, 2017 to 2033
Figure 1: Global Market Value (US$ Million) by Product Type, 2023 to 2033
Figure 2: Global Market Value (US$ Million) by End Use Application, 2023 to 2033
Figure 3: Global Market Value (US$ Million) by Capacity, 2023 to 2033
Figure 4: Global Market Value (US$ Million) by Automation, 2023 to 2033
Figure 5: Global Market Value (US$ Million) by Region, 2023 to 2033
Figure 6: Global Market Value (US$ Million) Analysis by Region, 2017 to 2032
Figure 7: Global Market Volume (MT) Analysis by Region, 2017 to 2032
Figure 8: Global Market Value Share (%) and BPS Analysis by Region, 2023 to 2033
Figure 9: Global Market Y-o-Y Growth (%) Projections by Region, 2023 to 2033
Figure 10: Global Market Value (US$ Million) Analysis by Product Type, 2017 to 2032
Figure 11: Global Market Volume (MT) Analysis by Product Type, 2017 to 2032
Figure 12: Global Market Value Share (%) and BPS Analysis by Product Type, 2023 to 2033
Figure 13: Global Market Y-o-Y Growth (%) Projections by Product Type, 2023 to 2033
Figure 14: Global Market Value (US$ Million) Analysis by End Use Application, 2017 to 2032
Figure 15: Global Market Volume (MT) Analysis by End Use Application, 2017 to 2032
Figure 16: Global Market Value Share (%) and BPS Analysis by End Use Application, 2023 to 2033
Figure 17: Global Market Y-o-Y Growth (%) Projections by End Use Application, 2023 to 2033
Figure 18: Global Market Value (US$ Million) Analysis by Capacity, 2017 to 2032
Figure 19: Global Market Volume (MT) Analysis by Capacity, 2017 to 2032
Figure 20: Global Market Value Share (%) and BPS Analysis by Capacity, 2023 to 2033
Figure 21: Global Market Y-o-Y Growth (%) Projections by Capacity, 2023 to 2033
Figure 22: Global Market Value (US$ Million) Analysis by Automation, 2017 to 2032
Figure 23: Global Market Volume (MT) Analysis by Automation, 2017 to 2032
Figure 24: Global Market Value Share (%) and BPS Analysis by Automation, 2023 to 2033
Figure 25: Global Market Y-o-Y Growth (%) Projections by Automation, 2023 to 2033
Figure 26: Global Market Attractiveness by Product Type, 2023 to 2033
Figure 27: Global Market Attractiveness by End Use Application, 2023 to 2033
Figure 28: Global Market Attractiveness by Capacity, 2023 to 2033
Figure 29: Global Market Attractiveness by Automation, 2023 to 2033
Figure 30: Global Market Attractiveness by Region, 2023 to 2033
Figure 31: North America Market Value (US$ Million) by Product Type, 2023 to 2033
Figure 32: North America Market Value (US$ Million) by End Use Application, 2023 to 2033
Figure 33: North America Market Value (US$ Million) by Capacity, 2023 to 2033
Figure 34: North America Market Value (US$ Million) by Automation, 2023 to 2033
Figure 35: North America Market Value (US$ Million) by Country, 2023 to 2033
Figure 36: North America Market Value (US$ Million) Analysis by Country, 2017 to 2032
Figure 37: North America Market Volume (MT) Analysis by Country, 2017 to 2032
Figure 38: North America Market Value Share (%) and BPS Analysis by Country, 2023 to 2033
Figure 39: North America Market Y-o-Y Growth (%) Projections by Country, 2023 to 2033
Figure 40: North America Market Value (US$ Million) Analysis by Product Type, 2017 to 2032
Figure 41: North America Market Volume (MT) Analysis by Product Type, 2017 to 2032
Figure 42: North America Market Value Share (%) and BPS Analysis by Product Type, 2023 to 2033
Figure 43: North America Market Y-o-Y Growth (%) Projections by Product Type, 2023 to 2033
Figure 44: North America Market Value (US$ Million) Analysis by End Use Application, 2017 to 2032
Figure 45: North America Market Volume (MT) Analysis by End Use Application, 2017 to 2032
Figure 46: North America Market Value Share (%) and BPS Analysis by End Use Application, 2023 to 2033
Figure 47: North America Market Y-o-Y Growth (%) Projections by End Use Application, 2023 to 2033
Figure 48: North America Market Value (US$ Million) Analysis by Capacity, 2017 to 2032
Figure 49: North America Market Volume (MT) Analysis by Capacity, 2017 to 2032
Figure 50: North America Market Value Share (%) and BPS Analysis by Capacity, 2023 to 2033
Figure 51: North America Market Y-o-Y Growth (%) Projections by Capacity, 2023 to 2033
Figure 52: North America Market Value (US$ Million) Analysis by Automation, 2017 to 2032
Figure 53: North America Market Volume (MT) Analysis by Automation, 2017 to 2032
Figure 54: North America Market Value Share (%) and BPS Analysis by Automation, 2023 to 2033
Figure 55: North America Market Y-o-Y Growth (%) Projections by Automation, 2023 to 2033
Figure 56: North America Market Attractiveness by Product Type, 2023 to 2033
Figure 57: North America Market Attractiveness by End Use Application, 2023 to 2033
Figure 58: North America Market Attractiveness by Capacity, 2023 to 2033
Figure 59: North America Market Attractiveness by Automation, 2023 to 2033
Figure 60: North America Market Attractiveness by Country, 2023 to 2033
Figure 61: Latin America Market Value (US$ Million) by Product Type, 2023 to 2033
Figure 62: Latin America Market Value (US$ Million) by End Use Application, 2023 to 2033
Figure 63: Latin America Market Value (US$ Million) by Capacity, 2023 to 2033
Figure 64: Latin America Market Value (US$ Million) by Automation, 2023 to 2033
Figure 65: Latin America Market Value (US$ Million) by Country, 2023 to 2033
Figure 66: Latin America Market Value (US$ Million) Analysis by Country, 2017 to 2032
Figure 67: Latin America Market Volume (MT) Analysis by Country, 2017 to 2032
Figure 68: Latin America Market Value Share (%) and BPS Analysis by Country, 2023 to 2033
Figure 69: Latin America Market Y-o-Y Growth (%) Projections by Country, 2023 to 2033
Figure 70: Latin America Market Value (US$ Million) Analysis by Product Type, 2017 to 2032
Figure 71: Latin America Market Volume (MT) Analysis by Product Type, 2017 to 2032
Figure 72: Latin America Market Value Share (%) and BPS Analysis by Product Type, 2023 to 2033
Figure 73: Latin America Market Y-o-Y Growth (%) Projections by Product Type, 2023 to 2033
Figure 74: Latin America Market Value (US$ Million) Analysis by End Use Application, 2017 to 2032
Figure 75: Latin America Market Volume (MT) Analysis by End Use Application, 2017 to 2032
Figure 76: Latin America Market Value Share (%) and BPS Analysis by End Use Application, 2023 to 2033
Figure 77: Latin America Market Y-o-Y Growth (%) Projections by End Use Application, 2023 to 2033
Figure 78: Latin America Market Value (US$ Million) Analysis by Capacity, 2017 to 2032
Figure 79: Latin America Market Volume (MT) Analysis by Capacity, 2017 to 2032
Figure 80: Latin America Market Value Share (%) and BPS Analysis by Capacity, 2023 to 2033
Figure 81: Latin America Market Y-o-Y Growth (%) Projections by Capacity, 2023 to 2033
Figure 82: Latin America Market Value (US$ Million) Analysis by Automation, 2017 to 2032
Figure 83: Latin America Market Volume (MT) Analysis by Automation, 2017 to 2032
Figure 84: Latin America Market Value Share (%) and BPS Analysis by Automation, 2023 to 2033
Figure 85: Latin America Market Y-o-Y Growth (%) Projections by Automation, 2023 to 2033
Figure 86: Latin America Market Attractiveness by Product Type, 2023 to 2033
Figure 87: Latin America Market Attractiveness by End Use Application, 2023 to 2033
Figure 88: Latin America Market Attractiveness by Capacity, 2023 to 2033
Figure 89: Latin America Market Attractiveness by Automation, 2023 to 2033
Figure 90: Latin America Market Attractiveness by Country, 2023 to 2033
Figure 91: Europe Market Value (US$ Million) by Product Type, 2023 to 2033
Figure 92: Europe Market Value (US$ Million) by End Use Application, 2023 to 2033
Figure 93: Europe Market Value (US$ Million) by Capacity, 2023 to 2033
Figure 94: Europe Market Value (US$ Million) by Automation, 2023 to 2033
Figure 95: Europe Market Value (US$ Million) by Country, 2023 to 2033
Figure 96: Europe Market Value (US$ Million) Analysis by Country, 2017 to 2032
Figure 97: Europe Market Volume (MT) Analysis by Country, 2017 to 2032
Figure 98: Europe Market Value Share (%) and BPS Analysis by Country, 2023 to 2033
Figure 99: Europe Market Y-o-Y Growth (%) Projections by Country, 2023 to 2033
Figure 100: Europe Market Value (US$ Million) Analysis by Product Type, 2017 to 2032
Figure 101: Europe Market Volume (MT) Analysis by Product Type, 2017 to 2032
Figure 102: Europe Market Value Share (%) and BPS Analysis by Product Type, 2023 to 2033
Figure 103: Europe Market Y-o-Y Growth (%) Projections by Product Type, 2023 to 2033
Figure 104: Europe Market Value (US$ Million) Analysis by End Use Application, 2017 to 2032
Figure 105: Europe Market Volume (MT) Analysis by End Use Application, 2017 to 2032
Figure 106: Europe Market Value Share (%) and BPS Analysis by End Use Application, 2023 to 2033
Figure 107: Europe Market Y-o-Y Growth (%) Projections by End Use Application, 2023 to 2033
Figure 108: Europe Market Value (US$ Million) Analysis by Capacity, 2017 to 2032
Figure 109: Europe Market Volume (MT) Analysis by Capacity, 2017 to 2032
Figure 110: Europe Market Value Share (%) and BPS Analysis by Capacity, 2023 to 2033
Figure 111: Europe Market Y-o-Y Growth (%) Projections by Capacity, 2023 to 2033
Figure 112: Europe Market Value (US$ Million) Analysis by Automation, 2017 to 2032
Figure 113: Europe Market Volume (MT) Analysis by Automation, 2017 to 2032
Figure 114: Europe Market Value Share (%) and BPS Analysis by Automation, 2023 to 2033
Figure 115: Europe Market Y-o-Y Growth (%) Projections by Automation, 2023 to 2033
Figure 116: Europe Market Attractiveness by Product Type, 2023 to 2033
Figure 117: Europe Market Attractiveness by End Use Application, 2023 to 2033
Figure 118: Europe Market Attractiveness by Capacity, 2023 to 2033
Figure 119: Europe Market Attractiveness by Automation, 2023 to 2033
Figure 120: Europe Market Attractiveness by Country, 2023 to 2033
Figure 121: East Asia Market Value (US$ Million) by Product Type, 2023 to 2033
Figure 122: East Asia Market Value (US$ Million) by End Use Application, 2023 to 2033
Figure 123: East Asia Market Value (US$ Million) by Capacity, 2023 to 2033
Figure 124: East Asia Market Value (US$ Million) by Automation, 2023 to 2033
Figure 125: East Asia Market Value (US$ Million) by Country, 2023 to 2033
Figure 126: East Asia Market Value (US$ Million) Analysis by Country, 2017 to 2032
Figure 127: East Asia Market Volume (MT) Analysis by Country, 2017 to 2032
Figure 128: East Asia Market Value Share (%) and BPS Analysis by Country, 2023 to 2033
Figure 129: East Asia Market Y-o-Y Growth (%) Projections by Country, 2023 to 2033
Figure 130: East Asia Market Value (US$ Million) Analysis by Product Type, 2017 to 2032
Figure 131: East Asia Market Volume (MT) Analysis by Product Type, 2017 to 2032
Figure 132: East Asia Market Value Share (%) and BPS Analysis by Product Type, 2023 to 2033
Figure 133: East Asia Market Y-o-Y Growth (%) Projections by Product Type, 2023 to 2033
Figure 134: East Asia Market Value (US$ Million) Analysis by End Use Application, 2017 to 2032
Figure 135: East Asia Market Volume (MT) Analysis by End Use Application, 2017 to 2032
Figure 136: East Asia Market Value Share (%) and BPS Analysis by End Use Application, 2023 to 2033
Figure 137: East Asia Market Y-o-Y Growth (%) Projections by End Use Application, 2023 to 2033
Figure 138: East Asia Market Value (US$ Million) Analysis by Capacity, 2017 to 2032
Figure 139: East Asia Market Volume (MT) Analysis by Capacity, 2017 to 2032
Figure 140: East Asia Market Value Share (%) and BPS Analysis by Capacity, 2023 to 2033
Figure 141: East Asia Market Y-o-Y Growth (%) Projections by Capacity, 2023 to 2033
Figure 142: East Asia Market Value (US$ Million) Analysis by Automation, 2017 to 2032
Figure 143: East Asia Market Volume (MT) Analysis by Automation, 2017 to 2032
Figure 144: East Asia Market Value Share (%) and BPS Analysis by Automation, 2023 to 2033
Figure 145: East Asia Market Y-o-Y Growth (%) Projections by Automation, 2023 to 2033
Figure 146: East Asia Market Attractiveness by Product Type, 2023 to 2033
Figure 147: East Asia Market Attractiveness by End Use Application, 2023 to 2033
Figure 148: East Asia Market Attractiveness by Capacity, 2023 to 2033
Figure 149: East Asia Market Attractiveness by Automation, 2023 to 2033
Figure 150: East Asia Market Attractiveness by Country, 2023 to 2033
Figure 151: South Asia Market Value (US$ Million) by Product Type, 2023 to 2033
Figure 152: South Asia Market Value (US$ Million) by End Use Application, 2023 to 2033
Figure 153: South Asia Market Value (US$ Million) by Capacity, 2023 to 2033
Figure 154: South Asia Market Value (US$ Million) by Automation, 2023 to 2033
Figure 155: South Asia Market Value (US$ Million) by Country, 2023 to 2033
Figure 156: South Asia Market Value (US$ Million) Analysis by Country, 2017 to 2032
Figure 157: South Asia Market Volume (MT) Analysis by Country, 2017 to 2032
Figure 158: South Asia Market Value Share (%) and BPS Analysis by Country, 2023 to 2033
Figure 159: South Asia Market Y-o-Y Growth (%) Projections by Country, 2023 to 2033
Figure 160: South Asia Market Value (US$ Million) Analysis by Product Type, 2017 to 2032
Figure 161: South Asia Market Volume (MT) Analysis by Product Type, 2017 to 2032
Figure 162: South Asia Market Value Share (%) and BPS Analysis by Product Type, 2023 to 2033
Figure 163: South Asia Market Y-o-Y Growth (%) Projections by Product Type, 2023 to 2033
Figure 164: South Asia Market Value (US$ Million) Analysis by End Use Application, 2017 to 2032
Figure 165: South Asia Market Volume (MT) Analysis by End Use Application, 2017 to 2032
Figure 166: South Asia Market Value Share (%) and BPS Analysis by End Use Application, 2023 to 2033
Figure 167: South Asia Market Y-o-Y Growth (%) Projections by End Use Application, 2023 to 2033
Figure 168: South Asia Market Value (US$ Million) Analysis by Capacity, 2017 to 2032
Figure 169: South Asia Market Volume (MT) Analysis by Capacity, 2017 to 2032
Figure 170: South Asia Market Value Share (%) and BPS Analysis by Capacity, 2023 to 2033
Figure 171: South Asia Market Y-o-Y Growth (%) Projections by Capacity, 2023 to 2033
Figure 172: South Asia Market Value (US$ Million) Analysis by Automation, 2017 to 2032
Figure 173: South Asia Market Volume (MT) Analysis by Automation, 2017 to 2032
Figure 174: South Asia Market Value Share (%) and BPS Analysis by Automation, 2023 to 2033
Figure 175: South Asia Market Y-o-Y Growth (%) Projections by Automation, 2023 to 2033
Figure 176: South Asia Market Attractiveness by Product Type, 2023 to 2033
Figure 177: South Asia Market Attractiveness by End Use Application, 2023 to 2033
Figure 178: South Asia Market Attractiveness by Capacity, 2023 to 2033
Figure 179: South Asia Market Attractiveness by Automation, 2023 to 2033
Figure 180: South Asia Market Attractiveness by Country, 2023 to 2033
Figure 181: Oceania Market Value (US$ Million) by Product Type, 2023 to 2033
Figure 182: Oceania Market Value (US$ Million) by End Use Application, 2023 to 2033
Figure 183: Oceania Market Value (US$ Million) by Capacity, 2023 to 2033
Figure 184: Oceania Market Value (US$ Million) by Automation, 2023 to 2033
Figure 185: Oceania Market Value (US$ Million) by Country, 2023 to 2033
Figure 186: Oceania Market Value (US$ Million) Analysis by Country, 2017 to 2032
Figure 187: Oceania Market Volume (MT) Analysis by Country, 2017 to 2032
Figure 188: Oceania Market Value Share (%) and BPS Analysis by Country, 2023 to 2033
Figure 189: Oceania Market Y-o-Y Growth (%) Projections by Country, 2023 to 2033
Figure 190: Oceania Market Value (US$ Million) Analysis by Product Type, 2017 to 2032
Figure 191: Oceania Market Volume (MT) Analysis by Product Type, 2017 to 2032
Figure 192: Oceania Market Value Share (%) and BPS Analysis by Product Type, 2023 to 2033
Figure 193: Oceania Market Y-o-Y Growth (%) Projections by Product Type, 2023 to 2033
Figure 194: Oceania Market Value (US$ Million) Analysis by End Use Application, 2017 to 2032
Figure 195: Oceania Market Volume (MT) Analysis by End Use Application, 2017 to 2032
Figure 196: Oceania Market Value Share (%) and BPS Analysis by End Use Application, 2023 to 2033
Figure 197: Oceania Market Y-o-Y Growth (%) Projections by End Use Application, 2023 to 2033
Figure 198: Oceania Market Value (US$ Million) Analysis by Capacity, 2017 to 2032
Figure 199: Oceania Market Volume (MT) Analysis by Capacity, 2017 to 2032
Figure 200: Oceania Market Value Share (%) and BPS Analysis by Capacity, 2023 to 2033
Figure 201: Oceania Market Y-o-Y Growth (%) Projections by Capacity, 2023 to 2033
Figure 202: Oceania Market Value (US$ Million) Analysis by Automation, 2017 to 2032
Figure 203: Oceania Market Volume (MT) Analysis by Automation, 2017 to 2032
Figure 204: Oceania Market Value Share (%) and BPS Analysis by Automation, 2023 to 2033
Figure 205: Oceania Market Y-o-Y Growth (%) Projections by Automation, 2023 to 2033
Figure 206: Oceania Market Attractiveness by Product Type, 2023 to 2033
Figure 207: Oceania Market Attractiveness by End Use Application, 2023 to 2033
Figure 208: Oceania Market Attractiveness by Capacity, 2023 to 2033
Figure 209: Oceania Market Attractiveness by Automation, 2023 to 2033
Figure 210: Oceania Market Attractiveness by Country, 2023 to 2033
Figure 211: MEA Market Value (US$ Million) by Product Type, 2023 to 2033
Figure 212: MEA Market Value (US$ Million) by End Use Application, 2023 to 2033
Figure 213: MEA Market Value (US$ Million) by Capacity, 2023 to 2033
Figure 214: MEA Market Value (US$ Million) by Automation, 2023 to 2033
Figure 215: MEA Market Value (US$ Million) by Country, 2023 to 2033
Figure 216: MEA Market Value (US$ Million) Analysis by Country, 2017 to 2032
Figure 217: MEA Market Volume (MT) Analysis by Country, 2017 to 2032
Figure 218: MEA Market Value Share (%) and BPS Analysis by Country, 2023 to 2033
Figure 219: MEA Market Y-o-Y Growth (%) Projections by Country, 2023 to 2033
Figure 220: MEA Market Value (US$ Million) Analysis by Product Type, 2017 to 2032
Figure 221: MEA Market Volume (MT) Analysis by Product Type, 2017 to 2032
Figure 222: MEA Market Value Share (%) and BPS Analysis by Product Type, 2023 to 2033
Figure 223: MEA Market Y-o-Y Growth (%) Projections by Product Type, 2023 to 2033
Figure 224: MEA Market Value (US$ Million) Analysis by End Use Application, 2017 to 2032
Figure 225: MEA Market Volume (MT) Analysis by End Use Application, 2017 to 2032
Figure 226: MEA Market Value Share (%) and BPS Analysis by End Use Application, 2023 to 2033
Figure 227: MEA Market Y-o-Y Growth (%) Projections by End Use Application, 2023 to 2033
Figure 228: MEA Market Value (US$ Million) Analysis by Capacity, 2017 to 2032
Figure 229: MEA Market Volume (MT) Analysis by Capacity, 2017 to 2032
Figure 230: MEA Market Value Share (%) and BPS Analysis by Capacity, 2023 to 2033
Figure 231: MEA Market Y-o-Y Growth (%) Projections by Capacity, 2023 to 2033
Figure 232: MEA Market Value (US$ Million) Analysis by Automation, 2017 to 2032
Figure 233: MEA Market Volume (MT) Analysis by Automation, 2017 to 2032
Figure 234: MEA Market Value Share (%) and BPS Analysis by Automation, 2023 to 2033
Figure 235: MEA Market Y-o-Y Growth (%) Projections by Automation, 2023 to 2033
Figure 236: MEA Market Attractiveness by Product Type, 2023 to 2033
Figure 237: MEA Market Attractiveness by End Use Application, 2023 to 2033
Figure 238: MEA Market Attractiveness by Capacity, 2023 to 2033
Figure 239: MEA Market Attractiveness by Automation, 2023 to 2033
Figure 240: MEA Market Attractiveness by Country, 2023 to 2033
SATAKE Group, FH SCHULE Muehlenbau, Pavan Group, Lianyungang Huantai Machinery, IndiaMART InterMESH Limited, Buhler AG, SATAKE INDIA, YANMAR, Hunan Sunfield Machinery, and MILLTEC Machinery are the top players in the global rice polishing machines market.
The vertical cone type polishers segment is set to hold the largest share in the global rice polishing machines market by 2033.
The rice polishing machines market size is set to be valued at USD 1,166 Million by the end of 2023.
The rice polishing machines market is expected to rise at a CAGR of 5.5 % in the forecast period.
The North America rice polishing machines market is expected to register a 38% CAGR between 2023 and 2033.
The USA, China, Canada, and Germany are the major countries driving demand in the rice polishing machines market.
The China rice polishing machines market is projected to grow at a CAGR of around 32% over the next ten years.
The rice polishing machines market in Europe is expected to grow at 32% CAGR between 2023 and 2033.
The global rice polishing machines market is set to surpass USD 1,9917 Million by the end of 2033.
Explore Similar Insights
Thank you!
You will receive an email from our Business Development Manager. Please be sure to check your SPAM/JUNK folder too.