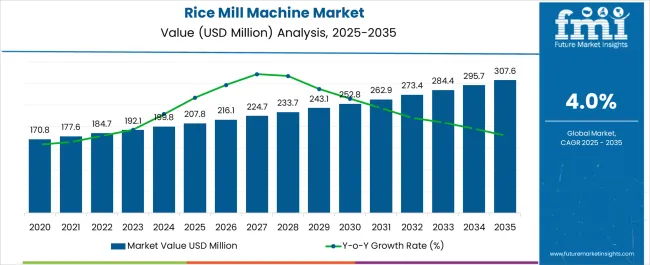
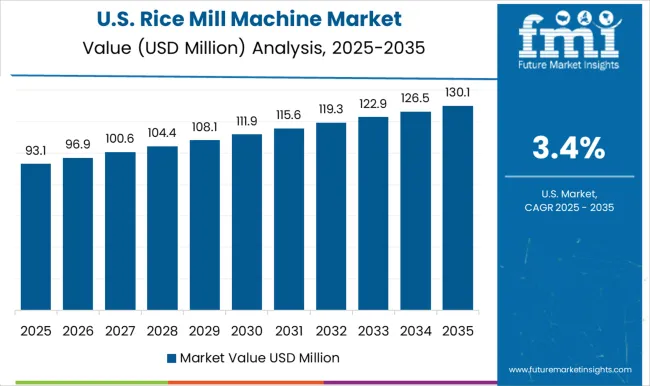
From 2023 to 2033, the global rice mill machine market is expected to grow at a slow and steady CAGR of 4.0%. The market valuation is projected to increase from USD 192.1 million in 2023 to USD 284.4 million by 2033.
According to Future Market Insights (FMI), the market is poised to be driven by the increasing demand for rice and the growing need for efficient production. Rice mill machines are used to process raw rice into white rice. They are also used to remove chaff, husk, and bran from the rice for ensuring removal of impurities.
There are mainly two different types of rice mill machines - grind and fraction-type or pressure-type. Grind machines, as their name suggests, are used to grind rice. They are known for their high-speed operation, and they are ideal in settings where high output and low rice breakage are requirements. Fraction-type or pressure machines are dependent on their iron rollers, which generate the friction needed to get white rice by milling brown rice.
Estimates suggest that rice consumption accounts for over 16% of the world’s calorie intake. Also, 3.5 billion of the world’s population are estimated to consume rice as a staple food. The number is poised to rise by around 25% by 2050. Also, 20% of the global population earns a living through rice production.
Consumption patterns are gradually altering in several countries. For instance, in Japan, Vietnam, and Indonesia, rice is an integral part of the traditional staple diet. However, younger generations across these countries are turning to other diets based on individual preferences driven by growing exposure to international cuisines. This is likely to reduce rice consumption in these countries in the coming years. However, in African countries, greater accessibility and affordability of rice are contributing to increasing rice consumption. Projections indicate that consumption of milled rice in Africa is set to reach a whopping 34.9 million tons by 2025.
In recent years, accelerating climate change has had adverse effects on rice production as harsh temperatures, floods, and draughts have wreaked havoc on crops during growing seasons. Rice production has also come under the scrutiny of climate change activists, as the activity is known for its high water consumption and CO2 emissions.
From 2023 to 2033, FMI expects rice production to increase to meet growing demand. This is likely to generate more rice mill machine sales. Additionally, FMI predicts the adoption of efficient rice mill machines to lower the carbon footprint of the rice production sector.
Attributes | Key Insights |
---|---|
Rice Mill Machine Market Estimated Size (2023E) | USD 192.1 million |
Projected Market Valuation (2033F) | USD 284.4 million |
Value-based CAGR (2023 to 2033) | 4.0% CAGR |
Between 2017 and 2022, the global rice mill machine market was estimated to register a sluggish 2.6% CAGR. So, it’s fair to say that the anticipated 4.0% CAGR from 2023 to 2033 indicates a marginal acceleration in market expansion.
The rice mill machine market is anticipated to be driven by factors such as the growing demand for rice in developing countries, the increasing use of rice as a staple food in developed countries, and the growing popularity of rice-based packaged and ready-to-eat foods.
FMI also predicts increasing adoption of automated rice mill machines. Fully automated rice mill machines deliver high output and efficiency. Manufacturers are anticipated to innovate more and more in the years ahead to deliver more energy-efficient and environment-friendly solutions.
FMI has assessed the rice mill market thoroughly to determine the factors that are likely to affect the market between 2023 and 2033. FMI’s lead analysts have taken into consideration emerging opportunities, restraints, and threats in their assessment.
The Drivers, Restraints, Opportunities, and Threats identified are as follows:
DRIVERS
RESTRAINTS
OPPORTUNITIES
THREATS
Potential natural disasters fueled by climate change such as floods and draughts are poised to threaten the expansion of the global rice mill machine market.
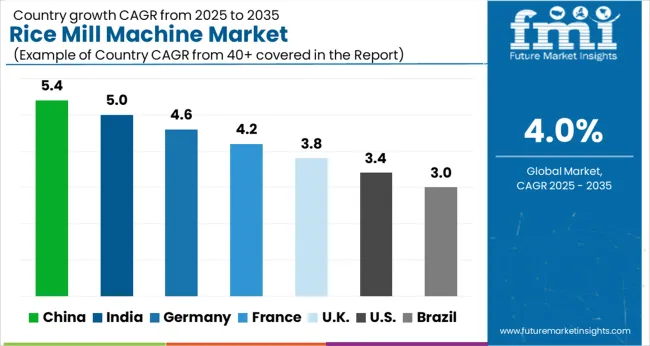
Demand for Rice Mill Machines to Decrease in the United States Due to Growing Focus on Exports
Rice milling machine sales are expected to be adversely affected in the United States In recent years, the country’s rice production has declined and this trend looks set to continue as the United States government looks to increase rise imports for meeting its consumption demands. This is resulting in decreasing demand for rice milling machines in the country.
In the coming years, FMI expects husk-removing rice mill machines to generate more sales in the United States market compared to machines that do not remove husk. Husk-removing rice mill machines have become popular in the United States owing to their ability of producing clean rice with almost no impurities.
India Rice Mill Machine Market to Register Substantial Expansion Owing To Government’s Ambitious Goals
India is the world’s second largest producer of rice, despite the forecast of declined production in the 2022/2023 market year in a Grain and Feed Update shared by the United States Department of Agriculture’s Foreign Agricultural Service (FAS). As it is also the home to big players, the country also has several small and medium-sized enterprises (SMEs) that produce rice.
In India, rice mill machine sales are expected to surge during the forecast period. According to the Central Rice Research Institute, a part of the Indian Council of Agricultural Research, India’s rice production needs to be increased to 120 million tons for feeding its population by 2030. This is poised to stimulate the country’s market for rice mill machines as all efforts are made to step up production.
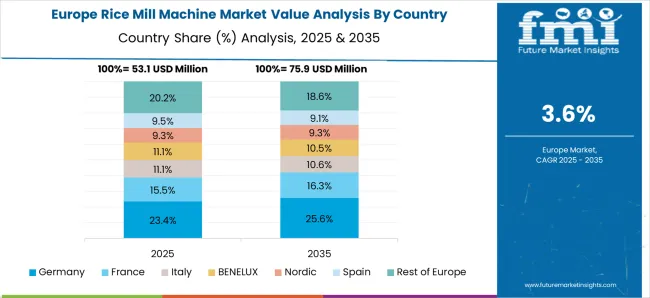
Strong Presence of Rice Mill Machine Manufacturers to Spur Market Expansion In Germany
Germany is home to renowned rice mill machine manufacturers such as Bühler GmbH and SCHULE Mühlenbau, which are known for high-quality products, competitive prices, and excellent customer service.
As the demand for automated and energy-efficient rice mill machines is anticipated to increase from 2023 to 2033, these companies are expected to be at the forefront of research and development efforts. Ultimately, their products are poised to offer solutions based on the problems being faced by the global rice production sector right now.
Economic Reforms Set to Help International Manufacturers Establish Their Presence in China
As the world’s most populous country with a burgeoning middle class, China is an obvious choice for businesses in the rice mill market looking to expand their reach. However, despite its size and economic growth, China has been notoriously difficult for foreign companies to crack. That’s starting to change, however, as the Chinese government has been making gradual reforms to open up the economy.
These reforms, combined with China’s growing appetite for luxury goods and services, have made it an increasingly attractive market for businesses across a range of industries.
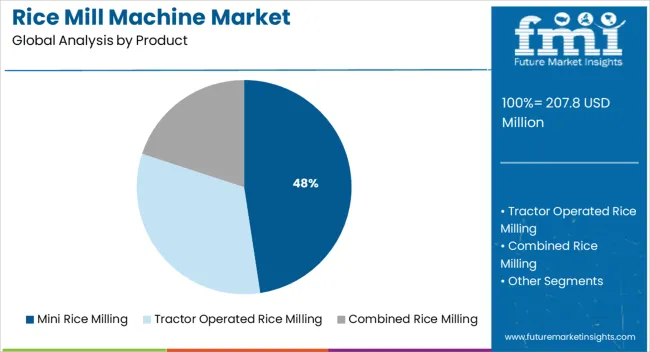
Mini Rice Mill Machines to Gain Traction Due to their Cost-Effectiveness
A mini rice mill machine is a small machine that can be used to process rice. It is usually operated by one or two people. The mini rice mill machine is easy to use and more affordable than their industrial-sized counterparts.
For small and medium-sized manufacturers, investing in mini rice mill machines makes more sense from a financial standpoint compared to investing in industrial-sized machines. FMI expects sales of mini rice mill machines to grow, particularly in developing economies.
Ease of Comparison and Discount Prices to Fuel Online Sales of Rice Mill Machines
Online sales channels have made it easier than ever before for people to purchase rice mill machines. They offer a wide variety of products and allow customers to compare prices and find the best deals quickly.
Several manufacturers have started selling their products exclusively through online channels in recent years. This trend is likely to continue as the penetration of online sales channels is expected to increase in the years ahead.
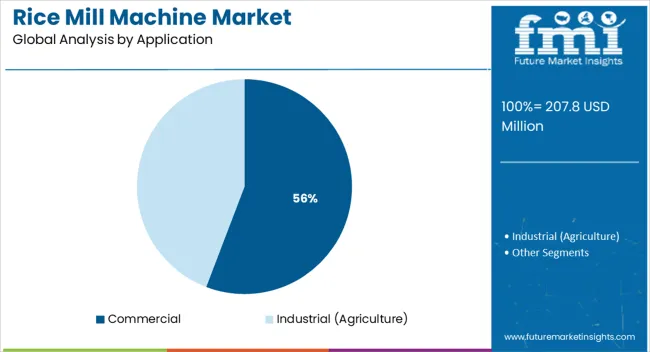
Use of Rice Mill Machines in Agriculture to Fuel Due to Rising Demand For Impurity-Free Rice
Rice is one of the most important crops in the world, and rice milling is a vital part of the rice production process. The rice mill machine is an essential piece of equipment in the rice production process, as it helps to remove the husks and bran from the rice grain.
Every rice mill machine consists of a pair of rotating abrasive discs that shear and grind the rice grain. The top disc rotates clockwise, while the bottom disc rotates counter clockwise. The two discs are separated by a small gap, through which the husk and bran are removed from the grain. The abrasive action of the discs removes the husk and bran from the grain, while leaving the edible portion of the rice intact. The husk and bran are then discharged from the machine through a chute.
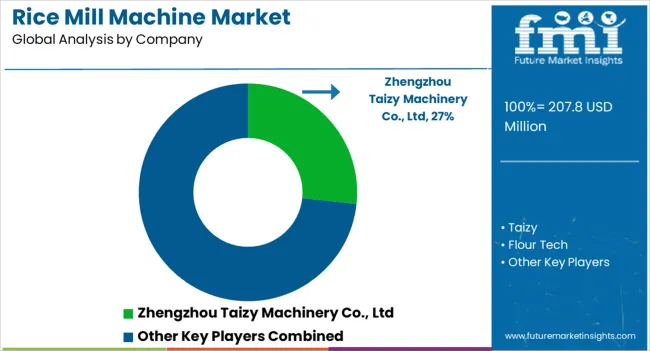
Zhengzhou Taizy Machinery Co., Ltd, Taizy, FlourTech Engineers Pvt Ltd, Rising Industries, Mill Master Machinery Private Limited, Satake, Alvan Blanch Development Company, and Savco Sales are among the key players in the global rice mill market right now. Between 2023 and 2033, these players are predicted to increase investments in research and development for technological advancements. Additionally, they are anticipated to increase their global presence by opening branches in emerging markets.
For instance,
Attributes | Details |
---|---|
Value-based CAGR (2023 to 2033) | 4% |
Forecast Period | 2023 to 2033 |
Historical Data Available for | 2017 to 2022 |
Market Analysis | Value (USD million) |
Key Regions Covered | North America; Latin America; Europe; Asia Pacific; Oceania; Middle East and Africa |
Key Countries Covered | United States, Canada, Mexico, Germany, United Kingdom, France, Italy, Spain, China, Japan, India, South Korea, Australia, Brazil, Argentina, South Africa, UAE |
Key Segments Covered | Product Type, Mode of Operation, Motor power, Application, Region |
Key Companies Profiled | Zhengzhou Taizy Machinery Co., Ltd; Taizy; Flour Tech; Rising Industries; Mill Master Machinery Private Limited; SATAKE; Alvan Blanch Development Company; Savco Sales |
Report Coverage | Market Forecast, Company Share Analysis, Competitive Landscape, Drivers, Restraints, Opportunities and Threats Analysis, Market Dynamics and Challenges, and Strategic Growth Initiatives |
Table 1: Global Value (US$ million) Forecast by Region, 2017 to 2033
Table 2: Global Volume (MT) Forecast by Region, 2017 to 2033
Table 3: Global Value (US$ million) Forecast by Product Type, 2017 to 2033
Table 4: Global Volume (MT) Forecast by Product Type, 2017 to 2033
Table 5: Global Value (US$ million) Forecast by Application, 2017 to 2033
Table 6: Global Volume (MT) Forecast by Application, 2017 to 2033
Table 7: Global Value (US$ million) Forecast by Mode of operation, 2017 to 2033
Table 8: Global Volume (MT) Forecast by Mode of operation, 2017 to 2033
Table 9: Global Value (US$ million) Forecast by Motor Power, 2017 to 2033
Table 10: Global Volume (MT) Forecast by Motor Power, 2017 to 2033
Table 11: North America Value (US$ million) Forecast by Country, 2017 to 2033
Table 12: North America Volume (MT) Forecast by Country, 2017 to 2033
Table 13: North America Value (US$ million) Forecast by Product Type, 2017 to 2033
Table 14: North America Volume (MT) Forecast by Product Type, 2017 to 2033
Table 15: North America Value (US$ million) Forecast by Application, 2017 to 2033
Table 16: North America Volume (MT) Forecast by Application, 2017 to 2033
Table 17: North America Value (US$ million) Forecast by Mode of operation, 2017 to 2033
Table 18: North America Volume (MT) Forecast by Mode of operation, 2017 to 2033
Table 19: North America Value (US$ million) Forecast by Motor Power, 2017 to 2033
Table 20: North America Volume (MT) Forecast by Motor Power, 2017 to 2033
Table 21: Latin America Value (US$ million) Forecast by Country, 2017 to 2033
Table 22: Latin America Volume (MT) Forecast by Country, 2017 to 2033
Table 23: Latin America Value (US$ million) Forecast by Product Type, 2017 to 2033
Table 24: Latin America Volume (MT) Forecast by Product Type, 2017 to 2033
Table 25: Latin America Value (US$ million) Forecast by Application, 2017 to 2033
Table 26: Latin America Volume (MT) Forecast by Application, 2017 to 2033
Table 27: Latin America Value (US$ million) Forecast by Mode of operation, 2017 to 2033
Table 28: Latin America Volume (MT) Forecast by Mode of operation, 2017 to 2033
Table 29: Latin America Value (US$ million) Forecast by Motor Power, 2017 to 2033
Table 30: Latin America Volume (MT) Forecast by Motor Power, 2017 to 2033
Table 31: Europe Value (US$ million) Forecast by Country, 2017 to 2033
Table 32: Europe Volume (MT) Forecast by Country, 2017 to 2033
Table 33: Europe Value (US$ million) Forecast by Product Type, 2017 to 2033
Table 34: Europe Volume (MT) Forecast by Product Type, 2017 to 2033
Table 35: Europe Value (US$ million) Forecast by Application, 2017 to 2033
Table 36: Europe Volume (MT) Forecast by Application, 2017 to 2033
Table 37: Europe Value (US$ million) Forecast by Mode of operation, 2017 to 2033
Table 38: Europe Volume (MT) Forecast by Mode of operation, 2017 to 2033
Table 39: Europe Value (US$ million) Forecast by Motor Power, 2017 to 2033
Table 40: Europe Volume (MT) Forecast by Motor Power, 2017 to 2033
Table 41: East Asia Value (US$ million) Forecast by Country, 2017 to 2033
Table 42: East Asia Volume (MT) Forecast by Country, 2017 to 2033
Table 43: East Asia Value (US$ million) Forecast by Product Type, 2017 to 2033
Table 44: East Asia Volume (MT) Forecast by Product Type, 2017 to 2033
Table 45: East Asia Value (US$ million) Forecast by Application, 2017 to 2033
Table 46: East Asia Volume (MT) Forecast by Application, 2017 to 2033
Table 47: East Asia Value (US$ million) Forecast by Mode of operation, 2017 to 2033
Table 48: East Asia Volume (MT) Forecast by Mode of operation, 2017 to 2033
Table 49: East Asia Value (US$ million) Forecast by Motor Power, 2017 to 2033
Table 50: East Asia Volume (MT) Forecast by Motor Power, 2017 to 2033
Table 51: South Asia Value (US$ million) Forecast by Country, 2017 to 2033
Table 52: South Asia Volume (MT) Forecast by Country, 2017 to 2033
Table 53: South Asia Value (US$ million) Forecast by Product Type, 2017 to 2033
Table 54: South Asia Volume (MT) Forecast by Product Type, 2017 to 2033
Table 55: South Asia Value (US$ million) Forecast by Application, 2017 to 2033
Table 56: South Asia Volume (MT) Forecast by Application, 2017 to 2033
Table 57: South Asia Value (US$ million) Forecast by Mode of operation, 2017 to 2033
Table 58: South Asia Volume (MT) Forecast by Mode of operation, 2017 to 2033
Table 59: South Asia Value (US$ million) Forecast by Motor Power, 2017 to 2033
Table 60: South Asia Volume (MT) Forecast by Motor Power, 2017 to 2033
Table 61: Oceania Value (US$ million) Forecast by Country, 2017 to 2033
Table 62: Oceania Volume (MT) Forecast by Country, 2017 to 2033
Table 63: Oceania Value (US$ million) Forecast by Product Type, 2017 to 2033
Table 64: Oceania Volume (MT) Forecast by Product Type, 2017 to 2033
Table 65: Oceania Value (US$ million) Forecast by Application, 2017 to 2033
Table 66: Oceania Volume (MT) Forecast by Application, 2017 to 2033
Table 67: Oceania Value (US$ million) Forecast by Mode of operation, 2017 to 2033
Table 68: Oceania Volume (MT) Forecast by Mode of operation, 2017 to 2033
Table 69: Oceania Value (US$ million) Forecast by Motor Power, 2017 to 2033
Table 70: Oceania Volume (MT) Forecast by Motor Power, 2017 to 2033
Table 71: Middle East & Africa Value (US$ million) Forecast by Country, 2017 to 2033
Table 72: Middle East & Africa Volume (MT) Forecast by Country, 2017 to 2033
Table 73: Middle East & Africa Value (US$ million) Forecast by Product Type, 2017 to 2033
Table 74: Middle East & Africa Volume (MT) Forecast by Product Type, 2017 to 2033
Table 75: Middle East & Africa Value (US$ million) Forecast by Application, 2017 to 2033
Table 76: Middle East & Africa Volume (MT) Forecast by Application, 2017 to 2033
Table 77: Middle East & Africa Value (US$ million) Forecast by Mode of operation, 2017 to 2033
Table 78: Middle East & Africa Volume (MT) Forecast by Mode of operation, 2017 to 2033
Table 79: Middle East & Africa Value (US$ million) Forecast by Motor Power, 2017 to 2033
Table 80: Middle East & Africa Volume (MT) Forecast by Motor Power, 2017 to 2033
Figure 1: Global Value (US$ million) by Product Type, 2023 to 2033
Figure 2: Global Value (US$ million) by Application, 2023 to 2033
Figure 3: Global Value (US$ million) by Mode of operation, 2023 to 2033
Figure 4: Global Value (US$ million) by Motor Power, 2023 to 2033
Figure 5: Global Value (US$ million) by Region, 2023 to 2033
Figure 6: Global Value (US$ million) Analysis by Region, 2017 to 2033
Figure 7: Global Volume (MT) Analysis by Region, 2017 to 2033
Figure 8: Global Value Share (%) and BPS Analysis by Region, 2023 to 2033
Figure 9: Global Y-o-Y Growth (%) Projections by Region, 2023 to 2033
Figure 10: Global Value (US$ million) Analysis by Product Type, 2017 to 2033
Figure 11: Global Volume (MT) Analysis by Product Type, 2017 to 2033
Figure 12: Global Value Share (%) and BPS Analysis by Product Type, 2023 to 2033
Figure 13: Global Y-o-Y Growth (%) Projections by Product Type, 2023 to 2033
Figure 14: Global Value (US$ million) Analysis by Application, 2017 to 2033
Figure 15: Global Volume (MT) Analysis by Application, 2017 to 2033
Figure 16: Global Value Share (%) and BPS Analysis by Application, 2023 to 2033
Figure 17: Global Y-o-Y Growth (%) Projections by Application, 2023 to 2033
Figure 18: Global Value (US$ million) Analysis by Mode of operation, 2017 to 2033
Figure 19: Global Volume (MT) Analysis by Mode of operation, 2017 to 2033
Figure 20: Global Value Share (%) and BPS Analysis by Mode of operation, 2023 to 2033
Figure 21: Global Y-o-Y Growth (%) Projections by Mode of operation, 2023 to 2033
Figure 22: Global Value (US$ million) Analysis by Motor Power, 2017 to 2033
Figure 23: Global Volume (MT) Analysis by Motor Power, 2017 to 2033
Figure 24: Global Value Share (%) and BPS Analysis by Motor Power, 2023 to 2033
Figure 25: Global Y-o-Y Growth (%) Projections by Motor Power, 2023 to 2033
Figure 26: Global Attractiveness by Product Type, 2023 to 2033
Figure 27: Global Attractiveness by Application, 2023 to 2033
Figure 28: Global Attractiveness by Mode of operation, 2023 to 2033
Figure 29: Global Attractiveness by Motor Power, 2023 to 2033
Figure 30: Global Attractiveness by Region, 2023 to 2033
Figure 31: North America Value (US$ million) by Product Type, 2023 to 2033
Figure 32: North America Value (US$ million) by Application, 2023 to 2033
Figure 33: North America Value (US$ million) by Mode of operation, 2023 to 2033
Figure 34: North America Value (US$ million) by Motor Power, 2023 to 2033
Figure 35: North America Value (US$ million) by Country, 2023 to 2033
Figure 36: North America Value (US$ million) Analysis by Country, 2017 to 2033
Figure 37: North America Volume (MT) Analysis by Country, 2017 to 2033
Figure 38: North America Value Share (%) and BPS Analysis by Country, 2023 to 2033
Figure 39: North America Y-o-Y Growth (%) Projections by Country, 2023 to 2033
Figure 40: North America Value (US$ million) Analysis by Product Type, 2017 to 2033
Figure 41: North America Volume (MT) Analysis by Product Type, 2017 to 2033
Figure 42: North America Value Share (%) and BPS Analysis by Product Type, 2023 to 2033
Figure 43: North America Y-o-Y Growth (%) Projections by Product Type, 2023 to 2033
Figure 44: North America Value (US$ million) Analysis by Application, 2017 to 2033
Figure 45: North America Volume (MT) Analysis by Application, 2017 to 2033
Figure 46: North America Value Share (%) and BPS Analysis by Application, 2023 to 2033
Figure 47: North America Y-o-Y Growth (%) Projections by Application, 2023 to 2033
Figure 48: North America Value (US$ million) Analysis by Mode of operation, 2017 to 2033
Figure 49: North America Volume (MT) Analysis by Mode of operation, 2017 to 2033
Figure 50: North America Value Share (%) and BPS Analysis by Mode of operation, 2023 to 2033
Figure 51: North America Y-o-Y Growth (%) Projections by Mode of operation, 2023 to 2033
Figure 52: North America Value (US$ million) Analysis by Motor Power, 2017 to 2033
Figure 53: North America Volume (MT) Analysis by Motor Power, 2017 to 2033
Figure 54: North America Value Share (%) and BPS Analysis by Motor Power, 2023 to 2033
Figure 55: North America Y-o-Y Growth (%) Projections by Motor Power, 2023 to 2033
Figure 56: North America Attractiveness by Product Type, 2023 to 2033
Figure 57: North America Attractiveness by Application, 2023 to 2033
Figure 58: North America Attractiveness by Mode of operation, 2023 to 2033
Figure 59: North America Attractiveness by Motor Power, 2023 to 2033
Figure 60: North America Attractiveness by Country, 2023 to 2033
Figure 61: Latin America Value (US$ million) by Product Type, 2023 to 2033
Figure 62: Latin America Value (US$ million) by Application, 2023 to 2033
Figure 63: Latin America Value (US$ million) by Mode of operation, 2023 to 2033
Figure 64: Latin America Value (US$ million) by Motor Power, 2023 to 2033
Figure 65: Latin America Value (US$ million) by Country, 2023 to 2033
Figure 66: Latin America Value (US$ million) Analysis by Country, 2017 to 2033
Figure 67: Latin America Volume (MT) Analysis by Country, 2017 to 2033
Figure 68: Latin America Value Share (%) and BPS Analysis by Country, 2023 to 2033
Figure 69: Latin America Y-o-Y Growth (%) Projections by Country, 2023 to 2033
Figure 70: Latin America Value (US$ million) Analysis by Product Type, 2017 to 2033
Figure 71: Latin America Volume (MT) Analysis by Product Type, 2017 to 2033
Figure 72: Latin America Value Share (%) and BPS Analysis by Product Type, 2023 to 2033
Figure 73: Latin America Y-o-Y Growth (%) Projections by Product Type, 2023 to 2033
Figure 74: Latin America Value (US$ million) Analysis by Application, 2017 to 2033
Figure 75: Latin America Volume (MT) Analysis by Application, 2017 to 2033
Figure 76: Latin America Value Share (%) and BPS Analysis by Application, 2023 to 2033
Figure 77: Latin America Y-o-Y Growth (%) Projections by Application, 2023 to 2033
Figure 78: Latin America Value (US$ million) Analysis by Mode of operation, 2017 to 2033
Figure 79: Latin America Volume (MT) Analysis by Mode of operation, 2017 to 2033
Figure 80: Latin America Value Share (%) and BPS Analysis by Mode of operation, 2023 to 2033
Figure 81: Latin America Y-o-Y Growth (%) Projections by Mode of operation, 2023 to 2033
Figure 82: Latin America Value (US$ million) Analysis by Motor Power, 2017 to 2033
Figure 83: Latin America Volume (MT) Analysis by Motor Power, 2017 to 2033
Figure 84: Latin America Value Share (%) and BPS Analysis by Motor Power, 2023 to 2033
Figure 85: Latin America Y-o-Y Growth (%) Projections by Motor Power, 2023 to 2033
Figure 86: Latin America Attractiveness by Product Type, 2023 to 2033
Figure 87: Latin America Attractiveness by Application, 2023 to 2033
Figure 88: Latin America Attractiveness by Mode of operation, 2023 to 2033
Figure 89: Latin America Attractiveness by Motor Power, 2023 to 2033
Figure 90: Latin America Attractiveness by Country, 2023 to 2033
Figure 91: Europe Value (US$ million) by Product Type, 2023 to 2033
Figure 92: Europe Value (US$ million) by Application, 2023 to 2033
Figure 93: Europe Value (US$ million) by Mode of operation, 2023 to 2033
Figure 94: Europe Value (US$ million) by Motor Power, 2023 to 2033
Figure 95: Europe Value (US$ million) by Country, 2023 to 2033
Figure 96: Europe Value (US$ million) Analysis by Country, 2017 to 2033
Figure 97: Europe Volume (MT) Analysis by Country, 2017 to 2033
Figure 98: Europe Value Share (%) and BPS Analysis by Country, 2023 to 2033
Figure 99: Europe Y-o-Y Growth (%) Projections by Country, 2023 to 2033
Figure 100: Europe Value (US$ million) Analysis by Product Type, 2017 to 2033
Figure 101: Europe Volume (MT) Analysis by Product Type, 2017 to 2033
Figure 102: Europe Value Share (%) and BPS Analysis by Product Type, 2023 to 2033
Figure 103: Europe Y-o-Y Growth (%) Projections by Product Type, 2023 to 2033
Figure 104: Europe Value (US$ million) Analysis by Application, 2017 to 2033
Figure 105: Europe Volume (MT) Analysis by Application, 2017 to 2033
Figure 106: Europe Value Share (%) and BPS Analysis by Application, 2023 to 2033
Figure 107: Europe Y-o-Y Growth (%) Projections by Application, 2023 to 2033
Figure 108: Europe Value (US$ million) Analysis by Mode of operation, 2017 to 2033
Figure 109: Europe Volume (MT) Analysis by Mode of operation, 2017 to 2033
Figure 110: Europe Value Share (%) and BPS Analysis by Mode of operation, 2023 to 2033
Figure 111: Europe Y-o-Y Growth (%) Projections by Mode of operation, 2023 to 2033
Figure 112: Europe Value (US$ million) Analysis by Motor Power, 2017 to 2033
Figure 113: Europe Volume (MT) Analysis by Motor Power, 2017 to 2033
Figure 114: Europe Value Share (%) and BPS Analysis by Motor Power, 2023 to 2033
Figure 115: Europe Y-o-Y Growth (%) Projections by Motor Power, 2023 to 2033
Figure 116: Europe Attractiveness by Product Type, 2023 to 2033
Figure 117: Europe Attractiveness by Application, 2023 to 2033
Figure 118: Europe Attractiveness by Mode of operation, 2023 to 2033
Figure 119: Europe Attractiveness by Motor Power, 2023 to 2033
Figure 120: Europe Attractiveness by Country, 2023 to 2033
Figure 121: East Asia Value (US$ million) by Product Type, 2023 to 2033
Figure 122: East Asia Value (US$ million) by Application, 2023 to 2033
Figure 123: East Asia Value (US$ million) by Mode of operation, 2023 to 2033
Figure 124: East Asia Value (US$ million) by Motor Power, 2023 to 2033
Figure 125: East Asia Value (US$ million) by Country, 2023 to 2033
Figure 126: East Asia Value (US$ million) Analysis by Country, 2017 to 2033
Figure 127: East Asia Volume (MT) Analysis by Country, 2017 to 2033
Figure 128: East Asia Value Share (%) and BPS Analysis by Country, 2023 to 2033
Figure 129: East Asia Y-o-Y Growth (%) Projections by Country, 2023 to 2033
Figure 130: East Asia Value (US$ million) Analysis by Product Type, 2017 to 2033
Figure 131: East Asia Volume (MT) Analysis by Product Type, 2017 to 2033
Figure 132: East Asia Value Share (%) and BPS Analysis by Product Type, 2023 to 2033
Figure 133: East Asia Y-o-Y Growth (%) Projections by Product Type, 2023 to 2033
Figure 134: East Asia Value (US$ million) Analysis by Application, 2017 to 2033
Figure 135: East Asia Volume (MT) Analysis by Application, 2017 to 2033
Figure 136: East Asia Value Share (%) and BPS Analysis by Application, 2023 to 2033
Figure 137: East Asia Y-o-Y Growth (%) Projections by Application, 2023 to 2033
Figure 138: East Asia Value (US$ million) Analysis by Mode of operation, 2017 to 2033
Figure 139: East Asia Volume (MT) Analysis by Mode of operation, 2017 to 2033
Figure 140: East Asia Value Share (%) and BPS Analysis by Mode of operation, 2023 to 2033
Figure 141: East Asia Y-o-Y Growth (%) Projections by Mode of operation, 2023 to 2033
Figure 142: East Asia Value (US$ million) Analysis by Motor Power, 2017 to 2033
Figure 143: East Asia Volume (MT) Analysis by Motor Power, 2017 to 2033
Figure 144: East Asia Value Share (%) and BPS Analysis by Motor Power, 2023 to 2033
Figure 145: East Asia Y-o-Y Growth (%) Projections by Motor Power, 2023 to 2033
Figure 146: East Asia Attractiveness by Product Type, 2023 to 2033
Figure 147: East Asia Attractiveness by Application, 2023 to 2033
Figure 148: East Asia Attractiveness by Mode of operation, 2023 to 2033
Figure 149: East Asia Attractiveness by Motor Power, 2023 to 2033
Figure 150: East Asia Attractiveness by Country, 2023 to 2033
Figure 151: South Asia Value (US$ million) by Product Type, 2023 to 2033
Figure 152: South Asia Value (US$ million) by Application, 2023 to 2033
Figure 153: South Asia Value (US$ million) by Mode of operation, 2023 to 2033
Figure 154: South Asia Value (US$ million) by Motor Power, 2023 to 2033
Figure 155: South Asia Value (US$ million) by Country, 2023 to 2033
Figure 156: South Asia Value (US$ million) Analysis by Country, 2017 to 2033
Figure 157: South Asia Volume (MT) Analysis by Country, 2017 to 2033
Figure 158: South Asia Value Share (%) and BPS Analysis by Country, 2023 to 2033
Figure 159: South Asia Y-o-Y Growth (%) Projections by Country, 2023 to 2033
Figure 160: South Asia Value (US$ million) Analysis by Product Type, 2017 to 2033
Figure 161: South Asia Volume (MT) Analysis by Product Type, 2017 to 2033
Figure 162: South Asia Value Share (%) and BPS Analysis by Product Type, 2023 to 2033
Figure 163: South Asia Y-o-Y Growth (%) Projections by Product Type, 2023 to 2033
Figure 164: South Asia Value (US$ million) Analysis by Application, 2017 to 2033
Figure 165: South Asia Volume (MT) Analysis by Application, 2017 to 2033
Figure 166: South Asia Value Share (%) and BPS Analysis by Application, 2023 to 2033
Figure 167: South Asia Y-o-Y Growth (%) Projections by Application, 2023 to 2033
Figure 168: South Asia Value (US$ million) Analysis by Mode of operation, 2017 to 2033
Figure 169: South Asia Volume (MT) Analysis by Mode of operation, 2017 to 2033
Figure 170: South Asia Value Share (%) and BPS Analysis by Mode of operation, 2023 to 2033
Figure 171: South Asia Y-o-Y Growth (%) Projections by Mode of operation, 2023 to 2033
Figure 172: South Asia Value (US$ million) Analysis by Motor Power, 2017 to 2033
Figure 173: South Asia Volume (MT) Analysis by Motor Power, 2017 to 2033
Figure 174: South Asia Value Share (%) and BPS Analysis by Motor Power, 2023 to 2033
Figure 175: South Asia Y-o-Y Growth (%) Projections by Motor Power, 2023 to 2033
Figure 176: South Asia Attractiveness by Product Type, 2023 to 2033
Figure 177: South Asia Attractiveness by Application, 2023 to 2033
Figure 178: South Asia Attractiveness by Mode of operation, 2023 to 2033
Figure 179: South Asia Attractiveness by Motor Power, 2023 to 2033
Figure 180: South Asia Attractiveness by Country, 2023 to 2033
Figure 181: Oceania Value (US$ million) by Product Type, 2023 to 2033
Figure 182: Oceania Value (US$ million) by Application, 2023 to 2033
Figure 183: Oceania Value (US$ million) by Mode of operation, 2023 to 2033
Figure 184: Oceania Value (US$ million) by Motor Power, 2023 to 2033
Figure 185: Oceania Value (US$ million) by Country, 2023 to 2033
Figure 186: Oceania Value (US$ million) Analysis by Country, 2017 to 2033
Figure 187: Oceania Volume (MT) Analysis by Country, 2017 to 2033
Figure 188: Oceania Value Share (%) and BPS Analysis by Country, 2023 to 2033
Figure 189: Oceania Y-o-Y Growth (%) Projections by Country, 2023 to 2033
Figure 190: Oceania Value (US$ million) Analysis by Product Type, 2017 to 2033
Figure 191: Oceania Volume (MT) Analysis by Product Type, 2017 to 2033
Figure 192: Oceania Value Share (%) and BPS Analysis by Product Type, 2023 to 2033
Figure 193: Oceania Y-o-Y Growth (%) Projections by Product Type, 2023 to 2033
Figure 194: Oceania Value (US$ million) Analysis by Application, 2017 to 2033
Figure 195: Oceania Volume (MT) Analysis by Application, 2017 to 2033
Figure 196: Oceania Value Share (%) and BPS Analysis by Application, 2023 to 2033
Figure 197: Oceania Y-o-Y Growth (%) Projections by Application, 2023 to 2033
Figure 198: Oceania Value (US$ million) Analysis by Mode of operation, 2017 to 2033
Figure 199: Oceania Volume (MT) Analysis by Mode of operation, 2017 to 2033
Figure 200: Oceania Value Share (%) and BPS Analysis by Mode of operation, 2023 to 2033
Figure 201: Oceania Y-o-Y Growth (%) Projections by Mode of operation, 2023 to 2033
Figure 202: Oceania Value (US$ million) Analysis by Motor Power, 2017 to 2033
Figure 203: Oceania Volume (MT) Analysis by Motor Power, 2017 to 2033
Figure 204: Oceania Value Share (%) and BPS Analysis by Motor Power, 2023 to 2033
Figure 205: Oceania Y-o-Y Growth (%) Projections by Motor Power, 2023 to 2033
Figure 206: Oceania Attractiveness by Product Type, 2023 to 2033
Figure 207: Oceania Attractiveness by Application, 2023 to 2033
Figure 208: Oceania Attractiveness by Mode of operation, 2023 to 2033
Figure 209: Oceania Attractiveness by Motor Power, 2023 to 2033
Figure 210: Oceania Attractiveness by Country, 2023 to 2033
Figure 211: MEA Value (US$ million) by Product Type, 2023 to 2033
Figure 212: MEA Value (US$ million) by Application, 2023 to 2033
Figure 213: MEA Value (US$ million) by Mode of operation, 2023 to 2033
Figure 214: MEA Value (US$ million) by Motor Power, 2023 to 2033
Figure 215: MEA Value (US$ million) by Country, 2023 to 2033
Figure 216: MEA Value (US$ million) Analysis by Country, 2017 to 2033
Figure 217: MEA Volume (MT) Analysis by Country, 2017 to 2033
Figure 218: MEA Value Share (%) and BPS Analysis by Country, 2023 to 2033
Figure 219: MEA Y-o-Y Growth (%) Projections by Country, 2023 to 2033
Figure 220: MEA Value (US$ million) Analysis by Product Type, 2017 to 2033
Figure 221: MEA Volume (MT) Analysis by Product Type, 2017 to 2033
Figure 222: MEA Value Share (%) and BPS Analysis by Product Type, 2023 to 2033
Figure 223: MEA Y-o-Y Growth (%) Projections by Product Type, 2023 to 2033
Figure 224: MEA Value (US$ million) Analysis by Application, 2017 to 2033
Figure 225: MEA Volume (MT) Analysis by Application, 2017 to 2033
Figure 226: MEA Value Share (%) and BPS Analysis by Application, 2023 to 2033
Figure 227: MEA Y-o-Y Growth (%) Projections by Application, 2023 to 2033
Figure 228: MEA Value (US$ million) Analysis by Mode of operation, 2017 to 2033
Figure 229: MEA Volume (MT) Analysis by Mode of operation, 2017 to 2033
Figure 230: MEA Value Share (%) and BPS Analysis by Mode of operation, 2023 to 2033
Figure 231: MEA Y-o-Y Growth (%) Projections by Mode of operation, 2023 to 2033
Figure 232: MEA Value (US$ million) Analysis by Motor Power, 2017 to 2033
Figure 233: MEA Volume (MT) Analysis by Motor Power, 2017 to 2033
Figure 234: MEA Value Share (%) and BPS Analysis by Motor Power, 2023 to 2033
Figure 235: MEA Y-o-Y Growth (%) Projections by Motor Power, 2023 to 2033
Figure 236: MEA Attractiveness by Product Type, 2023 to 2033
Figure 237: MEA Attractiveness by Application, 2023 to 2033
Figure 238: MEA Attractiveness by Mode of operation, 2023 to 2033
Figure 239: MEA Attractiveness by Motor Power, 2023 to 2033
Figure 240: MEA Attractiveness by Country, 2023 to 2033
The rice mill machine market industry is assessed to be valued at USD 192.1 million in 2023.
The market for rice mill machines is expected to rise at a CAGR of 4.0% from 2023 to 2033.
North America market for rice mill machines is expected to register 38% CAGR between 2023 and 2033.
China, India, and Germany are expected to be the leading countries driving demand for rice mill machines.
China market for rice mill machines is projected to grow at a CAGR of 5.7% from 2023 to 2033.
The United Kingdom. market for rice mill machines is projected to grow at a CAGR of 5.3% between 2023 and 2033.
India market for rice mill machines is projected to grow at a CAGR of 6.3% over the next ten years.
The demand for rice mill machines in the United States is expected to grow at 32.7% in 2023.
The demand for rice mill machines in Japan is expected to grow at 8.0% in 2023.
The demand for rice mill machines in Australia is expected to grow at 2.7% in 2023.
The global market for rice mill machines is anticipated to surpass USD 284.4 million by the end of 2033.
Explore Similar Insights
Thank you!
You will receive an email from our Business Development Manager. Please be sure to check your SPAM/JUNK folder too.