Fortified Milk and Milk Products Market Size and Share Outlook 2025 to 2035

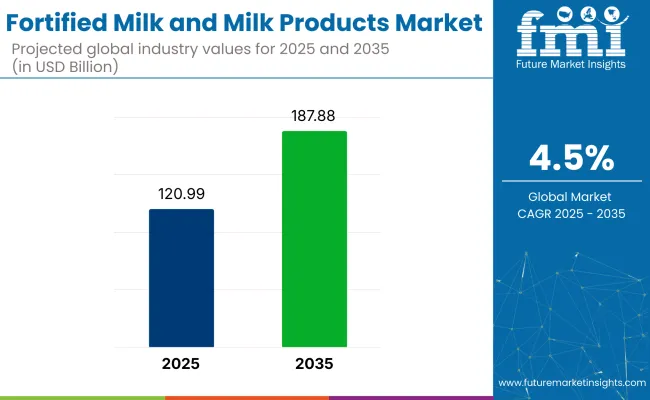
The global fortified milk and milk products market is estimated to reach a valuation of USD 120.99 billion in 2025 and is forecast to expand to USD 187.88 billion by 2035. This growth reflects a compound annual growth rate (CAGR) of 4.5% between 2025 and 2035. From 2020 to 2025, the market advanced at a CAGR of 3.7%, indicating an acceleration in consumer adoption and industry-level investments in nutrient-enhanced dairy solutions.
Quick Stats of Fortified Milk and Milk Products Market

  • Market Value (2025): USD 187.88 billion
  • Forecast Value (2035): USD 120.99 billion
  • Forecast CAGR (2025 to 2035): 4.5%
  • Leading Segment in 2025: Vitamins (35% share)
  • Key Growth Region: Asia Pacific (India is the fastest growing market with 6.2% CAGR)
  • Key Players: Arla Foods Ltd, FrieslandCampina, Fonterra Co-operative Group, Guangming Dairy Co. Ltd., The Kraft Heinz Company, China Modern Dairy Holdings Ltd., Dean Foods, Nestlé S.A., Gujarat Cooperative Milk Marketing Federation Ltd., and SanCor Cooperatives United Limited.

Fortified Milk And Milk Products Market

Attributes Description
Estimated Global Industry Size (2025E) USD 120.99 Billion
Projected Global Industry Value (2035F) USD 187.88 Billion
Value-based CAGR (2025 to 2035) 4.5%

This rise was driven primarily by public health mandates targeting vitamin A and D deficiencies, especially in regions such as South Asia and Sub-Saharan Africa. Regulatory interventions, such as India's 2020 directive under the Food Safety and Standards Authority, expanded the distribution of fortified milk through school meals and subsidized food programs.

The market register varying levels of share across its five parent markets. It contributes approximately 21% to the functional foods market, driven by increasing demand for nutrient-dense dairy. Within the dairy products market, its share stands at nearly 14%, as basic milk sees growing fortification.

In the nutraceuticals market, it represents around 9%, largely due to dairy’s role as a delivery format for bioactive ingredients. The infant and child nutrition market allocates close to 24% share to fortified dairy, given its prominence in early-age nutrition. In the clinical nutrition segment, the share is lower, estimated near 6%, as dairy-based fortification competes with medical-grade formulations. These percentages reflect how fortified dairy straddles both everyday consumption and targeted health use.

The primary growth driver remains the rising health awareness among consumers, especially in the context of preventive nutrition. As healthcare systems shift from treatment toward prevention, fortified foods, including dairy, have gained prominence for their dual role in everyday consumption and targeted health interventions. Governments and multilateral institutions have supported dairy fortification through public-private partnerships, school meal programs, and awareness campaigns. According to USA Department of Agriculture (USDA) announced a USD 11.04 million allocations through its Dairy Business Innovation Initiative (DBI).

This investment supports small and mid-sized dairy enterprises in creating and marketing value‑added products, such as fortified milk and dairy items, by funding technical assistance, business planning, and enhanced processing capabilities. Advances in fortification technologies have enabled nutrient integration without altering product taste or stability, making it easier for manufacturers to innovate. This combination of institutional backing, technological capability, and health-driven consumer preferences continues to shape the fortified milk and milk products market globally.

Analyzing Fortified Milk and Milk Products Market by Top Investment Segments

Vitamins dominate fortified dairy micronutrients because consumers trust their well-documented benefits and regulators actively back their inclusion, making deficiency prevention easy and affordable. Plain milk is the favored fortification vehicle owing to its universal consumption and minimal sensory impact, while modern trade stores steer distribution through superior assortment, reliable refrigeration, and tight brand partnerships that boost in-store discovery.

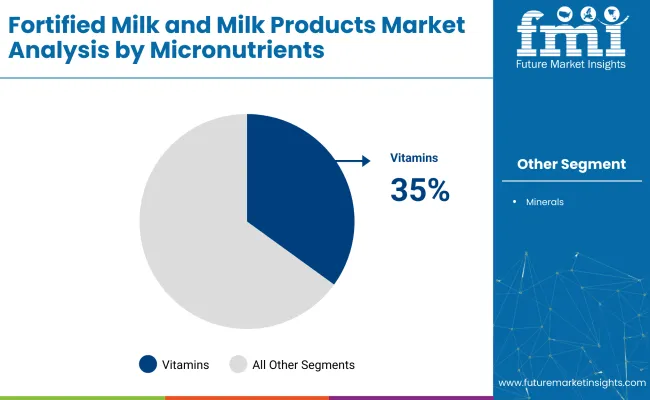
Vitamins to Lead the Micronutrients Segment with 35% Share

Vitamins are projected to lead the micronutrients segment, accounting for 35% of the global market share in 2025.
  • Vitamins lead the fortified milk and milk products segment due to their direct association with widely recognized health outcomes, particularly in bone health, immune function, and vision.
  • Deficiencies in vitamins D, A, and B12 are prevalent in various populations, especially among children, elderly individuals, and people with restricted diets.
  • Fortifying milk with these nutrients offers an efficient, low-cost solution to address such deficiencies through daily consumption. Consumer familiarity with vitamins, regulatory support for vitamin fortification, and advancements in nutrient delivery technologies have further solidified their position.

Fortified Milk And Milk Products Market Analysis By Micronutrients

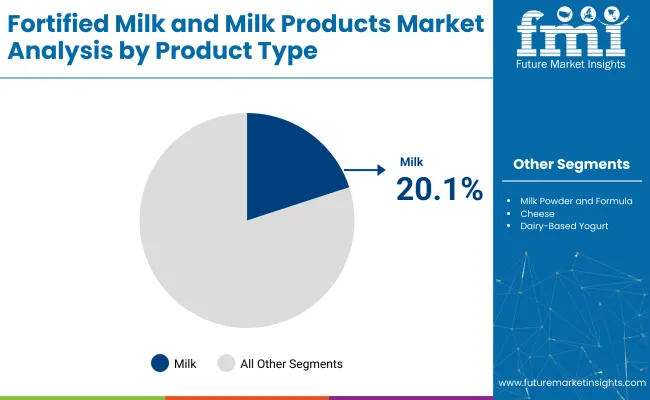
By Product Type, Milk Segment Accounts for Over 20.1% Share

Milk is projected to lead the product type segment, accounting for 20.1% of the market share in 2025. It is one of the most universally consumed products across age groups, cultures, and geographies. Its liquid format allows for easy integration of micronutrients without altering sensory qualities, making it suitable for both household and institutional distribution.
  • Parents view fortified milk as a convenient vehicle to ensure essential nutrient intake for children, while adults use it to supplement calcium, vitamin D, and B12 needs.
  • Compared to other dairy derivatives, milk enjoys higher daily penetration rates, greater shelf movement, and is more likely to be included in public health nutrition programs such as school milk schemes.
  • Widespread acceptability and compatibility with nutrient enrichment make it the most commercially viable and nutritionally strategic product type in the fortified dairy sector.

Fortified Milk And Milk Products Market Analysis By Product Type

Modern Trade to Lead the Sales Channel Segment with 32% Market Share

Modern trade leads the fortified milk and milk products market by sales channel, accounting for an estimated 32% share in 2025.

  • Supermarkets and hypermarkets under modern trade offer a wide product assortment, making them the preferred destination for health-conscious consumers seeking fortified dairy products. These outlets provide better visibility, cold-chain reliability, and in-store promotions that support premium and value-added dairy formats.
  • Urban households, which account for a significant share of fortified milk consumption, frequently rely on modern trade outlets for weekly shopping, especially when purchasing products in bulk.
  • Retailers in this segment also collaborate directly with brands to launch fortified variants, increasing shelf presence and trial rates.

Top Fortified Milk and Milk Products Market Dynamics

Widespread micronutrient deficiencies have pushed fortified milk into national health programs and broader adult use. Simultaneously, rising health consciousness and modern retail channels have fueled demand for clean-label, nutrient-rich dairy offerings.

Micronutrient Deficiency Response Drives Fortification Initiatives

Growing micronutrient deficiency concerns have driven fortified milk adoption across households and institutions. Public health campaigns, clinical backing, and WHO guidelines on fortification have pushed manufacturers to expand dairy-based delivery formats. Governments in Asia, Africa, and Latin America have prioritized fortified dairy in nutrition programs targeting anemia and vitamin D deficiency. As a result, fortified dairy is no longer limited to pediatric use but has expanded into everyday adult consumption.

  • National nutrition policies back dairy fortification
  • WHO and FAO support food-based interventions
  • Fortified milk adopted in school and maternal schemes

Consumer Health Focus Shapes Retail Distribution Strategies

Rising consumer awareness and retail have accelerated product uptake across developed and emerging regions. Modern trade and e-commerce platforms have enabled premium fortified dairy positioning with visible health claims and multi-pack options. Ingredient allows for stable nutrient incorporation without compromising texture or flavor. This balance of accessibility, efficacy, and taste continues to anchor fortified milk’s growth path.
  • E-commerce expands fortified dairy access
  • Clean-label, multi-nutrient variants drive consumer trust
  • Retail visibility strengthens health positioning

Analysis of Top Countries Manufacturing and Supplying Fortified Milk and Milk Products Globally

Country Wise Analysis Of Fortified Milk And Milk Products Market

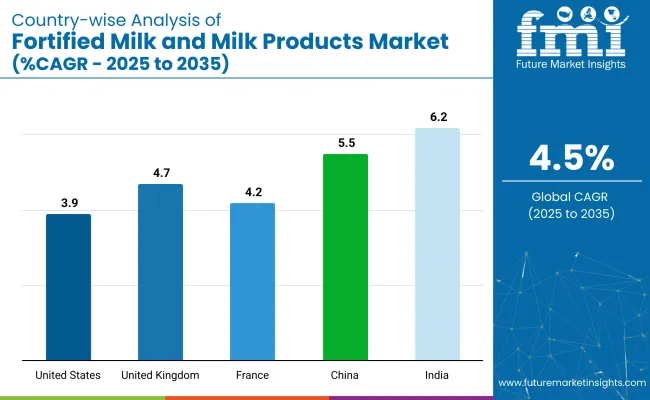
Countries CAGR (2025 to 2035)
United States 3.9%
United Kingdom 4.7%
France 4.2%
China 5.5%
India 6.2%

The United States fortified milk and milk products market is projected to grow at 3.9% CAGR as school-meal fortification mandates roll out nationwide and single-serve nutrient-dense milks gain traction on digital grocery platforms. The United Kingdom fortified milk and milk products market is forecast at 4.7% CAGR, with Public Health England guidance prompting retailers to relabel own-brand milk with vitamin D and rely on microencapsulation to protect added nutrients.

The France fortified milk and milk products market is expected to rise at 4.2% CAGR after the National Nutrition and Health Program endorsed fortified lactose-free UHT milk and pharmacies began stocking portioned fortified yogurts for convalescent use.

The China fortified milk and milk products market is anticipated to achieve 5.5% CAGR as the National Nutrition Plan prioritizes fortified dairy in rural schools and premium fortified yogurt drinks feature prominently on leading e-commerce channels. The India fortified milk and milk products market is projected to reach a 6.2% CAGR under FSSAI fortification rules, cooperative network expansion, influencer campaigns, and improved rural cold-chain logistics that widen access to vitamin-enriched milk.

The report covers a detailed analysis of 40+ countries and the top five countries have been shared as a reference.

USA Fortified Milk and Milk Products Market Analysis

The USA fortified milk and milk product market is projected to grow at 3.9% CAGR during the forecast period. Demand has been bolstered by widespread micronutrient deficiency screenings that identified vitamin D gaps across multiple age brackets. National School Lunch and Summer Food Service programs have mandated fortified options, prompting processors to upscale vitamin-rich fluid milk lines.

Retail chains have prioritized shelf space for calcium- and vitamin A-fortified dairy, a move reinforced by joint marketing agreements with leading cooperatives. Regulatory alignment between the Food and Drug Administration and state dairy boards has created clear fortification standards, reducing compliance risks for manufacturers.

  • Mandatory fortification rules guide processor investment.
  • Institutional meal programs secure baseline demand.
  • Online retail pushes single-serve nutrient-rich milk.

Fortified Milk and Milk Products Sales Analysis in China

The China fortified milk and milk product market is estimated to grow at 5.5% CAGR between 2025 and 2035. Rapid dietary shifts in urban centers have coincided with government campaigns addressing childhood stunting and widespread anemia. As part of the National Nutrition Plan (2021 to 2030), fortified milk distribution has been prioritized in kindergartens and rural boarding schools, leading large dairy firms to deploy on-site small-pack filling units.

E-commerce platforms have carried premium fortified yogurt drinks with tailored vitamin and mineral blends, supported by live-streamed nutrition advisory sessions that boost shopper confidence. Domestic processors have adopted near-farm UHT facilities to preserve freshness while integrating vitamin A and zinc premixes. Provincial subsidies covering testing fees have encouraged small and medium processors to comply with fortification standards, broadening supply in tier-three cities.

  • State nutrition targets expand fortified dairy reach.
  • E-commerce drives premium fortified yogurt drink uptake.
  • Provincial subsidies lower entry barriers for small processors.

The UK Fortified Milk and Milk Products Market Analysis

The UK fortified milk and milk product market is anticipated to grow at 4.7% CAGR from 2025 to 2035. Public Health England has advised year-round vitamin D supplementation, and fortified milk has been positioned as a simple dietary route for meeting those guidelines. Major supermarkets have rebranded own-label skimmed and semi-skimmed milk with added vitamin D and iodine, using front-of-pack summary icons that aid shopper recognition.

The Healthy Start scheme has included fortified fresh milk vouchers, extending nutrient intake among low-income families. Dairy processors have adopted microencapsulation techniques so vitamins remain stable through pasteurization without altering taste, a feature highlighted in advertising campaigns emphasizing bone support.

  • Government vouchers boost fortified milk accessibility.
  • Microencapsulation preserves nutrients during processing.
  • Retail labels simplify nutrient information for shoppers.

Fortified Milk and Milk Products Demand Analysis in India

The India fortified milk and milk product market is expected to grow at 6.2% CAGR during the forecast period. Micronutrient malnutrition reports have catalyzed Food Safety and Standards Authority of India regulations that mandate vitamin A- and D-fortified packaged milk. State cooperative federations have rolled out low-cost fortified milk pouches through public distribution networks, enhancing rural penetration.

School Mid-Day Meal expansions now integrate fortified flavored milk, financed by combined central and state budgets, locking in predictable institutional volume. Private dairies have partnered with global premix suppliers to launch lactose-free fortified lines aimed at urban millennials sensitive to digestive wellness narratives.

  • Mandatory FSSAI standards ensure uniform fortification.
  • Public distribution channels widen rural reach.
  • Influencer marketing amplifies fortified milk adoption.

Japan Fortified Milk and Milk Products Market Analysis

The France fortified milk and milk product market is estimated to grow at 4.2% CAGR during the forecast period. The French national nutrition and health program has endorsed fortified dairy as a countermeasure to documented vitamin D and calcium shortfalls among seniors. Large cooperatives have converted select ultra-high-temperature lines to produce fortified lactose-free milk, responding to growing digestive health concerns while complying with Ministry of Agriculture guidelines. Pharmacies have started stocking single-portion fortified yogurts positioned for convalescent patients, blurring category lines between everyday dairy and medical nutrition.

Retailers have tested blockchain labels that verify micronutrient inclusion levels, improving traceability and consumer trust. Culinary schools have added fortified milk modules to curriculum, reinforcing professional acceptance and normalizing use in pâtisserie and sauce bases.

  • National health targets emphasize vitamin D intake.
  • Pharmacy channels broaden fortified yogurt distribution.
  • Blockchain labels validate micronutrient content.

Leading Fortified Milk and Milk Products Suppliers

The fortified milk and milk products market is moderately consolidated, with major players including Arla Foods Ltd, FrieslandCampina, Fonterra Co-operative Group, Guangming Dairy Co. Ltd., and The Kraft Heinz Company. These companies drive competition by leveraging integrated supply chains, advanced fortification techniques, and strong retail partnerships.

For instance, Arla Foods Ltd focuses on vitamin D-fortified milk under its wellness portfolio, while FrieslandCampina offers multi-nutrient formulations targeting child nutrition. Fonterra emphasizes protein- and calcium-rich milk variants tailored for Asia-Pacific consumers. Guangming Dairy Co. Ltd. and China Modern Dairy Holdings Ltd. serve urban Chinese markets through fortified UHT milk lines. Nestlé S.A. and Dean Foods expand product penetration via retail partnerships, and Gujarat Cooperative Milk Marketing Federation Ltd. leads India's rural market with government-aligned fortified milk pouches.

Recent Fortified Milk and Milk Products Industry News

  • In June 2025, Arla Foods announced a €59.4 million investment to expand cream cheese production capacity at its Holstebro Dairy in Denmark. This expansion will add two new filling lines, unlocking an additional 16,000 tonnes of annual capacity.
  • In February 2024, Fonterra announced plans to merge its dairy businesses in Australia and New Zealand, aiming to strengthen its regional position and streamline operations, including those related to fortified milk products.

Leading Players

  • Arla Foods Ltd
  • FrieslandCampina
  • Fonterra Co-operative Group
  • Guangming Dairy Co. Ltd.
  • The Kraft Heinz Company
  • China Modern Dairy Holdings Ltd.
  • Dean Foods
  • Nestle S.A.
  • Gujarat Cooperative Milk Marketing Federation Ltd.
  • SanCor Cooperatives United Limited

Report Coverage and Scope Summary

Report Attributes Details
Market Size (2025) USD 120.99 billion
Projected Market Size (2035) USD 187.88 billion
CAGR (2025 to 2035) 4.5%
Base Year for Estimation 2024
Historical Period 2020 to 2024
Projections Period 2025 to 2035
Quantitative Units USD billion for value and volume in metric tons
Product Type Analyzed (Segment 1) Milk, Milk Powder and Formula, Flavored Milk, Cheese, and Dairy-Based Yogurt.
Micronutrients Analyzed (Segment 2) Vitamins and Minerals.
Sales Channel Analyzed (Segment 3) Modern Trade, Convenience Stores, Departmental Stores, Drug Stores, and Online Stores.
Regions Covered North America, Europe, Asia Pacific, Middle East & Africa, Latin America
Countries Covered United States, Canada, Germany, United Kingdom, France, Italy, Spain, China, Japan, South Korea, India, Australia, Brazil, Mexico, Argentina, Saudi Arabia, UAE, South Africa
Key Players Arla Foods Ltd, FrieslandCampina, Fonterra Co-operative Group, Guangming Dairy Co. Ltd., The Kraft Heinz Company, China Modern Dairy Holdings Ltd., Dean Foods, Nestlé S.A., Gujarat Cooperative Milk Marketing Federation Ltd., and SanCor Cooperatives United Limited.
Additional Attributes Dollar sales, share, growth by region, product-type demand, consumer trends by age group, regulatory landscape, fortification ingredient usage, pricing benchmarks, distribution channel performance, private-label threat, and retail partnerships

Key Fortified Milk and Milk Products Market Segmentation

By Product Type:

The industry is segmented into milk, milk powder and formula, flavored milk, cheese, and dairy-based yogurt.

By Micronutrients:

The industry is segmented into vitamins and minerals.

By Sales Channel:

The industry finds modern trade, convenience stores, departmental stores, drug stores, and online stores.

By Region:

The industry covers regions including North America, Europe, Asia Pacific, Latin America, and the Middle East & Africa.

Table of Content

  1. Executive Summary
    • Global Market Outlook
    • Demand-side Trends
    • Supply-side Trends
    • Technology Roadmap Analysis
    • Analysis and Recommendations
  2. Market Overview
    • Market Coverage / Taxonomy
    • Market Definition / Scope / Limitations
  3. Market Background
    • Market Dynamics
      • Drivers
      • Restraints
      • Opportunity
      • Trends
    • Scenario Forecast
      • Demand in Optimistic Scenario
      • Demand in Likely Scenario
      • Demand in Conservative Scenario
    • Opportunity Map Analysis
    • Product Life Cycle Analysis
    • Supply Chain Analysis
      • Supply Side Participants and their Roles
        • Producers
        • Mid-Level Participants (Traders/ Agents/ Brokers)
        • Wholesalers and Distributors
      • Value Added and Value Created at Node in the Supply Chain
      • List of Raw Material Suppliers
      • List of Existing and Potential Buyer’s
    • Investment Feasibility Matrix
    • Value Chain Analysis
      • Profit Margin Analysis
      • Wholesalers and Distributors
      • Retailers
    • PESTLE and Porter’s Analysis
    • Regulatory Landscape
      • By Key Regions
      • By Key Countries
    • Regional Parent Market Outlook
    • Production and Consumption Statistics
    • Import and Export Statistics
  4. Global Market Analysis 2020 to 2024 and Forecast, 2025 to 2035
    • Historical Market Size Value (USD Billion) & Volume (Metric tons) Analysis, 2020 to 2024
    • Current and Future Market Size Value (USD Billion) & Volume (Metric tons) Projections, 2025 to 2035
      • Y-o-Y Growth Trend Analysis
      • Absolute $ Opportunity Analysis
  5. Global Market Pricing Analysis 2020 to 2024 and Forecast 2025 to 2035
  6. Global Market Analysis 2020 to 2024 and Forecast 2025 to 2035, By Product Type
    • Introduction / Key Findings
    • Historical Market Size Value (USD Billion) & Volume (Metric tons) Analysis By Product Type, 2020 to 2024
    • Current and Future Market Size Value (USD Billion) & Volume (Metric tons) Analysis and Forecast By Product Type, 2025 to 2035
      • Milk
      • Milk Powder and Formula
      • Flavored Milk
      • Cheese
      • Dairy-Based Yogurt
    • Y-o-Y Growth Trend Analysis By Product Type, 2020 to 2024
    • Absolute $ Opportunity Analysis By Product Type, 2025 to 2035
  7. Global Market Analysis 2020 to 2024 and Forecast 2025 to 2035, By Micronutrients
    • Introduction / Key Findings
    • Historical Market Size Value (USD Billion) & Volume (Metric tons) Analysis By Micronutrients, 2020 to 2024
    • Current and Future Market Size Value (USD Billion) & Volume (Metric tons) Analysis and Forecast By Micronutrients, 2025 to 2035
      • Vitamins
      • Minerals
    • Y-o-Y Growth Trend Analysis By Micronutrients, 2020 to 2024
    • Absolute $ Opportunity Analysis By Micronutrients, 2025 to 2035
  8. Global Market Analysis 2020 to 2024 and Forecast 2025 to 2035, By Sales Channel
    • Introduction / Key Findings
    • Historical Market Size Value (USD Billion) & Volume (Metric tons) Analysis By Sales Channel, 2020 to 2024
    • Current and Future Market Size Value (USD Billion) & Volume (Metric tons) Analysis and Forecast By Sales Channel, 2025 to 2035
      • Modern Trade
      • Convenience Stores
      • Departmental Stores
      • Drug Stores
      • Online Stores
    • Y-o-Y Growth Trend Analysis By Sales Channel, 2020 to 2024
    • Absolute $ Opportunity Analysis By Sales Channel, 2025 to 2035
  9. Global Market Analysis 2020 to 2024 and Forecast 2025 to 2035, By Region
    • Introduction
    • Historical Market Size Value (USD Billion) & Volume (Metric tons) Analysis By Region, 2020 to 2024
    • Current Market Size Value (USD Billion) & Volume (Metric tons) Analysis and Forecast By Region, 2025 to 2035
      • North America
      • Latin America
      • Western Europe
      • Eastern Europe
      • East Asia
      • South Asia & Pacific
      • Middle East and Africa
    • Market Attractiveness Analysis By Region
  10. North America Market Analysis 2020 to 2024 and Forecast 2025 to 2035, By Country
    • Historical Market Size Value (USD Billion) & Volume (Metric tons) Trend Analysis By Market Taxonomy, 2020 to 2024
    • Market Size Value (USD Billion) & Volume (Metric tons) Forecast By Market Taxonomy, 2025 to 2035
      • By Country
        • USA
        • Canada
        • Mexico
      • By Product Type
      • By Micronutrients
      • By Sales Channel
    • Market Attractiveness Analysis
      • By Country
      • By Product Type
      • By Micronutrients
      • By Sales Channel
    • Key Takeaways
  11. Latin America Market Analysis 2020 to 2024 and Forecast 2025 to 2035, By Country
    • Historical Market Size Value (USD Billion) & Volume (Metric tons) Trend Analysis By Market Taxonomy, 2020 to 2024
    • Market Size Value (USD Billion) & Volume (Metric tons) Forecast By Market Taxonomy, 2025 to 2035
      • By Country
        • Brazil
        • Argentina
        • Rest of LATAM
      • By Product Type
      • By Micronutrients
      • By Sales Channel
    • Market Attractiveness Analysis
      • By Country
      • By Product Type
      • By Micronutrients
      • By Sales Channel
    • Key Takeaways
  12. Western Europe Market Analysis 2020 to 2024 and Forecast 2025 to 2035, By Country
    • Historical Market Size Value (USD Billion) & Volume (Metric tons) Trend Analysis By Market Taxonomy, 2020 to 2024
    • Market Size Value (USD Billion) & Volume (Metric tons) Forecast By Market Taxonomy, 2025 to 2035
      • By Country
        • Germany
        • Italy
        • France
        • UK
        • Spain
        • BENELUX
        • Nordic
        • Rest of W.Europe
      • By Product Type
      • By Micronutrients
      • By Sales Channel
    • Market Attractiveness Analysis
      • By Country
      • By Product Type
      • By Micronutrients
      • By Sales Channel
    • Key Takeaways
  13. Eastern Europe Market Analysis 2020 to 2024 and Forecast 2025 to 2035, By Country
    • Historical Market Size Value (USD Billion) & Volume (Metric tons) Trend Analysis By Market Taxonomy, 2020 to 2024
    • Market Size Value (USD Billion) & Volume (Metric tons) Forecast By Market Taxonomy, 2025 to 2035
      • By Country
        • Russia
        • Hungary
        • Poland
        • Balkan & Baltics
        • Rest of E. Europe
      • By Product Type
      • By Micronutrients
      • By Sales Channel
    • Market Attractiveness Analysis
      • By Country
      • By Product Type
      • By Micronutrients
      • By Sales Channel
    • Key Takeaways
  14. East Asia Market Analysis 2020 to 2024 and Forecast 2025 to 2035, By Country
    • Historical Market Size Value (USD Billion) & Volume (Metric tons) Trend Analysis By Market Taxonomy, 2020 to 2024
    • Market Size Value (USD Billion) & Volume (Metric tons) Forecast By Market Taxonomy, 2025 to 2035
      • By Country
        • China
        • Japan
        • South Korea
      • By Product Type
      • By Micronutrients
      • By Sales Channel
    • Market Attractiveness Analysis
      • By Country
      • By Product Type
      • By Micronutrients
      • By Sales Channel
    • Key Takeaways
  15. South Asia & Pacific Market Analysis 2020 to 2024 and Forecast 2025 to 2035, By Country
    • Historical Market Size Value (USD Billion) & Volume (Metric tons) Trend Analysis By Market Taxonomy, 2020 to 2024
    • Market Size Value (USD Billion) & Volume (Metric tons) Forecast By Market Taxonomy, 2025 to 2035
      • By Country
        • India
        • Australia & New Zealand
        • ASEAN
        • Rest of SAP
      • By Product Type
      • By Micronutrients
      • By Sales Channel
    • Market Attractiveness Analysis
      • By Country
      • By Product Type
      • By Micronutrients
      • By Sales Channel
    • Key Takeaways
  16. Middle East and Africa Market Analysis 2020 to 2024 and Forecast 2025 to 2035, By Country
    • Historical Market Size Value (USD Billion) & Volume (Metric tons) Trend Analysis By Market Taxonomy, 2020 to 2024
    • Market Size Value (USD Billion) & Volume (Metric tons) Forecast By Market Taxonomy, 2025 to 2035
      • By Country
        • GCC Countries
        • Northern Africa
        • South Africa
        • Turkiye
        • Rest of MEA
      • By Product Type
      • By Micronutrients
      • By Sales Channel
    • Market Attractiveness Analysis
      • By Country
      • By Product Type
      • By Micronutrients
      • By Sales Channel
    • Key Takeaways
  17. Key Countries Market Analysis
    • USA
      • Pricing Analysis
      • Market Share Analysis, 2024
        • By Product Type
        • By Micronutrients
        • By Sales Channel
    • Canada
      • Pricing Analysis
      • Market Share Analysis, 2024
        • By Product Type
        • By Micronutrients
        • By Sales Channel
    • Brazil
      • Pricing Analysis
      • Market Share Analysis, 2024
        • By Product Type
        • By Micronutrients
        • By Sales Channel
    • Mexico
      • Pricing Analysis
      • Market Share Analysis, 2024
        • By Product Type
        • By Micronutrients
        • By Sales Channel
    • Argentina
      • Pricing Analysis
      • Market Share Analysis, 2024
        • By Product Type
        • By Micronutrients
        • By Sales Channel
  18. Market Structure Analysis
    • Competition Dashboard
    • Competition Benchmarking
    • Market Share Analysis of Top Players
      • By Regional
      • By Product Type
      • By Micronutrients
      • By Sales Channel
  19. Competition Analysis
    • Competition Deep Dive
      • Arla Foods Ltd
        • Overview
        • Product Portfolio
        • Profitability by Market Segments (Product/Age /Sales Channel/Region)
        • Sales Footprint
        • Strategy Overview
          • Marketing Strategy
          • Product Strategy
          • Channel Strategy
      • FrieslandCampina
        • Overview
        • Product Portfolio
        • Profitability by Market Segments (Product/Age /Sales Channel/Region)
        • Sales Footprint
        • Strategy Overview
          • Marketing Strategy
          • Product Strategy
          • Channel Strategy
      • Fonterra Co-operative Group
        • Overview
        • Product Portfolio
        • Profitability by Market Segments (Product/Age /Sales Channel/Region)
        • Sales Footprint
        • Strategy Overview
          • Marketing Strategy
          • Product Strategy
          • Channel Strategy
      • Guangming Dairy Co. Ltd.
        • Overview
        • Product Portfolio
        • Profitability by Market Segments (Product/Age /Sales Channel/Region)
        • Sales Footprint
        • Strategy Overview
          • Marketing Strategy
          • Product Strategy
          • Channel Strategy
      • The Kraft Heinz Company
        • Overview
        • Product Portfolio
        • Profitability by Market Segments (Product/Age /Sales Channel/Region)
        • Sales Footprint
        • Strategy Overview
          • Marketing Strategy
          • Product Strategy
          • Channel Strategy
      • China Modern Dairy Holdings Ltd.
        • Overview
        • Product Portfolio
        • Profitability by Market Segments (Product/Age /Sales Channel/Region)
        • Sales Footprint
        • Strategy Overview
          • Marketing Strategy
          • Product Strategy
          • Channel Strategy
      • Dean Foods
        • Overview
        • Product Portfolio
        • Profitability by Market Segments (Product/Age /Sales Channel/Region)
        • Sales Footprint
        • Strategy Overview
          • Marketing Strategy
          • Product Strategy
          • Channel Strategy
      • Nestle S.A.
        • Overview
        • Product Portfolio
        • Profitability by Market Segments (Product/Age /Sales Channel/Region)
        • Sales Footprint
        • Strategy Overview
          • Marketing Strategy
          • Product Strategy
          • Channel Strategy
      • Gujarat Cooperative Milk Marketing Federation Ltd.
        • Overview
        • Product Portfolio
        • Profitability by Market Segments (Product/Age /Sales Channel/Region)
        • Sales Footprint
        • Strategy Overview
          • Marketing Strategy
          • Product Strategy
          • Channel Strategy
      • SanCor Cooperatives Value (USD Billion) & Volume (Metric tons)ed Limited
        • Overview
        • Product Portfolio
        • Profitability by Market Segments (Product/Age /Sales Channel/Region)
        • Sales Footprint
        • Strategy Overview
          • Marketing Strategy
          • Product Strategy
          • Channel Strategy
  20. Assumptions & Acronyms Used
  21. Research Methodology

List of Tables

  • Table 1: Global Market Value (USD Billion) Forecast by Region, 2020 to 2035
  • Table 2: Global Market Volume (Metric tons) Forecast by Region, 2020 to 2035
  • Table 3: Global Market Value (USD Billion) Forecast by Product Type, 2020 to 2035
  • Table 4: Global Market Volume (Metric tons) Forecast by Product Type, 2020 to 2035
  • Table 5: Global Market Value (USD Billion) Forecast by Micronutrients, 2020 to 2035
  • Table 6: Global Market Volume (Metric tons) Forecast by Micronutrients, 2020 to 2035
  • Table 7: Global Market Value (USD Billion) Forecast by Sales Channel, 2020 to 2035
  • Table 8: Global Market Volume (Metric tons) Forecast by Sales Channel, 2020 to 2035
  • Table 9: North America Market Value (USD Billion) Forecast by Country, 2020 to 2035
  • Table 10: North America Market Volume (Metric tons) Forecast by Country, 2020 to 2035
  • Table 11: North America Market Value (USD Billion) Forecast by Product Type, 2020 to 2035
  • Table 12: North America Market Volume (Metric tons) Forecast by Product Type, 2020 to 2035
  • Table 13: North America Market Value (USD Billion) Forecast by Micronutrients, 2020 to 2035
  • Table 14: North America Market Volume (Metric tons) Forecast by Micronutrients, 2020 to 2035
  • Table 15: North America Market Value (USD Billion) Forecast by Sales Channel, 2020 to 2035
  • Table 16: North America Market Volume (Metric tons) Forecast by Sales Channel, 2020 to 2035
  • Table 17: Latin America Market Value (USD Billion) Forecast by Country, 2020 to 2035
  • Table 18: Latin America Market Volume (Metric tons) Forecast by Country, 2020 to 2035
  • Table 19: Latin America Market Value (USD Billion) Forecast by Product Type, 2020 to 2035
  • Table 20: Latin America Market Volume (Metric tons) Forecast by Product Type, 2020 to 2035
  • Table 21: Latin America Market Value (USD Billion) Forecast by Micronutrients, 2020 to 2035
  • Table 22: Latin America Market Volume (Metric tons) Forecast by Micronutrients, 2020 to 2035
  • Table 23: Latin America Market Value (USD Billion) Forecast by Sales Channel, 2020 to 2035
  • Table 24: Latin America Market Volume (Metric tons) Forecast by Sales Channel, 2020 to 2035
  • Table 25: Western Europe Market Value (USD Billion) Forecast by Country, 2020 to 2035
  • Table 26: Western Europe Market Volume (Metric tons) Forecast by Country, 2020 to 2035
  • Table 27: Western Europe Market Value (USD Billion) Forecast by Product Type, 2020 to 2035
  • Table 28: Western Europe Market Volume (Metric tons) Forecast by Product Type, 2020 to 2035
  • Table 29: Western Europe Market Value (USD Billion) Forecast by Micronutrients, 2020 to 2035
  • Table 30: Western Europe Market Volume (Metric tons) Forecast by Micronutrients, 2020 to 2035
  • Table 31: Western Europe Market Value (USD Billion) Forecast by Sales Channel, 2020 to 2035
  • Table 32: Western Europe Market Volume (Metric tons) Forecast by Sales Channel, 2020 to 2035
  • Table 33: Eastern Europe Market Value (USD Billion) Forecast by Country, 2020 to 2035
  • Table 34: Eastern Europe Market Volume (Metric tons) Forecast by Country, 2020 to 2035
  • Table 35: Eastern Europe Market Value (USD Billion) Forecast by Product Type, 2020 to 2035
  • Table 36: Eastern Europe Market Volume (Metric tons) Forecast by Product Type, 2020 to 2035
  • Table 37: Eastern Europe Market Value (USD Billion) Forecast by Micronutrients, 2020 to 2035
  • Table 38: Eastern Europe Market Volume (Metric tons) Forecast by Micronutrients, 2020 to 2035
  • Table 39: Eastern Europe Market Value (USD Billion) Forecast by Sales Channel, 2020 to 2035
  • Table 40: Eastern Europe Market Volume (Metric tons) Forecast by Sales Channel, 2020 to 2035
  • Table 41: East Asia Market Value (USD Billion) Forecast by Country, 2020 to 2035
  • Table 42: East Asia Market Volume (Metric tons) Forecast by Country, 2020 to 2035
  • Table 43: East Asia Market Value (USD Billion) Forecast by Product Type, 2020 to 2035
  • Table 44: East Asia Market Volume (Metric tons) Forecast by Product Type, 2020 to 2035
  • Table 45: East Asia Market Value (USD Billion) Forecast by Micronutrients, 2020 to 2035
  • Table 46: East Asia Market Volume (Metric tons) Forecast by Micronutrients, 2020 to 2035
  • Table 47: East Asia Market Value (USD Billion) Forecast by Sales Channel, 2020 to 2035
  • Table 48: East Asia Market Volume (Metric tons) Forecast by Sales Channel, 2020 to 2035
  • Table 49: South Asia & Pacific Market Value (USD Billion) Forecast by Country, 2020 to 2035
  • Table 50: South Asia & Pacific Market Volume (Metric tons) Forecast by Country, 2020 to 2035
  • Table 51: South Asia & Pacific Market Value (USD Billion) Forecast by Product Type, 2020 to 2035
  • Table 52: South Asia & Pacific Market Volume (Metric tons) Forecast by Product Type, 2020 to 2035
  • Table 53: South Asia & Pacific Market Value (USD Billion) Forecast by Micronutrients, 2020 to 2035
  • Table 54: South Asia & Pacific Market Volume (Metric tons) Forecast by Micronutrients, 2020 to 2035
  • Table 55: South Asia & Pacific Market Value (USD Billion) Forecast by Sales Channel, 2020 to 2035
  • Table 56: South Asia & Pacific Market Volume (Metric tons) Forecast by Sales Channel, 2020 to 2035
  • Table 57: Middle East and Africa Market Value (USD Billion) Forecast by Country, 2020 to 2035
  • Table 58: Middle East and Africa Market Volume (Metric tons) Forecast by Country, 2020 to 2035
  • Table 59: Middle East and Africa Market Value (USD Billion) Forecast by Product Type, 2020 to 2035
  • Table 60: Middle East and Africa Market Volume (Metric tons) Forecast by Product Type, 2020 to 2035
  • Table 61: Middle East and Africa Market Value (USD Billion) Forecast by Micronutrients, 2020 to 2035
  • Table 62: Middle East and Africa Market Volume (Metric tons) Forecast by Micronutrients, 2020 to 2035
  • Table 63: Middle East and Africa Market Value (USD Billion) Forecast by Sales Channel, 2020 to 2035
  • Table 64: Middle East and Africa Market Volume (Metric tons) Forecast by Sales Channel, 2020 to 2035

List of Figures

  • Figure 1: Global Market Volume (Metric tons) Forecast 2020 to 2035
  • Figure 2: Global Market Pricing Analysis
  • Figure 3: Global Market Value (USD Billion) Forecast 2020 to 2035
  • Figure 4: Global Market Value Share and BPS Analysis by Product Type, 2025 and 2035
  • Figure 5: Global Market Y-o-Y Growth Comparison by Product Type, 2025 to 2035
  • Figure 6: Global Market Attractiveness Analysis by Product Type
  • Figure 7: Global Market Value Share and BPS Analysis by Micronutrients, 2025 and 2035
  • Figure 8: Global Market Y-o-Y Growth Comparison by Micronutrients, 2025 to 2035
  • Figure 9: Global Market Attractiveness Analysis by Micronutrients
  • Figure 10: Global Market Value Share and BPS Analysis by Sales Channel, 2025 and 2035
  • Figure 11: Global Market Y-o-Y Growth Comparison by Sales Channel, 2025 to 2035
  • Figure 12: Global Market Attractiveness Analysis by Sales Channel
  • Figure 13: Global Market Value (USD Billion) Share and BPS Analysis by Region, 2025 and 2035
  • Figure 14: Global Market Y-o-Y Growth Comparison by Region, 2025 to 2035
  • Figure 15: Global Market Attractiveness Analysis by Region
  • Figure 16: North America Market Incremental $ Opportunity, 2025 to 2035
  • Figure 17: Latin America Market Incremental $ Opportunity, 2025 to 2035
  • Figure 18: Western Europe Market Incremental $ Opportunity, 2025 to 2035
  • Figure 19: Eastern Europe Market Incremental $ Opportunity, 2025 to 2035
  • Figure 20: East Asia Market Incremental $ Opportunity, 2025 to 2035
  • Figure 21: South Asia & Pacific Market Incremental $ Opportunity, 2025 to 2035
  • Figure 22: Middle East and Africa Market Incremental $ Opportunity, 2025 to 2035
  • Figure 23: North America Market Value Share and BPS Analysis by Country, 2025 and 2035
  • Figure 24: North America Market Value Share and BPS Analysis by Product Type, 2025 and 2035
  • Figure 25: North America Market Y-o-Y Growth Comparison by Product Type, 2025 to 2035
  • Figure 26: North America Market Attractiveness Analysis by Product Type
  • Figure 27: North America Market Value Share and BPS Analysis by Micronutrients, 2025 and 2035
  • Figure 28: North America Market Y-o-Y Growth Comparison by Micronutrients, 2025 to 2035
  • Figure 29: North America Market Attractiveness Analysis by Micronutrients
  • Figure 30: North America Market Value Share and BPS Analysis by Sales Channel, 2025 and 2035
  • Figure 31: North America Market Y-o-Y Growth Comparison by Sales Channel, 2025 to 2035
  • Figure 32: North America Market Attractiveness Analysis by Sales Channel
  • Figure 33: Latin America Market Value Share and BPS Analysis by Country, 2025 and 2035
  • Figure 34: Latin America Market Value Share and BPS Analysis by Product Type, 2025 and 2035
  • Figure 35: Latin America Market Y-o-Y Growth Comparison by Product Type, 2025 to 2035
  • Figure 36: Latin America Market Attractiveness Analysis by Product Type
  • Figure 37: Latin America Market Value Share and BPS Analysis by Micronutrients, 2025 and 2035
  • Figure 38: Latin America Market Y-o-Y Growth Comparison by Micronutrients, 2025 to 2035
  • Figure 39: Latin America Market Attractiveness Analysis by Micronutrients
  • Figure 40: Latin America Market Value Share and BPS Analysis by Sales Channel, 2025 and 2035
  • Figure 41: Latin America Market Y-o-Y Growth Comparison by Sales Channel, 2025 to 2035
  • Figure 42: Latin America Market Attractiveness Analysis by Sales Channel
  • Figure 43: Western Europe Market Value Share and BPS Analysis by Country, 2025 and 2035
  • Figure 44: Western Europe Market Value Share and BPS Analysis by Product Type, 2025 and 2035
  • Figure 45: Western Europe Market Y-o-Y Growth Comparison by Product Type, 2025 to 2035
  • Figure 46: Western Europe Market Attractiveness Analysis by Product Type
  • Figure 47: Western Europe Market Value Share and BPS Analysis by Micronutrients, 2025 and 2035
  • Figure 48: Western Europe Market Y-o-Y Growth Comparison by Micronutrients, 2025 to 2035
  • Figure 49: Western Europe Market Attractiveness Analysis by Micronutrients
  • Figure 50: Western Europe Market Value Share and BPS Analysis by Sales Channel, 2025 and 2035
  • Figure 51: Western Europe Market Y-o-Y Growth Comparison by Sales Channel, 2025 to 2035
  • Figure 52: Western Europe Market Attractiveness Analysis by Sales Channel
  • Figure 53: Eastern Europe Market Value Share and BPS Analysis by Country, 2025 and 2035
  • Figure 54: Eastern Europe Market Value Share and BPS Analysis by Product Type, 2025 and 2035
  • Figure 55: Eastern Europe Market Y-o-Y Growth Comparison by Product Type, 2025 to 2035
  • Figure 56: Eastern Europe Market Attractiveness Analysis by Product Type
  • Figure 57: Eastern Europe Market Value Share and BPS Analysis by Micronutrients, 2025 and 2035
  • Figure 58: Eastern Europe Market Y-o-Y Growth Comparison by Micronutrients, 2025 to 2035
  • Figure 59: Eastern Europe Market Attractiveness Analysis by Micronutrients
  • Figure 60: Eastern Europe Market Value Share and BPS Analysis by Sales Channel, 2025 and 2035
  • Figure 61: Eastern Europe Market Y-o-Y Growth Comparison by Sales Channel, 2025 to 2035
  • Figure 62: Eastern Europe Market Attractiveness Analysis by Sales Channel
  • Figure 63: East Asia Market Value Share and BPS Analysis by Country, 2025 and 2035
  • Figure 64: East Asia Market Value Share and BPS Analysis by Product Type, 2025 and 2035
  • Figure 65: East Asia Market Y-o-Y Growth Comparison by Product Type, 2025 to 2035
  • Figure 66: East Asia Market Attractiveness Analysis by Product Type
  • Figure 67: East Asia Market Value Share and BPS Analysis by Micronutrients, 2025 and 2035
  • Figure 68: East Asia Market Y-o-Y Growth Comparison by Micronutrients, 2025 to 2035
  • Figure 69: East Asia Market Attractiveness Analysis by Micronutrients
  • Figure 70: East Asia Market Value Share and BPS Analysis by Sales Channel, 2025 and 2035
  • Figure 71: East Asia Market Y-o-Y Growth Comparison by Sales Channel, 2025 to 2035
  • Figure 72: East Asia Market Attractiveness Analysis by Sales Channel
  • Figure 73: South Asia & Pacific Market Value Share and BPS Analysis by Country, 2025 and 2035
  • Figure 74: South Asia & Pacific Market Value Share and BPS Analysis by Product Type, 2025 and 2035
  • Figure 75: South Asia & Pacific Market Y-o-Y Growth Comparison by Product Type, 2025 to 2035
  • Figure 76: South Asia & Pacific Market Attractiveness Analysis by Product Type
  • Figure 77: South Asia & Pacific Market Value Share and BPS Analysis by Micronutrients, 2025 and 2035
  • Figure 78: South Asia & Pacific Market Y-o-Y Growth Comparison by Micronutrients, 2025 to 2035
  • Figure 79: South Asia & Pacific Market Attractiveness Analysis by Micronutrients
  • Figure 80: South Asia & Pacific Market Value Share and BPS Analysis by Sales Channel, 2025 and 2035
  • Figure 81: South Asia & Pacific Market Y-o-Y Growth Comparison by Sales Channel, 2025 to 2035
  • Figure 82: South Asia & Pacific Market Attractiveness Analysis by Sales Channel
  • Figure 83: Middle East and Africa Market Value Share and BPS Analysis by Country, 2025 and 2035
  • Figure 84: Middle East and Africa Market Value Share and BPS Analysis by Product Type, 2025 and 2035
  • Figure 85: Middle East and Africa Market Y-o-Y Growth Comparison by Product Type, 2025 to 2035
  • Figure 86: Middle East and Africa Market Attractiveness Analysis by Product Type
  • Figure 87: Middle East and Africa Market Value Share and BPS Analysis by Micronutrients, 2025 and 2035
  • Figure 88: Middle East and Africa Market Y-o-Y Growth Comparison by Micronutrients, 2025 to 2035
  • Figure 89: Middle East and Africa Market Attractiveness Analysis by Micronutrients
  • Figure 90: Middle East and Africa Market Value Share and BPS Analysis by Sales Channel, 2025 and 2035
  • Figure 91: Middle East and Africa Market Y-o-Y Growth Comparison by Sales Channel, 2025 to 2035
  • Figure 92: Middle East and Africa Market Attractiveness Analysis by Sales Channel
  • Figure 93: Global Market - Tier Structure Analysis
  • Figure 94: Global Market - Company Share Analysis

Frequently Asked Questions

What is the estimated market size of the fortified milk and milk products industry in 2025?

The industry is valued at USD 120.99 billion in 2025.

What is the projected industry size of the fortified milk and milk products industry by 2035?

It is forecasted to reach USD 187.88 billion by 2035.

What is the expected CAGR for the fortified milk and milk products industry between 2025 and 2035?

The industry is anticipated to grow at a CAGR of 4.5% during this period.

Which segment is expected to lead the fortified milk and milk products market in 2025?

Vitamins are projected to lead the market with a 35% share in 2025.

Which region is expected to witness the highest growth in the fortified milk and milk products market?

Asia Pacific, particularly India, is expected to be the key growth region with a projected growth rate of 6.2%.

Explore Similar Insights

Future Market Insights

Fortified Milk and Milk Products Market