Fortified Dairy Products Market Outlook (2025 to 2035)

The Fortified Dairy Products Market is estimated to be valued at USD 29.9 billion in 2025 and is projected to reach USD 49.4 billion by 2035, registering a compound annual growth rate (CAGR) of 5.1% over the forecast period.

The Fortified Dairy Products market is witnessing significant growth driven by increasing consumer awareness regarding nutrition and health benefits of dairy fortification. Rising demand for functional foods, coupled with a growing focus on preventive healthcare, is shaping the market's future outlook. Urbanization, rising disposable incomes, and evolving dietary habits are contributing to the adoption of fortified dairy products across age groups.

The market is further supported by government initiatives promoting micronutrient supplementation and nutritional labeling, which encourage healthier food choices. Continuous innovation in fortification technologies has enhanced product quality and bioavailability of essential nutrients, making fortified dairy products a preferred choice among health-conscious consumers.

Additionally, growing demand from regions with high prevalence of micronutrient deficiencies is driving adoption, while retail expansion and modern distribution channels improve product accessibility As consumer preference shifts toward nutrient-enriched foods and lifestyle diseases rise, the Fortified Dairy Products market is expected to experience sustained expansion across both developed and emerging regions.
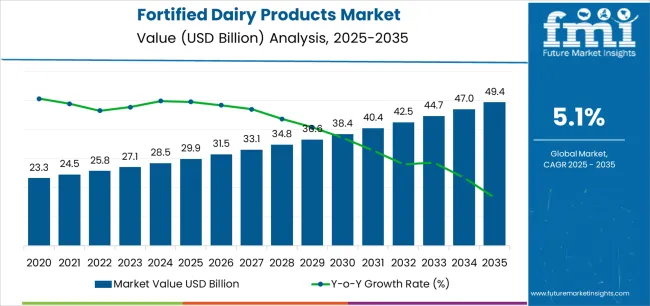
Quick Stats for Fortified Dairy Products Market

  • Fortified Dairy Products Market Industry Value (2025): USD 29.9 billion
  • Fortified Dairy Products Market Forecast Value (2035): USD 49.4 billion
  • Fortified Dairy Products Market Forecast CAGR: 5.1%
  • Leading Segment in Fortified Dairy Products Market in 2025: Fortified Milk (36.1%)
  • Key Growth Region in Fortified Dairy Products Market: North America, Asia-Pacific, Europe
  • Top Key Players in Fortified Dairy Products Market: Friesland campina ingredients, Arla Foods Ltd, Fonterra Co-operative Group, FrieslandCampina, Guangming Dairy Co., Ltd., China Modern Dairy Holdings Ltd., The Kraft Heinz Company, Dean Foods, Gujarat Cooperative Milk Marketing Federation Ltd., Nestle S.A., SanCor Cooperatives United Limited, Danone, General Mills

Fortified Dairy Products Market Market Value Analysis

Metric Value
Fortified Dairy Products Market Estimated Value in (2025 E) USD 29.9 billion
Fortified Dairy Products Market Forecast Value in (2035 F) USD 49.4 billion
Forecast CAGR (2025 to 2035) 5.1%

Segmental Analysis

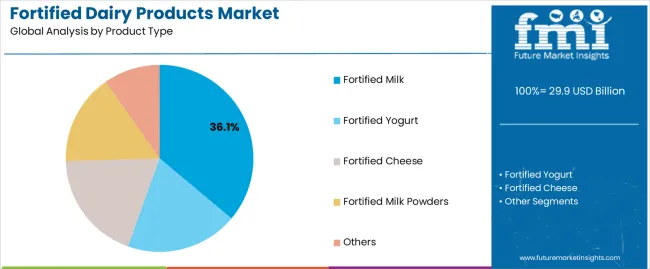
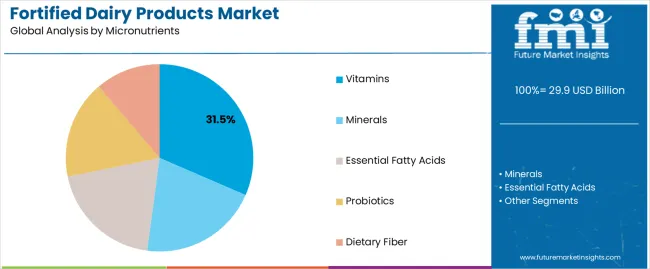
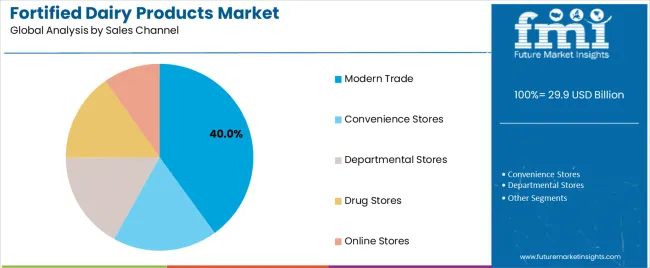
The market is segmented by Product Type, Micronutrients, and Sales Channel and region. By Product Type, the market is divided into Fortified Milk, Fortified Yogurt, Fortified Cheese, Fortified Milk Powders, and Others. In terms of Micronutrients, the market is classified into Vitamins, Minerals, Essential Fatty Acids, Probiotics, and Dietary Fiber. Based on Sales Channel, the market is segmented into Modern Trade, Convenience Stores, Departmental Stores, Drug Stores, and Online Stores. Regionally, the market is classified into North America, Latin America, Western Europe, Eastern Europe, Balkan & Baltic Countries, Russia & Belarus, Central Asia, East Asia, South Asia & Pacific, and the Middle East & Africa.
Insights into the Fortified Milk Product Type Segment

Fortified Dairy Products Market Analysis By Product Type

The fortified milk segment is projected to hold 36.10% of the Fortified Dairy Products market revenue share in 2025, making it the leading product type. This dominance is driven by consumer preference for milk as a daily staple and its suitability as a vehicle for nutrient fortification. Fortified milk provides essential vitamins and minerals in a convenient form, supporting bone health, immunity, and overall wellness.

The segment has benefited from increasing product availability in both liquid and powder forms, catering to diverse consumer needs. Enhanced fortification technologies have improved nutrient stability and taste, further encouraging adoption. Consumer trust in milk as a source of essential nutrients, combined with rising awareness about dietary deficiencies, reinforces the growth of fortified milk.

Retail presence, pricing strategies, and partnerships with health campaigns have also supported its dominant position As health-conscious consumption rises, fortified milk continues to maintain its leading share in the product type segment.
Insights into the Vitamins Micronutrient Segment

Fortified Dairy Products Market Analysis By Micronutrients

The vitamins segment is expected to capture 31.50% of the Fortified Dairy Products market revenue share in 2025, establishing it as the leading micronutrient category. Growth is driven by the increasing awareness of vitamin deficiencies and their impact on health, including immunity and energy metabolism. Fortified dairy products enriched with vitamins offer convenient solutions to meet daily nutritional requirements.

Advances in fortification processes have enhanced vitamin stability and bioavailability, making these products more effective and appealing to consumers. Health-focused campaigns and educational initiatives have further fueled the adoption of vitamin-fortified products.

The segment’s growth is supported by increasing regulatory support and rising demand from urban populations prioritizing preventive health The ease of consumption, combined with the perceived health benefits, ensures that vitamin fortification remains a key driver in the overall market.
Insights into the Modern Trade Sales Channel Segment

Fortified Dairy Products Market Analysis By Sales Channel

The modern trade segment is projected to account for 40.00% of the Fortified Dairy Products market revenue in 2025, making it the leading sales channel. This growth is driven by the expansion of organized retail chains, supermarkets, and hypermarkets, which provide extensive product visibility and easy access for consumers. Modern trade enables the display of a wide variety of fortified dairy products, promoting informed purchase decisions.

Promotional strategies, product bundling, and loyalty programs implemented through modern retail further encourage consumer adoption. The availability of fortified dairy products in high-traffic retail formats ensures convenience and accessibility, particularly in urban regions.

Integration of cold chain logistics and efficient supply networks has enhanced product quality and shelf life, strengthening consumer confidence As organized retail continues to expand, modern trade is expected to remain the dominant channel, driving revenue growth in the Fortified Dairy Products market.

Semi Annual Update

Particular Value CAGR
H1 3.9% (2025 to 2035)
H2 4.5% (2025 to 2035)
H1 4.1% (2025 to 2035)
H2 4.9% (2025 to 2035)

The compounded annual growth rate (CAGR) for fortified dairy products has shown a notable improvement, reflecting an optimistic market trajectory. Primarily, the CAGR for H1 was 3.9 % for the period of 2025 to 2035, which has increased to 4.1% for the period of 2025 to 2035. Similarly, H2 saw an increase from 4.5% (2025 to 2035) to 4.9% (2025 to 2035). This upward trend indicates a significant strengthening in the outlook, which can be attributed to several key factors.

Growing consumer awareness regarding the importance of nutrition and health. Fortified dairy products, enriched with essential vitamins, minerals, and probiotics, cater to this demand by providing enhanced nutritional value compared to non-fortified counterparts. This shift in consumer behavior is driving the increased adoption of fortified dairy products.

Key Industry Highlights

Rising Demand for Vitamin-Fortified Dairy Products

The demand for vitamin-fortified dairy products is experiencing substantial growth as consumers increasingly prioritize their nutritional intake. Vitamin fortification addresses deficiencies common in many populations, particularly those related to vitamins A, D, and E. Fortified milk is a primary product in this category, offering enhanced levels of these essential vitamins.

For instance, vitamin D fortification is crucial for bone health and calcium absorption, making it a key selling point in regions with high incidences of vitamin D deficiency. Vitamin A fortification supports vision and immune health, while vitamin E acts as a powerful antioxidant. Yogurts and cheeses fortified with these vitamins are also gaining popularity, as they provide convenient and tasty options for consumers looking to boost their nutrient intake.

The trend is fueled by increasing health awareness, with consumers seeking products that offer specific health benefits in addition to basic nutrition

Expansion of Probiotic-Fortified Dairy Products

Probiotic-fortified dairy products are witnessing rapid expansion as the link between gut health and overall well-being becomes more widely recognized. These products, particularly yogurts, are fortified with beneficial bacteria such as Lactobacillus acidophilus and Bifidobacterium bifidum, which help promote a healthy digestive system.

The growing consumer interest in probiotics is driven by scientific research highlighting the benefits of a healthy gut microbiome, including enhanced immunity, better digestion, and potential mental health benefits. Companies are responding to this demand by developing new probiotic strains and improved delivery methods that ensure the survival and efficacy of these bacteria in the digestive tract.

This innovation is making probiotic-fortified yogurts more effective and appealing, contributing to their increasing share. Additionally, the introduction of synbiotic products, which combine probiotics with prebiotics (food for the probiotics), is further enhancing the functional benefits offered to consumers.

Increased Availability of Mineral-Fortified Dairy Products

The for mineral-fortified dairy products is expanding, particularly with the fortification of iron, calcium, and iodine. These minerals are essential for various bodily functions and addressing widespread deficiencies is critical for public health. Iron-fortified products, such as milk and cheese, are crucial in combating anemia, especially in developing regions where iron deficiency is prevalent.

These products help in improving hemoglobin levels and reducing the incidence of anemia-related health issues. Calcium-fortified dairy products, including milk, yogurt, and cheese, continue to be in high demand due to their critical role in bone health and preventing osteoporosis. This is particularly important for children and the elderly. Iodine fortification in milk and cheese helps address thyroid-related health issues, such as goiter, by ensuring adequate iodine intake.

As consumer awareness of these health benefits increases, manufacturers are expanding their range of mineral-fortified products to meet the demand. This trend is also supported by government initiatives and regulations aimed at reducing micronutrient deficiencies through food fortification.

2020 to 2024 Global Fortified Dairy Products Sales Analysis Compared to Demand Forecasts for 2025 to 2035

From 2020 to 2025, the global sales of fortified dairy products experienced steady growth of 4.1% which was driven by increasing consumer awareness of the health benefits associated with nutrient-enhanced foods. The industry saw significant advancements in product innovation, with companies introducing a variety of fortified dairy options, including milk, yogurt, cheese, and infant formula enriched with essential vitamins and minerals.

This period also benefited from robust marketing campaigns and greater availability of these products in both developed and emerging regions. However, the growth was somewhat tempered by the high costs associated with fortification processes and the challenges of maintaining product taste and texture. Despite these hurdles, the fortified dairy sector maintained a positive growth trajectory, reflecting a global shift towards healthier eating habits.

Looking in the future to 2025 to 2035, the demand for fortified dairy products is projected to be moderate, with a compound annual growth rate (CAGR) of This optimistic forecast is fueled by several factors, including ongoing advancements in fortification technology, which are expected to lower costs and improve product quality.

Additionally, increasing consumer health consciousness, supportive government policies, and rising incidences of nutrient deficiencies globally will drive the sales. Emerging regions, particularly in Asia-Pacific and Latin America, are anticipated to contribute significantly to this growth due to improving economic conditions and expanding middle-class populations.

Furthermore, the introduction of new fortified products tailored to specific health needs and demographic segments is expected to enhance penetration and consumer adoption. Overall, the fortified dairy products sales are poised for robust expansion, reflecting a growing global emphasis on nutrition and wellness.

Market Concentration

Tier 1 companies, who are key players in the fortified dairy products industry, hold a dominant share of approximately 50-55% globally. These top-tier organizations have large production capacities and provide a wide array of products by utilizing their knowledge of manufacturing and packaging in several formats. They have a large geographic reach and offer a wide range of product offerings.

Tier 2 firms, are mid-tier players with significant income and influence. They usually operate in particular regions and possess between 20-25% of the value share. These medium-sized businesses continue to have a significant presence both domestically and abroad, using their in-depth knowledge of regional markets to exert.

Country-wise Insights

The table below shows sales from sales in key countries, along with estimated growth rates of the Fortified Dairy Products sector.

Countries CAGR (2035)
USA 5.1%
India 6.3%
China 6.0%
Germany 4.1%
Japan 5.5%

USA: Health Consciousness and Aging Population Driving Growth

In the USA, the fortified dairy products market is projected to grow at a CAGR of 5.1% by 2035. This growth is driven by increasing consumer awareness of health and wellness, leading to a higher demand for nutrient-enriched foods. The aging population and the rise in chronic diseases such as osteoporosis and cardiovascular issues are also significant factors, as consumers seek products that offer added health benefits.

Additionally, strong government regulations and initiatives promoting nutritional fortification in food products further boost market growth. The presence of major market players and continuous product innovation also contribute to the expansion of the fortified dairy sector in the USA.

India: Government Initiatives and Urbanization Fuel Expansion

India’s fortified dairy products industry is expected to achieve a CAGR of 6.3% by 2035, driven by growing awareness of nutritional deficiencies and the benefits of fortified foods are key drivers, especially among young and health-conscious consumers. he fortification of milk powder is experiencing significant growth due to the emergence of numerous startups focused on producing fortified milk powder and milk.

These innovative companies are leveraging advanced technologies and innovative approaches to meet the rising demand for nutrient-enriched dairy products, enhancing accessibility and availability across the country

China: E-Commerce and Nutritional Awareness Boost Sales

In China, the fortified dairy products sales are anticipated to grow at a CAGR of 6.0% by 2035. The primary drivers include rising health consciousness among consumers and an increasing focus on improving dietary quality. Government policies are trying to reduce nutrient deficiencies and promoting public health play a crucial role in market growth.

The Chinese market also benefits from the rapid development of e-commerce platforms, which provide easier access to a wide range of fortified dairy products. The presence of international dairy brands and their efforts to introduce innovative and high-quality fortified products cater to the growing demand for health-enhancing food options.

Category-Wise Insights

Intensifying Demand for Fortified Milk Powder from infant and young ones

Segment Product Type - Fortified Milk Powders
Value Share (2025) 36.1%

Fortified milk powders are designed to address the specific nutritional needs of these age groups, ensuring adequate intake of essential vitamins and minerals that are crucial for their growth and development. As a result, this segment is projected to hold a significant value share of 36.1% by 2025.

These products often contain added nutrients such as calcium, vitamin D, iron, and DHA, which are vital for bone health, cognitive development, and overall growth. The rise in health consciousness among parents, coupled with greater awareness of the long-term benefits of proper nutrition during early childhood, is driving this demand.

Overall, the fortified milk powder segment's substantial value share reflects the increasing prioritization of infant and child nutrition, highlighting a significant growth area within the fortified dairy products

Global Surge in Fortified Dairy Products Enriched with Vitamins

Segment Micronutrients - Vitamins
Value Share (2025) 31.5%

Fortified dairy products enriched with vitamins is experiencing extensive growth, with this segment projected to hold a value share of 31.5% by 2025. This growth is driven by a widespread consumer shift towards healthier dietary choices, driven by increasing awareness of the health benefits associated with vitamin intake.

Fortified dairy products, including milk, yogurt, and cheese, are being increasingly enriched with essential vitamins such as A, D, E, and B-complex, which play critical roles in immune function, bone health, and overall wellness. This trend is particularly pronounced in developed markets where consumers are more health-conscious and willing to invest in premium, health-enhancing food products.

Emerging markets are also contributing significantly to the growth of this segment. The presence of global dairy giants and local companies alike, introducing innovative products and expanding their fortified product lines, further boosts the market. Overall, the increasing demand for vitamin-enriched dairy products underscores the global trend towards preventive healthcare and the growing emphasis on nutrition.
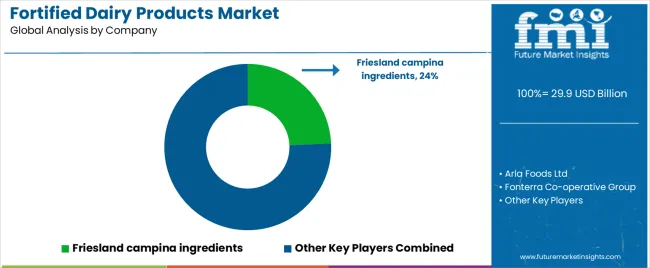
Competition Outlook

Fortified Dairy Products Market Analysis By Company

The Fortified Dairy Products industry is highly competitive, with top players controlling substantial shares with their wide range of product offers and large manufacturing capabilities. Tier 1 businesses, which include titans of the players featured in the report are Arla Foods Ltd, Fonterra Co-operative Group, FrieslandCampina, Guangming Dairy Co., Ltd., China Modern Dairy Holdings Ltd., The Kraft Heinz Company, Dean Foods, Gujarat Cooperative Milk Marketing Federation Ltd., Nestle S.A., SanCor Cooperatives United Limited, Danone, General Mills

These businesses provide a broad range of applications in the food and beverage sector by utilizing their extensive experience, cutting-edge technologies, and extensive product lines. Their devoted clientele and robust geographic reach serve to further solidify their position as the industry leaders.

Leading Fortified Dairy Products Brands

  • Arla Foods Ltd
  • Fonterra Co-operative Group
  • FrieslandCampina
  • Guangming Dairy Co., Ltd.
  • China Modern Dairy Holdings Ltd.
  • The Kraft Heinz Company
  • Dean Foods
  • Gujarat Cooperative Milk Marketing Federation Ltd.
  • Nestle S.A.
  • SanCor Cooperatives United Limited
  • Danone
  • General Mills
  • Others

Key Segments of Research Report

By Product Type:

As per Product Type, the industry has been categorized into Fortified Milk, Fortified Yogurt, Fortified Cheese, Fortified Milk Powders and Others (Butter and Margarine)

By Micronutrients:

As per the End Use, the industry is sub-segmented into Vitamins, Minerals, Essential Fatty Acids, Probiotics, Dietary Fiber

By Sales Channel:

Modern Trade, Convenience Stores, Departmental Stores, Drug Stores, Online Stores Channel are key channels selling the products

By Region:

Industry analysis has been carried out in key countries of the regions such as North America, Latin America, Europe, East Asia, South Asia, Oceania, and the Middle East & Africa.

Frequently Asked Questions

How big is the fortified dairy products market in 2025?

The global fortified dairy products market is estimated to be valued at USD 29.9 billion in 2025.

What will be the size of fortified dairy products market in 2035?

The market size for the fortified dairy products market is projected to reach USD 49.4 billion by 2035.

How much will be the fortified dairy products market growth between 2025 and 2035?

The fortified dairy products market is expected to grow at a 5.1% CAGR between 2025 and 2035.

What are the key product types in the fortified dairy products market?

The key product types in fortified dairy products market are fortified milk, fortified yogurt, fortified cheese, fortified milk powders and others.

Which micronutrients segment to contribute significant share in the fortified dairy products market in 2025?

In terms of micronutrients, vitamins segment to command 31.5% share in the fortified dairy products market in 2025.

Table of Content

  1. Executive Summary
    • Global Market Outlook
    • Demand-side Trends
    • Supply-side Trends
    • Technology Roadmap Analysis
    • Analysis and Recommendations
  2. Market Overview
    • Market Coverage / Taxonomy
    • Market Definition / Scope / Limitations
  3. Market Background
    • Market Dynamics
      • Drivers
      • Restraints
      • Opportunity
      • Trends
    • Scenario Forecast
      • Demand in Optimistic Scenario
      • Demand in Likely Scenario
      • Demand in Conservative Scenario
    • Opportunity Map Analysis
    • Product Life Cycle Analysis
    • Supply Chain Analysis
    • Investment Feasibility Matrix
    • Value Chain Analysis
    • PESTLE and Porter’s Analysis
    • Regulatory Landscape
    • Regional Parent Market Outlook
    • Production and Consumption Statistics
    • Import and Export Statistics
  4. Global Market Analysis 2020 to 2024 and Forecast, 2025 to 2035
    • Historical Market Size Value (USD Million) Analysis, 2020 to 2024
    • Current and Future Market Size Value (USD Million) Projections, 2025 to 2035
      • Y-o-Y Growth Trend Analysis
      • Absolute $ Opportunity Analysis
  5. Global Market Pricing Analysis 2020 to 2024 and Forecast 2025 to 2035
  6. Global Market Analysis 2020 to 2024 and Forecast 2025 to 2035, By Product Type
    • Introduction / Key Findings
    • Historical Market Size Value (USD Million) Analysis By Product Type , 2020 to 2024
    • Current and Future Market Size Value (USD Million) Analysis and Forecast By Product Type , 2025 to 2035
      • Fortified Milk
      • Fortified Yogurt
      • Fortified Cheese
      • Fortified Milk Powders
      • Others
    • Y-o-Y Growth Trend Analysis By Product Type , 2020 to 2024
    • Absolute $ Opportunity Analysis By Product Type , 2025 to 2035
  7. Global Market Analysis 2020 to 2024 and Forecast 2025 to 2035, By Micronutrients
    • Introduction / Key Findings
    • Historical Market Size Value (USD Million) Analysis By Micronutrients, 2020 to 2024
    • Current and Future Market Size Value (USD Million) Analysis and Forecast By Micronutrients, 2025 to 2035
      • Vitamins
      • Minerals
      • Essential Fatty Acids
      • Probiotics
      • Dietary Fiber
    • Y-o-Y Growth Trend Analysis By Micronutrients, 2020 to 2024
    • Absolute $ Opportunity Analysis By Micronutrients, 2025 to 2035
  8. Global Market Analysis 2020 to 2024 and Forecast 2025 to 2035, By Sales Channel
    • Introduction / Key Findings
    • Historical Market Size Value (USD Million) Analysis By Sales Channel, 2020 to 2024
    • Current and Future Market Size Value (USD Million) Analysis and Forecast By Sales Channel, 2025 to 2035
      • Modern Trade
      • Convenience Stores
      • Departmental Stores
      • Drug Stores
      • Online Stores
    • Y-o-Y Growth Trend Analysis By Sales Channel, 2020 to 2024
    • Absolute $ Opportunity Analysis By Sales Channel, 2025 to 2035
  9. Global Market Analysis 2020 to 2024 and Forecast 2025 to 2035, By Region
    • Introduction
    • Historical Market Size Value (USD Million) Analysis By Region, 2020 to 2024
    • Current Market Size Value (USD Million) Analysis and Forecast By Region, 2025 to 2035
      • North America
      • Latin America
      • Western Europe
      • Eastern Europe
      • East Asia
      • South Asia and Pacific
      • Middle East & Africa
    • Market Attractiveness Analysis By Region
  10. North America Market Analysis 2020 to 2024 and Forecast 2025 to 2035, By Country
    • Historical Market Size Value (USD Million) Trend Analysis By Market Taxonomy, 2020 to 2024
    • Market Size Value (USD Million) Forecast By Market Taxonomy, 2025 to 2035
      • By Country
        • USA
        • Canada
        • Mexico
      • By Product Type
      • By Micronutrients
      • By Sales Channel
    • Market Attractiveness Analysis
      • By Country
      • By Product Type
      • By Micronutrients
      • By Sales Channel
    • Key Takeaways
  11. Latin America Market Analysis 2020 to 2024 and Forecast 2025 to 2035, By Country
    • Historical Market Size Value (USD Million) Trend Analysis By Market Taxonomy, 2020 to 2024
    • Market Size Value (USD Million) Forecast By Market Taxonomy, 2025 to 2035
      • By Country
        • Brazil
        • Chile
        • Rest of Latin America
      • By Product Type
      • By Micronutrients
      • By Sales Channel
    • Market Attractiveness Analysis
      • By Country
      • By Product Type
      • By Micronutrients
      • By Sales Channel
    • Key Takeaways
  12. Western Europe Market Analysis 2020 to 2024 and Forecast 2025 to 2035, By Country
    • Historical Market Size Value (USD Million) Trend Analysis By Market Taxonomy, 2020 to 2024
    • Market Size Value (USD Million) Forecast By Market Taxonomy, 2025 to 2035
      • By Country
        • Germany
        • UK
        • Italy
        • Spain
        • France
        • Nordic
        • BENELUX
        • Rest of Western Europe
      • By Product Type
      • By Micronutrients
      • By Sales Channel
    • Market Attractiveness Analysis
      • By Country
      • By Product Type
      • By Micronutrients
      • By Sales Channel
    • Key Takeaways
  13. Eastern Europe Market Analysis 2020 to 2024 and Forecast 2025 to 2035, By Country
    • Historical Market Size Value (USD Million) Trend Analysis By Market Taxonomy, 2020 to 2024
    • Market Size Value (USD Million) Forecast By Market Taxonomy, 2025 to 2035
      • By Country
        • Russia
        • Poland
        • Hungary
        • Balkan & Baltic
        • Rest of Eastern Europe
      • By Product Type
      • By Micronutrients
      • By Sales Channel
    • Market Attractiveness Analysis
      • By Country
      • By Product Type
      • By Micronutrients
      • By Sales Channel
    • Key Takeaways
  14. East Asia Market Analysis 2020 to 2024 and Forecast 2025 to 2035, By Country
    • Historical Market Size Value (USD Million) Trend Analysis By Market Taxonomy, 2020 to 2024
    • Market Size Value (USD Million) Forecast By Market Taxonomy, 2025 to 2035
      • By Country
        • China
        • Japan
        • South Korea
      • By Product Type
      • By Micronutrients
      • By Sales Channel
    • Market Attractiveness Analysis
      • By Country
      • By Product Type
      • By Micronutrients
      • By Sales Channel
    • Key Takeaways
  15. South Asia and Pacific Market Analysis 2020 to 2024 and Forecast 2025 to 2035, By Country
    • Historical Market Size Value (USD Million) Trend Analysis By Market Taxonomy, 2020 to 2024
    • Market Size Value (USD Million) Forecast By Market Taxonomy, 2025 to 2035
      • By Country
        • India
        • ASEAN
        • Australia & New Zealand
        • Rest of South Asia and Pacific
      • By Product Type
      • By Micronutrients
      • By Sales Channel
    • Market Attractiveness Analysis
      • By Country
      • By Product Type
      • By Micronutrients
      • By Sales Channel
    • Key Takeaways
  16. Middle East & Africa Market Analysis 2020 to 2024 and Forecast 2025 to 2035, By Country
    • Historical Market Size Value (USD Million) Trend Analysis By Market Taxonomy, 2020 to 2024
    • Market Size Value (USD Million) Forecast By Market Taxonomy, 2025 to 2035
      • By Country
        • Kingdom of Saudi Arabia
        • Other GCC Countries
        • Turkiye
        • South Africa
        • Other African Union
        • Rest of Middle East & Africa
      • By Product Type
      • By Micronutrients
      • By Sales Channel
    • Market Attractiveness Analysis
      • By Country
      • By Product Type
      • By Micronutrients
      • By Sales Channel
    • Key Takeaways
  17. Key Countries Market Analysis
    • USA
      • Pricing Analysis
      • Market Share Analysis, 2024
        • By Product Type
        • By Micronutrients
        • By Sales Channel
    • Canada
      • Pricing Analysis
      • Market Share Analysis, 2024
        • By Product Type
        • By Micronutrients
        • By Sales Channel
    • Mexico
      • Pricing Analysis
      • Market Share Analysis, 2024
        • By Product Type
        • By Micronutrients
        • By Sales Channel
    • Brazil
      • Pricing Analysis
      • Market Share Analysis, 2024
        • By Product Type
        • By Micronutrients
        • By Sales Channel
    • Chile
      • Pricing Analysis
      • Market Share Analysis, 2024
        • By Product Type
        • By Micronutrients
        • By Sales Channel
    • Germany
      • Pricing Analysis
      • Market Share Analysis, 2024
        • By Product Type
        • By Micronutrients
        • By Sales Channel
    • UK
      • Pricing Analysis
      • Market Share Analysis, 2024
        • By Product Type
        • By Micronutrients
        • By Sales Channel
    • Italy
      • Pricing Analysis
      • Market Share Analysis, 2024
        • By Product Type
        • By Micronutrients
        • By Sales Channel
    • Spain
      • Pricing Analysis
      • Market Share Analysis, 2024
        • By Product Type
        • By Micronutrients
        • By Sales Channel
    • France
      • Pricing Analysis
      • Market Share Analysis, 2024
        • By Product Type
        • By Micronutrients
        • By Sales Channel
    • India
      • Pricing Analysis
      • Market Share Analysis, 2024
        • By Product Type
        • By Micronutrients
        • By Sales Channel
    • ASEAN
      • Pricing Analysis
      • Market Share Analysis, 2024
        • By Product Type
        • By Micronutrients
        • By Sales Channel
    • Australia & New Zealand
      • Pricing Analysis
      • Market Share Analysis, 2024
        • By Product Type
        • By Micronutrients
        • By Sales Channel
    • China
      • Pricing Analysis
      • Market Share Analysis, 2024
        • By Product Type
        • By Micronutrients
        • By Sales Channel
    • Japan
      • Pricing Analysis
      • Market Share Analysis, 2024
        • By Product Type
        • By Micronutrients
        • By Sales Channel
    • South Korea
      • Pricing Analysis
      • Market Share Analysis, 2024
        • By Product Type
        • By Micronutrients
        • By Sales Channel
    • Russia
      • Pricing Analysis
      • Market Share Analysis, 2024
        • By Product Type
        • By Micronutrients
        • By Sales Channel
    • Poland
      • Pricing Analysis
      • Market Share Analysis, 2024
        • By Product Type
        • By Micronutrients
        • By Sales Channel
    • Hungary
      • Pricing Analysis
      • Market Share Analysis, 2024
        • By Product Type
        • By Micronutrients
        • By Sales Channel
    • Kingdom of Saudi Arabia
      • Pricing Analysis
      • Market Share Analysis, 2024
        • By Product Type
        • By Micronutrients
        • By Sales Channel
    • Turkiye
      • Pricing Analysis
      • Market Share Analysis, 2024
        • By Product Type
        • By Micronutrients
        • By Sales Channel
    • South Africa
      • Pricing Analysis
      • Market Share Analysis, 2024
        • By Product Type
        • By Micronutrients
        • By Sales Channel
  18. Market Structure Analysis
    • Competition Dashboard
    • Competition Benchmarking
    • Market Share Analysis of Top Players
      • By Regional
      • By Product Type
      • By Micronutrients
      • By Sales Channel
  19. Competition Analysis
    • Competition Deep Dive
      • Friesland campina ingredients
        • Overview
        • Product Portfolio
        • Profitability by Market Segments (Product/Age /Sales Channel/Region)
        • Sales Footprint
        • Strategy Overview
          • Marketing Strategy
          • Product Strategy
          • Channel Strategy
      • Arla Foods Ltd
      • Fonterra Co-operative Group
      • FrieslandCampina
      • Guangming Dairy Co., Ltd.
      • China Modern Dairy Holdings Ltd.
      • The Kraft Heinz Company
      • Dean Foods
      • Gujarat Cooperative Milk Marketing Federation Ltd.
      • Nestle S.A.
      • SanCor Cooperatives Value (USD Million)ed Limited
      • Danone
      • General Mills
  20. Assumptions & Acronyms Used
  21. Research Methodology

List of Tables

  • Table 1: Global Market Value (USD Million) Forecast by Region, 2020 to 2035
  • Table 2: Global Market Value (USD Million) Forecast by Product Type , 2020 to 2035
  • Table 3: Global Market Value (USD Million) Forecast by Micronutrients, 2020 to 2035
  • Table 4: Global Market Value (USD Million) Forecast by Sales Channel, 2020 to 2035
  • Table 5: North America Market Value (USD Million) Forecast by Country, 2020 to 2035
  • Table 6: North America Market Value (USD Million) Forecast by Product Type , 2020 to 2035
  • Table 7: North America Market Value (USD Million) Forecast by Micronutrients, 2020 to 2035
  • Table 8: North America Market Value (USD Million) Forecast by Sales Channel, 2020 to 2035
  • Table 9: Latin America Market Value (USD Million) Forecast by Country, 2020 to 2035
  • Table 10: Latin America Market Value (USD Million) Forecast by Product Type , 2020 to 2035
  • Table 11: Latin America Market Value (USD Million) Forecast by Micronutrients, 2020 to 2035
  • Table 12: Latin America Market Value (USD Million) Forecast by Sales Channel, 2020 to 2035
  • Table 13: Western Europe Market Value (USD Million) Forecast by Country, 2020 to 2035
  • Table 14: Western Europe Market Value (USD Million) Forecast by Product Type , 2020 to 2035
  • Table 15: Western Europe Market Value (USD Million) Forecast by Micronutrients, 2020 to 2035
  • Table 16: Western Europe Market Value (USD Million) Forecast by Sales Channel, 2020 to 2035
  • Table 17: Eastern Europe Market Value (USD Million) Forecast by Country, 2020 to 2035
  • Table 18: Eastern Europe Market Value (USD Million) Forecast by Product Type , 2020 to 2035
  • Table 19: Eastern Europe Market Value (USD Million) Forecast by Micronutrients, 2020 to 2035
  • Table 20: Eastern Europe Market Value (USD Million) Forecast by Sales Channel, 2020 to 2035
  • Table 21: East Asia Market Value (USD Million) Forecast by Country, 2020 to 2035
  • Table 22: East Asia Market Value (USD Million) Forecast by Product Type , 2020 to 2035
  • Table 23: East Asia Market Value (USD Million) Forecast by Micronutrients, 2020 to 2035
  • Table 24: East Asia Market Value (USD Million) Forecast by Sales Channel, 2020 to 2035
  • Table 25: South Asia and Pacific Market Value (USD Million) Forecast by Country, 2020 to 2035
  • Table 26: South Asia and Pacific Market Value (USD Million) Forecast by Product Type , 2020 to 2035
  • Table 27: South Asia and Pacific Market Value (USD Million) Forecast by Micronutrients, 2020 to 2035
  • Table 28: South Asia and Pacific Market Value (USD Million) Forecast by Sales Channel, 2020 to 2035
  • Table 29: Middle East & Africa Market Value (USD Million) Forecast by Country, 2020 to 2035
  • Table 30: Middle East & Africa Market Value (USD Million) Forecast by Product Type , 2020 to 2035
  • Table 31: Middle East & Africa Market Value (USD Million) Forecast by Micronutrients, 2020 to 2035
  • Table 32: Middle East & Africa Market Value (USD Million) Forecast by Sales Channel, 2020 to 2035

List of Figures

  • Figure 1: Global Market Pricing Analysis
  • Figure 2: Global Market Value (USD Million) Forecast 2020-2035
  • Figure 3: Global Market Value Share and BPS Analysis by Product Type , 2025 and 2035
  • Figure 4: Global Market Y-o-Y Growth Comparison by Product Type , 2025-2035
  • Figure 5: Global Market Attractiveness Analysis by Product Type
  • Figure 6: Global Market Value Share and BPS Analysis by Micronutrients, 2025 and 2035
  • Figure 7: Global Market Y-o-Y Growth Comparison by Micronutrients, 2025-2035
  • Figure 8: Global Market Attractiveness Analysis by Micronutrients
  • Figure 9: Global Market Value Share and BPS Analysis by Sales Channel, 2025 and 2035
  • Figure 10: Global Market Y-o-Y Growth Comparison by Sales Channel, 2025-2035
  • Figure 11: Global Market Attractiveness Analysis by Sales Channel
  • Figure 12: Global Market Value (USD Million) Share and BPS Analysis by Region, 2025 and 2035
  • Figure 13: Global Market Y-o-Y Growth Comparison by Region, 2025-2035
  • Figure 14: Global Market Attractiveness Analysis by Region
  • Figure 15: North America Market Incremental Dollar Opportunity, 2025-2035
  • Figure 16: Latin America Market Incremental Dollar Opportunity, 2025-2035
  • Figure 17: Western Europe Market Incremental Dollar Opportunity, 2025-2035
  • Figure 18: Eastern Europe Market Incremental Dollar Opportunity, 2025-2035
  • Figure 19: East Asia Market Incremental Dollar Opportunity, 2025-2035
  • Figure 20: South Asia and Pacific Market Incremental Dollar Opportunity, 2025-2035
  • Figure 21: Middle East & Africa Market Incremental Dollar Opportunity, 2025-2035
  • Figure 22: North America Market Value Share and BPS Analysis by Country, 2025 and 2035
  • Figure 23: North America Market Value Share and BPS Analysis by Product Type , 2025 and 2035
  • Figure 24: North America Market Y-o-Y Growth Comparison by Product Type , 2025-2035
  • Figure 25: North America Market Attractiveness Analysis by Product Type
  • Figure 26: North America Market Value Share and BPS Analysis by Micronutrients, 2025 and 2035
  • Figure 27: North America Market Y-o-Y Growth Comparison by Micronutrients, 2025-2035
  • Figure 28: North America Market Attractiveness Analysis by Micronutrients
  • Figure 29: North America Market Value Share and BPS Analysis by Sales Channel, 2025 and 2035
  • Figure 30: North America Market Y-o-Y Growth Comparison by Sales Channel, 2025-2035
  • Figure 31: North America Market Attractiveness Analysis by Sales Channel
  • Figure 32: Latin America Market Value Share and BPS Analysis by Country, 2025 and 2035
  • Figure 33: Latin America Market Value Share and BPS Analysis by Product Type , 2025 and 2035
  • Figure 34: Latin America Market Y-o-Y Growth Comparison by Product Type , 2025-2035
  • Figure 35: Latin America Market Attractiveness Analysis by Product Type
  • Figure 36: Latin America Market Value Share and BPS Analysis by Micronutrients, 2025 and 2035
  • Figure 37: Latin America Market Y-o-Y Growth Comparison by Micronutrients, 2025-2035
  • Figure 38: Latin America Market Attractiveness Analysis by Micronutrients
  • Figure 39: Latin America Market Value Share and BPS Analysis by Sales Channel, 2025 and 2035
  • Figure 40: Latin America Market Y-o-Y Growth Comparison by Sales Channel, 2025-2035
  • Figure 41: Latin America Market Attractiveness Analysis by Sales Channel
  • Figure 42: Western Europe Market Value Share and BPS Analysis by Country, 2025 and 2035
  • Figure 43: Western Europe Market Value Share and BPS Analysis by Product Type , 2025 and 2035
  • Figure 44: Western Europe Market Y-o-Y Growth Comparison by Product Type , 2025-2035
  • Figure 45: Western Europe Market Attractiveness Analysis by Product Type
  • Figure 46: Western Europe Market Value Share and BPS Analysis by Micronutrients, 2025 and 2035
  • Figure 47: Western Europe Market Y-o-Y Growth Comparison by Micronutrients, 2025-2035
  • Figure 48: Western Europe Market Attractiveness Analysis by Micronutrients
  • Figure 49: Western Europe Market Value Share and BPS Analysis by Sales Channel, 2025 and 2035
  • Figure 50: Western Europe Market Y-o-Y Growth Comparison by Sales Channel, 2025-2035
  • Figure 51: Western Europe Market Attractiveness Analysis by Sales Channel
  • Figure 52: Eastern Europe Market Value Share and BPS Analysis by Country, 2025 and 2035
  • Figure 53: Eastern Europe Market Value Share and BPS Analysis by Product Type , 2025 and 2035
  • Figure 54: Eastern Europe Market Y-o-Y Growth Comparison by Product Type , 2025-2035
  • Figure 55: Eastern Europe Market Attractiveness Analysis by Product Type
  • Figure 56: Eastern Europe Market Value Share and BPS Analysis by Micronutrients, 2025 and 2035
  • Figure 57: Eastern Europe Market Y-o-Y Growth Comparison by Micronutrients, 2025-2035
  • Figure 58: Eastern Europe Market Attractiveness Analysis by Micronutrients
  • Figure 59: Eastern Europe Market Value Share and BPS Analysis by Sales Channel, 2025 and 2035
  • Figure 60: Eastern Europe Market Y-o-Y Growth Comparison by Sales Channel, 2025-2035
  • Figure 61: Eastern Europe Market Attractiveness Analysis by Sales Channel
  • Figure 62: East Asia Market Value Share and BPS Analysis by Country, 2025 and 2035
  • Figure 63: East Asia Market Value Share and BPS Analysis by Product Type , 2025 and 2035
  • Figure 64: East Asia Market Y-o-Y Growth Comparison by Product Type , 2025-2035
  • Figure 65: East Asia Market Attractiveness Analysis by Product Type
  • Figure 66: East Asia Market Value Share and BPS Analysis by Micronutrients, 2025 and 2035
  • Figure 67: East Asia Market Y-o-Y Growth Comparison by Micronutrients, 2025-2035
  • Figure 68: East Asia Market Attractiveness Analysis by Micronutrients
  • Figure 69: East Asia Market Value Share and BPS Analysis by Sales Channel, 2025 and 2035
  • Figure 70: East Asia Market Y-o-Y Growth Comparison by Sales Channel, 2025-2035
  • Figure 71: East Asia Market Attractiveness Analysis by Sales Channel
  • Figure 72: South Asia and Pacific Market Value Share and BPS Analysis by Country, 2025 and 2035
  • Figure 73: South Asia and Pacific Market Value Share and BPS Analysis by Product Type , 2025 and 2035
  • Figure 74: South Asia and Pacific Market Y-o-Y Growth Comparison by Product Type , 2025-2035
  • Figure 75: South Asia and Pacific Market Attractiveness Analysis by Product Type
  • Figure 76: South Asia and Pacific Market Value Share and BPS Analysis by Micronutrients, 2025 and 2035
  • Figure 77: South Asia and Pacific Market Y-o-Y Growth Comparison by Micronutrients, 2025-2035
  • Figure 78: South Asia and Pacific Market Attractiveness Analysis by Micronutrients
  • Figure 79: South Asia and Pacific Market Value Share and BPS Analysis by Sales Channel, 2025 and 2035
  • Figure 80: South Asia and Pacific Market Y-o-Y Growth Comparison by Sales Channel, 2025-2035
  • Figure 81: South Asia and Pacific Market Attractiveness Analysis by Sales Channel
  • Figure 82: Middle East & Africa Market Value Share and BPS Analysis by Country, 2025 and 2035
  • Figure 83: Middle East & Africa Market Value Share and BPS Analysis by Product Type , 2025 and 2035
  • Figure 84: Middle East & Africa Market Y-o-Y Growth Comparison by Product Type , 2025-2035
  • Figure 85: Middle East & Africa Market Attractiveness Analysis by Product Type
  • Figure 86: Middle East & Africa Market Value Share and BPS Analysis by Micronutrients, 2025 and 2035
  • Figure 87: Middle East & Africa Market Y-o-Y Growth Comparison by Micronutrients, 2025-2035
  • Figure 88: Middle East & Africa Market Attractiveness Analysis by Micronutrients
  • Figure 89: Middle East & Africa Market Value Share and BPS Analysis by Sales Channel, 2025 and 2035
  • Figure 90: Middle East & Africa Market Y-o-Y Growth Comparison by Sales Channel, 2025-2035
  • Figure 91: Middle East & Africa Market Attractiveness Analysis by Sales Channel
  • Figure 92: Global Market - Tier Structure Analysis
  • Figure 93: Global Market - Company Share Analysis
Dashboard
Dashboard
Dashboard
Dashboard
Dashboard
Dashboard

Full Research Suite comprises of:

Market outlook & trends analysis

Market outlook & trends analysis

Interviews & case studies

Interviews & case studies

Strategic recommendations

Strategic recommendations

Vendor profiles & capabilities analysis

Vendor profiles & capabilities analysis

5-year forecasts

5-year forecasts

8 regions and 60+ country-level data splits

8 regions and 60+ country-level data splits

Market segment data splits

Market segment data splits

12 months of continuous data updates

12 months of continuous data updates

DELIVERED AS:

PDF EXCEL ONLINE

Full Research Suite


$3500

$5000

$6500

Buy Report Now
Similar Industry Reports

Similar Industry Reports

Fortified Rice Market

Fortified Rice Market Size and Share Forecast Outlook 2025 to 2035

Fortified Eggs Market

Fortified Eggs Market Analysis - Size, Growth, and Forecast 2025 to 2035

Fortified Pet Food Market

Fortified Pet Food Market Analysis by Form, Pet Type, and Distribution Channel Through 2035

Fortified Foods Market

Fortified Foods Market Analysis by Raw Material, Micronutrients, Application, Technology, Sales Channel, and Region from 2025 to 2035

Fortified Yeast Market

Fortified Yeast Market Outlook - Growth, Demand & Forecast 2024 to 2034

Fortified Wine Market

Fortified Wine Market

Fortified Milk and Milk Products Market

Fortified Milk and Milk Products Market Analysis - Size, Share, & Forecast Outlook 2025 to 2035

Dairy Product Packaging Market

Dairy Product Packaging Market Size and Share Forecast Outlook 2025 to 2035

Dairy Container Market

Dairy Container Market Analysis Size and Share Forecast Outlook 2025 to 2035

Dairy Packaging Market

Dairy Packaging Market Size and Share Forecast Outlook 2025 to 2035

Dairy Packaging Machine Market

Dairy Packaging Machine Market Size and Share Forecast Outlook 2025 to 2035

Dairy Alternatives Market

Dairy Alternatives Market Analysis - Size, Share, and Forecast Outlook 2025 to 2035

Dairy Filtration Systems Market

Dairy Filtration Systems Market Size and Share Forecast Outlook 2025 to 2035

Dairy Ingredients Market

Dairy Ingredients Market Size and Share Forecast Outlook 2025 to 2035

Dairy Concentrate Market

Dairy Concentrate Market Forecast and Outlook 2025 to 2035

Dairy Testing Services Market

Dairy Testing Services Market Analysis - Size, Share, & Forecast Outlook 2025 to 2035

Dairy-Free Smoothies Market

Dairy-Free Smoothies Market Analysis - Size, Share, and Forecast Outlook 2025 to 2035

Dairy-Based Dressings Market

Dairy-Based Dressings Market Analysis - Size, Share, and Forecast Outlook 2025 to 2035

Dairy-Free Spreads Market

Dairy-Free Spreads Market Analysis - Size, Share, and Forecast Outlook 2025 to 2035

Dairy Blends Market
Dairy Blends Market

Dairy Blends Market Analysis - Size, Share, and Forecast Outlook 2025 to 2035

Future Market Insights

Fortified Dairy Products Market

Chat With MaRIA

Chat With

MaRIA

Hi There, I am MaRIA, Your Market Research Intelligence Assistant. How may I help you?