
- Market Size (2026)
- USD 271.8 Mn
- Forecast (2036)
- USD 806.9 Mn
- CAGR (2026 to 2036)
- 11.5%
How big is Fortified Yeast Market in 2026?
The fortified yeast market is valued at USD 271.8 million in 2026 and is projected to reach USD 806.9 million by 2036, growing at a 11.5% CAGR.
Food and supplement makers are inclining more toward fortified yeast because it combines nutrients with a familiar dry ingredient. Product teams choose the nutrient grade, then compare its assay with the dose they plan for the finished product. These applications use dry blending and need few changes to existing production steps. In March 2026, Lallemand described Lalmin vitamin- and mineral-enriched yeasts for fortified foods and health applications. Lalmin gives product teams several nutrient routes, and each grade needs approval for its exact use. Food applications add another hurdle because taste, color, and nutrient strength must remain acceptable in the finished recipe.
Food fortification rules differ across countries, so the same yeast grade faces different approval checks. France places particular focus on the accuracy of the nutrient amount shown on the label. In November 2025, DGCCRF reported that 27 of 45 children's supplements tested were noncompliant. The agency said 90% of those failures involved differences between labeled and measured vitamin or mineral content. The French finding matters for fortified yeast because the supplier's assay supports the finished nutrient claim. Italy requires a separate notification for each supplement, while Great Britain focuses on safety and label responsibility.
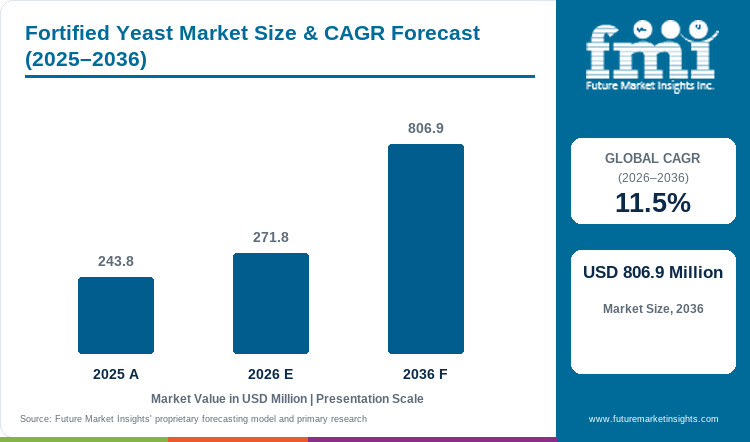
Key Takeaways of Fortified Yeast Market
- Food and supplement makers use fortified yeast to add measured vitamins or minerals through a familiar yeast ingredient.
- Vitamin-fortified yeast holds 27.7% of product type in 2026 as brands use different grades for different vitamin needs.
- Dietary supplements lead end use application with 34.2% share in 2026 since fixed servings make nutrient dosing easier to control.
- Powder accounts for 41.7% of form in 2026 because plants blend, sample, and test each lot before use.
- Nutrition rules link the nutrient form and measured strength to the finished label, so brands need reliable assay records before approval.
- Lesaffre, Lallemand, Angel Yeast Co., AB Mauri, Leiber GmbH, and Alltech serve food, supplement, feed, or pet uses.
Analyst Perspective
"Food brands are likely to use fortified yeast in more everyday products as they look for familiar nutrient sources. Manufacturers need assay, taste, and label evidence early because wider food use creates more qualification work than supplements."
- Nandini Roy Choudhury, Principal Consultant, Future Market Insights
How is the Fortified Yeast Market segmented?
The fortified yeast market is segmented by Product Type, End Use Application, Form, and Region.
The fortified yeast market uses three segment axes with region as the geographic split.
Product type covers vitamin-fortified yeast (vitamin B, folic acid, vitamin D, vitamin E) and mineral-fortified yeast (selenium, zinc, iron, chromium, and other minerals).
End use application covers dietary supplements, plant-based food, vegan-based food, pharmaceuticals, pet food, dairy products, and cosmetics and personal care.
Form covers powder, flakes, tablet, and capsule.
Why do formulators choose Vitamin-Fortified Yeast across food and supplement programs?
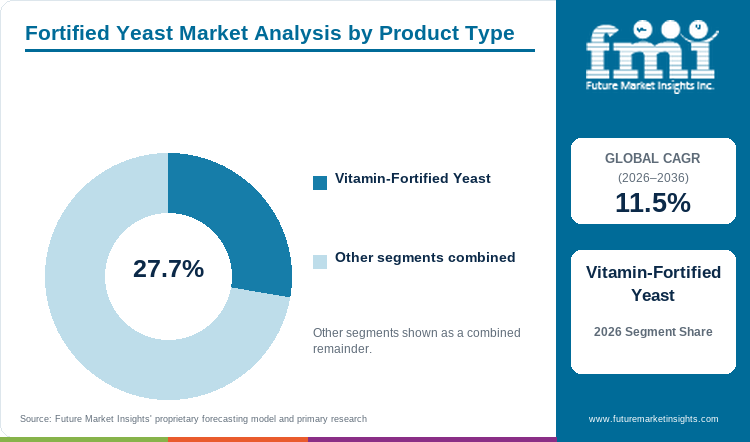
Vitamin-fortified yeast gives product teams several vitamin choices while plants keep the same dry-ingredient handling steps. B-vitamin and vitamin D grades support different label needs in foods and vitamin supplements. Teams compare the measured vitamin level with the dose they plan for each product. Food products need acceptable taste and color, while many supplement formats place fewer limits on those features. The grade range lets teams choose the right vitamin source while keeping the same basic production steps.
- Vitamin-fortified yeast is expected to lead the product type category with 27.7% share in 2026. Different vitamin yeast grades let teams match the vitamin source to each food or supplement.
- In March 2026, Gnosis by Lesaffre published guidance on the bioavailability of enriched nutritional yeasts, covering how different nutrient forms in vitamin- and mineral-fortified yeast grades affect absorption. The guidance gives formulators technical evidence for selecting yeast grades and linking nutrient form to finished-product claims.
Why do set serving sizes favor Dietary Supplements for fortified yeast?
Dietary supplements give fortified yeast a fixed serving size for each dose. Product teams use that fixed amount to calculate and control each nutrient dose. Tablets, capsules, and powders have fewer taste and color limits than many fortified foods. Brands need identity and strength records because the finished label depends on the amount delivered in each serving. Product teams face fewer approval questions with fixed servings than with recipes that have tighter taste or color limits.
- Dietary supplements is anticipated to record 34.2% share in 2026. Fixed serving sizes help teams control vitamin or mineral delivery across common supplement formats.
- In July 2025, NIH updated its vitamin B12 guidance and named fortified nutritional yeast as a dietary source. The guidance gives formulation teams an official reference for checking B12 content in a finished yeast grade.
Why does Powder suit fortified yeast blending and dose control?
Powder gives production teams a bulk format that they meter into dry blends with standard equipment. Plants sample each lot before the ingredient enters a food or supplement batch. Flakes work better in visible food uses, while tablets and capsules serve as finished dose formats. Powder covers more industrial mixing needs because weighing, blending, and lot sampling already match common dry-ingredient workflows.
- Powder holds 41.7% share of the form category in 2026. Dry blending and lot testing make powder easier to use across food and supplement production.
- Production teams can weigh powder on existing dry-ingredient lines and distribute it evenly through the blend. Lot sampling then links the measured assay to the dose used for batch release.
What are the drivers, restraints and opportunities in the Fortified Yeast Market?
In the fortified yeast market, the key driver is nutrient-focused formulation that supports demand, the key restraint is assay and compliance work that constrains adoption, and the key opportunity is adjacent nutrition applications that open expansion routes.
- Driver: Food and supplement brands use fortified yeast to deliver measured nutrient doses through familiar production steps.
- Restraint: Nutrient limits and claim rules make teams test each fortified yeast grade and complete documents before approval.
- Opportunity: Food, beauty, and pet formulas create new uses as teams prove nutrient strength and product performance.
Fortified yeast gives food and supplement makers a simple way to add measured vitamins or minerals through a yeast ingredient. Supplements use fixed serving sizes, which makes each nutrient dose easier to control. Functional food ingredients need another check because the nutrient must stay stable without creating unwanted taste or color. At Food Ingredients Africa in Cairo in June 2025, Angel Yeast featured Snowflake Yeast among its exhibited solutions, positioning it as an option for instant nutrient fortification across food applications in the Middle East and Africa region. Buyers need identity and strength records for the chosen grade. Product teams approve the grade once its nutrient level and production behavior work in the finished product.
Fortified yeast has a tighter dosing range than standard inactive yeast because the finished label states a vitamin or mineral amount. Too much nutrient creates safety or compliance problems, while too little weakens the label claim. French authorities review supplement content with the claims brands place on labels and advertising. In November 2025, DGCCRF published guidance on supplement labels, product presentation, and banned disease claims. These rules make accurate assay results part of product approval. Product teams need batch records that match the nutrient identity and stated strength. If the measured level falls outside the approved range, the brand changes the formula, label, or ingredient details before launch.
Food, vegan, beauty, and pet formulations create additional uses as teams document dose and product performance. Food products need the nutrient to survive processing without changing taste or color. Pet formulas need species-specific dosing because mineral needs differ by animal and product. In January 2025, Alltech's US pet guide listed selenium yeast for controlled mineral delivery in companion-animal diets. Beauty supplements use zinc or selenium yeast for claims that match the nutrient the ingredient provides. Each new use needs a dose that works in the finished product. Application labs test these limits before manufacturers use the grade in routine production.
Which country CAGRs are compared in the Fortified Yeast Market?
The following country CAGRs cover the period from 2026 to 2036.
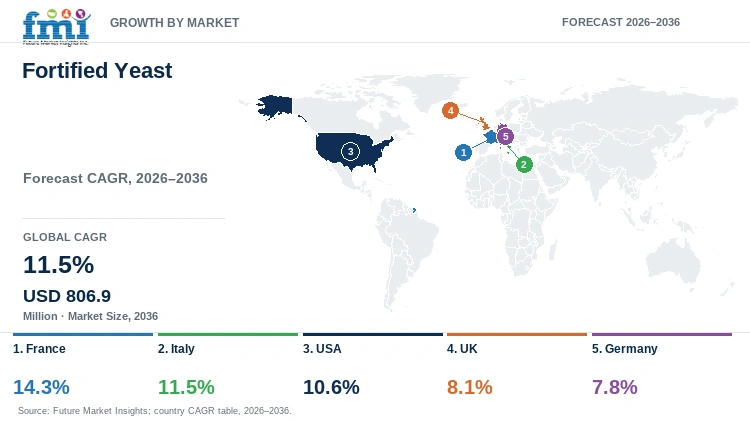
| Country | CAGR |
|---|---|
| France | 14.3% |
| Italy | 11.5% |
| USA | 10.6% |
| UK | 8.1% |
| Germany | 7.8% |
How do country-level CAGRs compare in the fortified yeast market?
Country rules change the work needed to approve the same fortified yeast grade. France and Italy require national supplement filings, so brands need clear ingredient and label records. U.S. review adds identity and safety checks for qualifying new dietary ingredients. Great Britain focuses on product safety and label responsibility, while Germany adds national guidance on nutrient levels.
- France places emphasis on label and assay records under supplement controls linking nutrient content with approved claims.
- Italy's notification process rewards suppliers that give clear nutrient-source details and complete product files for each supplement.
- Across the USA, supplement makers need identity and safety records that support new dietary ingredient review and buyer approval.
- The UK's separate food supplement rules keep nutrient form and label checks central to product approval.
- Germany prioritizes dose control because national nutrient guidance shapes vitamin and mineral levels in supplements and fortified foods.
The same fortified yeast grade needs different files, dose checks, and label evidence across these countries. Country-ready documents reduce rework before brands release their finished supplements.
Country-wise Analysis
- By 2036, France is projected to grow at 14.3% CAGR. French supplement rules require brands to file each product through the Compl'Alim system. Brands provide complete ingredient and label details for every product filing. In January 2026, the Agriculture Ministry explained how the service works for supplements brands sell in France. Each filing needs product details that match the formula brands sell to consumers. For fortified yeast, the vitamin or mineral form and measured strength must support the amount shown on the label. A mismatch can delay review or force a formula or label change. Complete batch records help brands match the yeast assay with the stated nutrient amount before products reach stores.
- Italy is estimated to post 11.5% CAGR over the forecast period. Each food supplement needs an online notice, so complete documents matter before launch. In March 2025, the Ministry of Health updated its online notification service for food supplements. The company selling the supplement remains responsible for meeting national food rules. Brands include the nutrient source, planned dose, label wording, and batch details in each fortified yeast file. Missing details can trigger another review and delay the launch. A complete product file helps the brand answer ministry questions faster and keeps the notice process from slowing commercial plans.
- Fortified yeast demand in the USA is forecast to rise at 10.6% CAGR over the forecast period. FDA rules require a notice for some new dietary ingredients before they enter supplement products. In June 2025, FDA released educational materials explaining that process. The materials focus on ingredient identity and safety information FDA needs in a submission. Fortified yeast files name the nutrient source and planned supplement use. Product teams compare identity, purity, and strength records during ingredient approval. Missing identity or safety evidence can hold a launch until the brand answers the open questions. A complete file supports both FDA review and the company's own approval of the chosen yeast grade.
- In the UK, fortified yeast demand is predicted to advance at 8.1% CAGR through 2036. Great Britain treats food supplements as foods and applies domestic rules for safety and sale. In June 2026, the Food Standards Agency published guidance covering supplement forms, product safety, and label duties. The guidance explains what businesses must provide before selling these products. Brands using fortified yeast in Great Britain need an allowed nutrient form and claims that match local rules. Importers compare an EU-ready product file with British requirements before release. Clear records help technical teams review the label and recipe without changing the chosen nutrient source. Good documents reduce extra review work for brands using fortified yeast in supplement formulas.
- Fortified yeast sales in Germany are forecast to expand at 7.8% CAGR by 2036. German food companies use vitamins and minerals under national and EU food rules. In March 2026, BfR published updated maximum-level recommendations for vitamins and minerals. The table helps teams review the total nutrient amount coming from supplements and fortified foods. Fortified yeast adds another nutrient source to that total. Product teams compare its assay with every other vitamin or mineral source in the recipe. A high-strength grade can limit the amount that teams can add to the formula. Several strength options help teams reach the target dose without adding more nutrient than needed.
Who are the notable companies in the Fortified Yeast Market?
Notable companies in the fortified yeast market include Lesaffre, Lallemand, Angel Yeast Co., AB Mauri, Leiber GmbH, and Alltech.
Human-nutrition and animal-nutrition companies solve different formulation problems with fortified yeast. Lesaffre, Lallemand, and Angel Yeast sell named vitamin or mineral yeasts for food and supplements. Alltech and Leiber provide selenium or mineral yeast for animal feed additives and pet nutrition. AB Mauri reaches animal nutrition through AB Biotek's mineralized yeast products. Buyers compare the nutrient source, intended use, and supporting data instead of parent-company size.
- Lesaffre, Lallemand, and Angel Yeast sell named enriched yeast grades for supplements, functional foods, and other human-nutrition formulas.
- Alltech and Leiber provide selenium or mineral yeast for pet food and other animal diets.
- AB Mauri reaches animal nutrition through AB Biotek, which supplies mineralized yeast and other fermentation solutions.
Competitive Benchmarking: Fortified Yeast Market
| Company | Vitamin/Mineral Product Breadth | Human Supplement or Food Use | Pet Nutrition Use | Geographic Reach |
|---|---|---|---|---|
| Lesaffre | High | High | Medium | Europe, North America, Asia, and wider global operations |
| Lallemand | High | High | Medium | Canada, United States, Estonia, Denmark, Norway, and global commercial network |
| Angel Yeast Co. | High | High | Low | China-based manufacturing with products and services in more than 150 countries and regions |
| AB Mauri | Medium | Low | Low | North America, Latin America, Europe, Middle East and Africa, and Asia-Pacific operations |
| Leiber GmbH | Medium | Low | Medium | Germany and Poland manufacturing with international distribution |
| Alltech | Medium | Low | High | Global animal-nutrition and pet-nutrition network |
Benchmark ratings compare each company's public evidence for nutrient range, human use, pet use, and geographic reach. High means the company documents several direct products or uses. Medium means the evidence covers fewer direct products or uses. Low means the company publishes limited evidence for that fortified yeast use. Ratings describe evidence available through September 2026 and do not represent company market share.
Key Developments in the Fortified Yeast Market
- In March 2026, Gnosis by Lesaffre presented Lynside Forte zinc, selenium, and B-vitamin yeasts at Food Ingredients China. The display gave human-nutrition formulators several named nutrient yeast options for product development.
- In April 2026, Lallemand Bio-Ingredients exhibited at Vitafoods Asia 2026 in Bangkok, featuring Lalmin vitamin and mineral enriched yeasts alongside its broader portfolio of fermentation-derived health ingredients for dietary supplement applications.
- In July 2025, Leiber received FSSC 22000 certification covering yeast products for food and pet food production. The certificate documents the controls Leiber uses for yeast in food and pet-food applications.
Key Players in the Fortified Yeast Market
Human Nutrition Fortified Yeast Specialists
- Lesaffre
- Lallemand
- Angel Yeast Co.
Animal and Pet Nutrition Mineral Yeast Suppliers
- Leiber GmbH
- Alltech
Broad Yeast and Nutrition Platform
- AB Mauri
Fortified Yeast Market - Report Scope
| Coverage field | Report scope |
|---|---|
| Market breakdown | By product type, end use application, form and region. |
| Quantitative Units | USD million. |
| Market Definition | Revenue includes fortified yeast ingredients sold within the stated Product Type, End Use Application and Form universe. It excludes downstream finished-product revenue, standard non-fortified yeast sold outside this use case, stand-alone vitamin or mineral premixes, and adjacent yeast derivatives unless sold as fortified yeast. |
| Regions Covered | North America, Latin America, Western Europe, Eastern Europe, East Asia, South Asia and Pacific, and Middle East and Africa. |
| Countries Covered | France, UK, Italy, Germany, USA. |
| Key Companies Profiled | Lesaffre, Lallemand, Angel Yeast Co., AB Mauri, Leiber GmbH, Alltech. |
| Forecast Period | 2026 to 2036. |
| Approach | Primary and secondary research with market triangulation. |
Fortified Yeast Market - Research Methodology
| Method | Approach |
|---|---|
| Primary Research | FMI analysts gathered input from manufacturers, service providers, technology developers, distributors, end users, procurement teams, and subject-matter experts. Interviews examined purchasing decisions, product or service evaluation, adoption barriers, approval requirements, pricing considerations, and expectations for technical or commercial support. Respondents were also asked what evidence is required before a trial, pilot, or initial order develops into regular purchasing. |
| Desk Research | Desk research covered government statistics, regulatory publications, trade data, industry associations, technical literature, standards, company filings, product information, and official corporate announcements. Sources were reviewed for relevance, publication date, geographic coverage, and consistency with the defined market scope. Claims relating to performance, applications, approvals, capacity, investment, and commercial activity were retained only when supported by credible public evidence. |
| Market Sizing and Forecasting | The market model combined the baseline value with historical performance, segment structure, pricing and volume indicators, adoption levels, company participation, and country-level demand conditions. Forecast assumptions considered economic activity, investment trends, regulatory developments, technology adoption, purchasing cycles, supply availability, and barriers to wider market use. Segment and regional estimates were reconciled before the final market total was calculated. |
| Data Validation | Estimates were checked against multiple independent indicators, including public data, company activity, trade patterns, industry developments, and findings from primary interviews. Validation also tested whether products, services, applications, and company revenues fell within the defined market boundaries. Adjacent categories, unsupported claims, overlapping revenues, and activities without direct market relevance were excluded to reduce double counting and maintain consistency across segments and countries. |
Fortified Yeast Market by Segments
Fortified Yeast Market segmented by Product Type:
- Vitamin-Fortified Yeast
- Vitamin B
- Folic Acid
- Vitamin D
- Vitamin E
- Mineral-Fortified Yeast
- Selenium
- Zinc
- Iron
- Chromium
- Other Minerals
Fortified Yeast Market segmented by End Use Application:
- Dietary Supplements
- Plant Based Food
- Vegan based Food
- Pharmaceuticals
- Pet Food
- Dairy Products
- Cosmetics and Personal Care
Fortified Yeast Market segmented by Form:
- Powder
- Flakes
- Tablet
- Capsule
Fortified Yeast Market by Region:
- North America
- United States
- Canada
- Latin America
- Brazil
- Mexico
- Argentina
- Chile
- Western Europe
- Germany
- France
- United Kingdom
- Italy
- Spain
- Benelux
- Nordics
- Eastern Europe
- Poland
- Czech Republic
- Romania
- Hungary
- East Asia
- China
- Japan
- South Korea
- South Asia and Pacific
- India
- ASEAN
- Australia and New Zealand
- Middle East and Africa
- GCC Countries
- South Africa
- Türkiye
- Israel
Research Sources and Bibliography
- U.S. Food and Drug Administration. (2025, June 11). FDA Releases Educational Materials on the New Dietary Ingredient Notification Process for Dietary Supplements.
- National Institutes of Health, Office of Dietary Supplements. (2025, July 2). Vitamin B12: Fact Sheet for Health Professionals.
- Direction générale de la concurrence, de la consommation et de la répression des fraudes. (2025, November 7). Labeling, Presentation, and Advertising of Food Supplements: Rules to Know.
- Direction générale de la concurrence, de la consommation et de la répression des fraudes. (2025, November 3). Food Supplements: Too Many Anomalies Remain.
- Ministry of Agriculture and Food Sovereignty, France. (2026, January 21). What Is a Food Supplement?
- Ministry of Health, Italy. (2025, March 26). New Notification of a Food Supplement.
- In January 2026, the Food Standards Agency issued guidance to help consumers navigate food supplement safety, covering supplement forms, product safety checks, and label responsibilities.
- Food Standards Agency. (2026, June 25). Food Supplements Guidance.
- Federal Institute for Risk Assessment. (2026, March 9). Table: BfR Maximum-Level Recommendations.
- Lesaffre. (2025, September 9). What Is Nutritional Yeast?
- Lesaffre. (2025, June 2). Lesaffre and Zilor Enter a Joint Venture.
- Gnosis by Lesaffre. (2025, March 27). The Powerful Antioxidant Benefits of Lynside Forte Se+.
- Gnosis by Lesaffre. (2025, April 23). Lynside Forte Se+ for Skin Protection Against Sun Exposure.
- Gnosis by Lesaffre. (2026, May 15). Enriched Nutritional Yeasts and Bioavailability: Transforming Nutrient Absorption for Optimal Results.
- Gnosis by Lesaffre. (2026, March 17). Join Us at Food Ingredients China.
- Lallemand Bio-Ingredients. (2025, January 15). Vitafoods Europe.
- Lallemand Bio-Ingredients. (2025, January 15). Vitafoods Asia.
- Lallemand Bio-Ingredients. (2025, January 15). SupplySide Global.
- Lallemand Bio-Ingredients. (2026, April 21). Vitafoods Europe.
- Lallemand Bio-Ingredients. (2026, April 22). Vitafoods Asia.
- Lallemand Inc. (2026, March). Fortified Foods.
- Angel Yeast Co. (2025, February 5). Angel Yeast Showcases Innovative Yeast-Based Nutrition Solutions at Vitafoods India 2025.
- Angel Yeast Co. (2025, May 20). Angel Yeast Showcases Innovative Yeast Solutions for a Sustainable Tomorrow at Vitafoods Europe 2025.
- Angel Yeast Co. (2025, June 4). Angel Yeast Showcases Microbial Protein Innovations at FI Africa 2025, Driving Sustainable Food Solutions in MEA.
- Angel Yeast Co. (2025, June 20). Angel Yeast Showcases Natural Ingredient Innovations at Istanbul Food Expo, Driving Clean-Label Momentum in Eurasia.
- Alltech. (2025, January). US Pet Solutions.
- Alltech. (2025, June). Alltech Pet Solutions Guide.
- Leiber GmbH. (2025, July 11). FSSC 22000 Certificate: Yeast Products for Food and Pet Food Production.
- Leiber Sp. z o.o. (2025, February 12). FSSC 22000 Certificate: Dried Yeast Products for Food and Feed Production.
- Associated British Foods plc. (2025, April 29). Interim Results Announcement.
- Associated British Foods plc. (2025, November 6). Annual Report 2025.
- Angel Yeast Co. (2025). Minerals/Vitamins Fortified Yeast.
"This bibliography gives readers a reference list and does not include every source. The full report contains the complete reference list and detailed citations."
This Report Answers
- How large is the Fortified Yeast Market in 2026, and what value is forecast for 2036?
- Which industry pressures are supporting demand for fortified yeast ingredients?
- Why does vitamin-fortified yeast account for 27.7% of product type in 2026?
- Why do dietary supplements account for 34.2% of end use application in 2026?
- How do country growth rates differ between France, Italy, USA, UK, and Germany?
- Which companies supply or support relevant fortified yeast, nutrition, or yeast-based ingredient categories?
- What qualification and regulatory factors can delay adoption or supplier switching?
- What should buyers evaluate during fortified yeast purchasing for a new formulation?
Table of Content
Table of Content
- Key Takeaways
- Market Size and CAGR
- Top Growth Driver
- Fastest Growing Segment
- Leading Region
- Key Companies
- Emerging Opportunities
- Executive Summary
- Global Market Outlook
- Demand-side Trends
- Supply-side Trends
- Technology Roadmap Analysis
- Analysis and Recommendations
- Analyst Perspective (What is happening? Why now? What should investors know?)
- Key Questions Answered
- How large is the market?
- What is the CAGR?
- What are key trends?
- Which region dominates?
- Who are the leaders?
Read More...
- Market Overview
- Market Coverage / Taxonomy
- Market Definition / Scope / Limitations
- Research Methodology
- Chapter Orientation
- Analytical Lens and Working Hypotheses
- Market Structure, Signals, and Trend Drivers
- Benchmarking and Cross-market Comparability
- Market Sizing, Forecasting, and Opportunity Mapping
- Research Design and Evidence Framework
- Desk Research Programme (Secondary Evidence)
- Expert Input and Fieldwork (Primary Evidence)
- Tooling, Models, and Reference Databases
- Data Engineering and Model Build
- Quality Assurance and Audit Trail
- Market Background
- Market Dynamics (Drivers, Restraints, Opportunity, Trends)
- Scenario Forecast (Optimistic, Likely, Conservative)
- Impact Analysis
- AI Impact
- Sustainability Impact
- Regulatory Impact
- Technology Impact
- Consumer / Buyer Analysis
- Purchase Drivers
- Adoption Barriers
- Buyer Journey
- Opportunity Map Analysis
- Product Life Cycle Analysis
- Supply Chain Analysis
- Investment Feasibility Matrix
- Value Chain Analysis
- PESTLE and Porter's Analysis
- Regulatory Landscape
- Regional Parent Market Outlook
- Production and Consumption Statistics
- Import and Export Statistics
- Global Market Analysis and Forecast, 2021 to 2036
- Historical Market Size Value (USD Million) Analysis, 2021 to 2025
- Current and Future Market Size Value (USD Million) Projections, 2026 to 2036
- Y-o-Y Growth Trend Analysis
- Absolute $ Opportunity Analysis
- Global Market Pricing Analysis, 2021 to 2036
- Global Market Analysis and Forecast, By Product Type, 2021 to 2036
- Introduction / Key Findings
- Historical Market Size Value (USD Million) Analysis By Product Type, 2021 to 2025
- Current and Future Market Size Value (USD Million) Analysis and Forecast By Product Type, 2026 to 2036
- Vitamin-Fortified Yeast
- Vitamin B
- Folic Acid
- Vitamin D
- Vitamin E
- Mineral-Fortified Yeast
- Selenium
- Zinc
- Iron
- Chromium
- Other Minerals
- Y-o-Y Growth Trend Analysis By Product Type, 2021 to 2025
- Absolute $ Opportunity Analysis By Product Type, 2026 to 2036
- Global Market Analysis and Forecast, By End Use Application, 2021 to 2036
- Introduction / Key Findings
- Historical Market Size Value (USD Million) Analysis By End Use Application, 2021 to 2025
- Current and Future Market Size Value (USD Million) Analysis and Forecast By End Use Application, 2026 to 2036
- Dietary Supplements
- Plant Based Food
- Vegan based Food
- Pharmaceuticals
- Pet Food
- Dairy Products
- Cosmetics and Personal Care
- Y-o-Y Growth Trend Analysis By End Use Application, 2021 to 2025
- Absolute $ Opportunity Analysis By End Use Application, 2026 to 2036
- Global Market Analysis and Forecast, By Form, 2021 to 2036
- Introduction / Key Findings
- Historical Market Size Value (USD Million) Analysis By Form, 2021 to 2025
- Current and Future Market Size Value (USD Million) Analysis and Forecast By Form, 2026 to 2036
- Powder
- Flakes
- Tablet
- Capsule
- Y-o-Y Growth Trend Analysis By Form, 2021 to 2025
- Absolute $ Opportunity Analysis By Form, 2026 to 2036
- Global Market Analysis and Forecast, By Region, 2021 to 2036
- Introduction
- Historical Market Size Value (USD Million) Analysis By Region, 2021 to 2025
- Current Market Size Value (USD Million) Analysis and Forecast By Region, 2026 to 2036
- North America
- Latin America
- Western Europe
- Eastern Europe
- East Asia
- South Asia and Pacific
- Middle East and Africa
- Market Attractiveness Analysis By Region
- North America Market Analysis and Forecast, By Country, 2021 to 2036
- Historical Market Size Value (USD Million) Trend Analysis By Market Taxonomy, 2021 to 2025
- Market Size Value (USD Million) Forecast By Market Taxonomy, 2026 to 2036
- By Country
- United States
- Canada
- By Product Type
- By End Use Application
- By Form
- By Country
- Market Attractiveness Analysis
- By Country
- By Product Type
- By End Use Application
- By Form
- Key Takeaways
- Latin America Market Analysis and Forecast, By Country
- Historical Market Size Value (USD Million) Trend Analysis By Market Taxonomy, 2021 to 2025
- Market Size Value (USD Million) Forecast By Market Taxonomy, 2026 to 2036
- By Country
- Brazil
- Mexico
- Argentina
- Chile
- By Product Type
- By End Use Application
- By Form
- By Country
- Market Attractiveness Analysis
- By Country
- By Product Type
- By End Use Application
- By Form
- Key Takeaways
- Western Europe Market Analysis and Forecast, By Country
- Historical Market Size Value (USD Million) Trend Analysis By Market Taxonomy, 2021 to 2025
- Market Size Value (USD Million) Forecast By Market Taxonomy, 2026 to 2036
- By Country
- Germany
- France
- United Kingdom
- Italy
- Spain
- Benelux
- Nordics
- By Product Type
- By End Use Application
- By Form
- By Country
- Market Attractiveness Analysis
- By Country
- By Product Type
- By End Use Application
- By Form
- Key Takeaways
- Eastern Europe Market Analysis and Forecast, By Country
- Historical Market Size Value (USD Million) Trend Analysis By Market Taxonomy, 2021 to 2025
- Market Size Value (USD Million) Forecast By Market Taxonomy, 2026 to 2036
- By Country
- Poland
- Czech Republic
- Romania
- Hungary
- By Product Type
- By End Use Application
- By Form
- By Country
- Market Attractiveness Analysis
- By Country
- By Product Type
- By End Use Application
- By Form
- Key Takeaways
- East Asia Market Analysis and Forecast, By Country
- Historical Market Size Value (USD Million) Trend Analysis By Market Taxonomy, 2021 to 2025
- Market Size Value (USD Million) Forecast By Market Taxonomy, 2026 to 2036
- By Country
- China
- Japan
- South Korea
- By Product Type
- By End Use Application
- By Form
- By Country
- Market Attractiveness Analysis
- By Country
- By Product Type
- By End Use Application
- By Form
- Key Takeaways
- South Asia and Pacific Market Analysis and Forecast, By Country
- Historical Market Size Value (USD Million) Trend Analysis By Market Taxonomy, 2021 to 2025
- Market Size Value (USD Million) Forecast By Market Taxonomy, 2026 to 2036
- By Country
- India
- ASEAN
- Australia and New Zealand
- By Product Type
- By End Use Application
- By Form
- By Country
- Market Attractiveness Analysis
- By Country
- By Product Type
- By End Use Application
- By Form
- Key Takeaways
- Middle East and Africa Market Analysis and Forecast, By Country
- Historical Market Size Value (USD Million) Trend Analysis By Market Taxonomy, 2021 to 2025
- Market Size Value (USD Million) Forecast By Market Taxonomy, 2026 to 2036
- By Country
- GCC Countries
- South Africa
- Türkiye
- Israel
- By Product Type
- By End Use Application
- By Form
- By Country
- Market Attractiveness Analysis
- By Country
- By Product Type
- By End Use Application
- By Form
- Key Takeaways
- Key Countries Market Analysis
- United States
- Pricing Analysis
- Market Share Analysis, 2025
- By Product Type
- By End Use Application
- By Form
- Canada
- Pricing Analysis
- Market Share Analysis, 2025
- By Product Type
- By End Use Application
- By Form
- Mexico
- Pricing Analysis
- Market Share Analysis, 2025
- By Product Type
- By End Use Application
- By Form
- Brazil
- Pricing Analysis
- Market Share Analysis, 2025
- By Product Type
- By End Use Application
- By Form
- Chile
- Pricing Analysis
- Market Share Analysis, 2025
- By Product Type
- By End Use Application
- By Form
- Germany
- Pricing Analysis
- Market Share Analysis, 2025
- By Product Type
- By End Use Application
- By Form
- United Kingdom
- Pricing Analysis
- Market Share Analysis, 2025
- By Product Type
- By End Use Application
- By Form
- Italy
- Pricing Analysis
- Market Share Analysis, 2025
- By Product Type
- By End Use Application
- By Form
- Spain
- Pricing Analysis
- Market Share Analysis, 2025
- By Product Type
- By End Use Application
- By Form
- France
- Pricing Analysis
- Market Share Analysis, 2025
- By Product Type
- By End Use Application
- By Form
- India
- Pricing Analysis
- Market Share Analysis, 2025
- By Product Type
- By End Use Application
- By Form
- ASEAN
- Pricing Analysis
- Market Share Analysis, 2025
- By Product Type
- By End Use Application
- By Form
- Australia and New Zealand
- Pricing Analysis
- Market Share Analysis, 2025
- By Product Type
- By End Use Application
- By Form
- China
- Pricing Analysis
- Market Share Analysis, 2025
- By Product Type
- By End Use Application
- By Form
- Japan
- Pricing Analysis
- Market Share Analysis, 2025
- By Product Type
- By End Use Application
- By Form
- South Korea
- Pricing Analysis
- Market Share Analysis, 2025
- By Product Type
- By End Use Application
- By Form
- Poland
- Pricing Analysis
- Market Share Analysis, 2025
- By Product Type
- By End Use Application
- By Form
- Hungary
- Pricing Analysis
- Market Share Analysis, 2025
- By Product Type
- By End Use Application
- By Form
- Türkiye
- Pricing Analysis
- Market Share Analysis, 2025
- By Product Type
- By End Use Application
- By Form
- South Africa
- Pricing Analysis
- Market Share Analysis, 2025
- By Product Type
- By End Use Application
- By Form
- United States
- Market Structure Analysis
- Competition Dashboard
- Competition Benchmarking
- Market Share Analysis of Top Players
- By Regional
- By Product Type
- By End Use Application
- By Form
- Emerging Startups
- Innovation Benchmarking
- Competition Analysis
- Competition Deep Dive
- Lesaffre
- Overview
- Product Portfolio
- Profitability by Market Segments
- Sales Footprint
- Strategy Overview
- Marketing Strategy
- Product Strategy
- Channel Strategy
- Lallemand
- Angel Yeast Co.
- AB Mauri
- Leiber GmbH
- Alltech
- Lesaffre
- Case Studies
- Success Stories
- Recent Developments
- Competition Deep Dive
- Assumptions & Acronyms Used
List of Tables
- Table 1: Global Market Value (USD Million) Forecast by Region, 2021 to 2036
- Table 2: Global Market Value (USD Million) Forecast by Product Type, 2021 to 2036
- Table 3: Global Market Value (USD Million) Forecast by End Use Application, 2021 to 2036
- Table 4: Global Market Value (USD Million) Forecast by Form, 2021 to 2036
- Table 5: North America Market Value (USD Million) Forecast by Country, 2021 to 2036
- Table 6: North America Market Value (USD Million) Forecast by Product Type, 2021 to 2036
- Table 7: North America Market Value (USD Million) Forecast by End Use Application, 2021 to 2036
- Table 8: North America Market Value (USD Million) Forecast by Form, 2021 to 2036
- Table 9: Latin America Market Value (USD Million) Forecast by Country, 2021 to 2036
- Table 10: Latin America Market Value (USD Million) Forecast by Product Type, 2021 to 2036
- Table 11: Latin America Market Value (USD Million) Forecast by End Use Application, 2021 to 2036
- Table 12: Latin America Market Value (USD Million) Forecast by Form, 2021 to 2036
- Table 13: Western Europe Market Value (USD Million) Forecast by Country, 2021 to 2036
- Table 14: Western Europe Market Value (USD Million) Forecast by Product Type, 2021 to 2036
- Table 15: Western Europe Market Value (USD Million) Forecast by End Use Application, 2021 to 2036
- Table 16: Western Europe Market Value (USD Million) Forecast by Form, 2021 to 2036
- Table 17: Eastern Europe Market Value (USD Million) Forecast by Country, 2021 to 2036
- Table 18: Eastern Europe Market Value (USD Million) Forecast by Product Type, 2021 to 2036
- Table 19: Eastern Europe Market Value (USD Million) Forecast by End Use Application, 2021 to 2036
- Table 20: Eastern Europe Market Value (USD Million) Forecast by Form, 2021 to 2036
- Table 21: East Asia Market Value (USD Million) Forecast by Country, 2021 to 2036
- Table 22: East Asia Market Value (USD Million) Forecast by Product Type, 2021 to 2036
- Table 23: East Asia Market Value (USD Million) Forecast by End Use Application, 2021 to 2036
- Table 24: East Asia Market Value (USD Million) Forecast by Form, 2021 to 2036
- Table 25: South Asia and Pacific Market Value (USD Million) Forecast by Country, 2021 to 2036
- Table 26: South Asia and Pacific Market Value (USD Million) Forecast by Product Type, 2021 to 2036
- Table 27: South Asia and Pacific Market Value (USD Million) Forecast by End Use Application, 2021 to 2036
- Table 28: South Asia and Pacific Market Value (USD Million) Forecast by Form, 2021 to 2036
- Table 29: Middle East and Africa Market Value (USD Million) Forecast by Country, 2021 to 2036
- Table 30: Middle East and Africa Market Value (USD Million) Forecast by Product Type, 2021 to 2036
- Table 31: Middle East and Africa Market Value (USD Million) Forecast by End Use Application, 2021 to 2036
- Table 32: Middle East and Africa Market Value (USD Million) Forecast by Form, 2021 to 2036
List of Figures
- Figure 1: Global Market Pricing Analysis
- Figure 2: Global Market Value (USD Million) Forecast 2021-2036
- Figure 3: Global Market Value Share and BPS Analysis by Product Type, 2026 and 2036
- Figure 4: Global Market Y-o-Y Growth Comparison by Product Type, 2026-2036
- Figure 5: Global Market Attractiveness Analysis by Product Type
- Figure 6: Global Market Value Share and BPS Analysis by End Use Application, 2026 and 2036
- Figure 7: Global Market Y-o-Y Growth Comparison by End Use Application, 2026-2036
- Figure 8: Global Market Attractiveness Analysis by End Use Application
- Figure 9: Global Market Value Share and BPS Analysis by Form, 2026 and 2036
- Figure 10: Global Market Y-o-Y Growth Comparison by Form, 2026-2036
- Figure 11: Global Market Attractiveness Analysis by Form
- Figure 12: Global Market Value (USD Million) Share and BPS Analysis by Region, 2026 and 2036
- Figure 13: Global Market Y-o-Y Growth Comparison by Region, 2026-2036
- Figure 14: Global Market Attractiveness Analysis by Region
- Figure 15: North America Market Incremental Dollar Opportunity, 2026-2036
- Figure 16: Latin America Market Incremental Dollar Opportunity, 2026-2036
- Figure 17: Western Europe Market Incremental Dollar Opportunity, 2026-2036
- Figure 18: Eastern Europe Market Incremental Dollar Opportunity, 2026-2036
- Figure 19: East Asia Market Incremental Dollar Opportunity, 2026-2036
- Figure 20: South Asia and Pacific Market Incremental Dollar Opportunity, 2026-2036
- Figure 21: Middle East and Africa Market Incremental Dollar Opportunity, 2026-2036
- Figure 22: North America Market Value Share and BPS Analysis by Country, 2026 and 2036
- Figure 23: North America Market Value Share and BPS Analysis by Product Type, 2026 and 2036
- Figure 24: North America Market Y-o-Y Growth Comparison by Product Type, 2026-2036
- Figure 25: North America Market Attractiveness Analysis by Product Type
- Figure 26: North America Market Value Share and BPS Analysis by End Use Application, 2026 and 2036
- Figure 27: North America Market Y-o-Y Growth Comparison by End Use Application, 2026-2036
- Figure 28: North America Market Attractiveness Analysis by End Use Application
- Figure 29: North America Market Value Share and BPS Analysis by Form, 2026 and 2036
- Figure 30: North America Market Y-o-Y Growth Comparison by Form, 2026-2036
- Figure 31: North America Market Attractiveness Analysis by Form
- Figure 32: Latin America Market Value Share and BPS Analysis by Country, 2026 and 2036
- Figure 33: Latin America Market Value Share and BPS Analysis by Product Type, 2026 and 2036
- Figure 34: Latin America Market Y-o-Y Growth Comparison by Product Type, 2026-2036
- Figure 35: Latin America Market Attractiveness Analysis by Product Type
- Figure 36: Latin America Market Value Share and BPS Analysis by End Use Application, 2026 and 2036
- Figure 37: Latin America Market Y-o-Y Growth Comparison by End Use Application, 2026-2036
- Figure 38: Latin America Market Attractiveness Analysis by End Use Application
- Figure 39: Latin America Market Value Share and BPS Analysis by Form, 2026 and 2036
- Figure 40: Latin America Market Y-o-Y Growth Comparison by Form, 2026-2036
- Figure 41: Latin America Market Attractiveness Analysis by Form
- Figure 42: Western Europe Market Value Share and BPS Analysis by Country, 2026 and 2036
- Figure 43: Western Europe Market Value Share and BPS Analysis by Product Type, 2026 and 2036
- Figure 44: Western Europe Market Y-o-Y Growth Comparison by Product Type, 2026-2036
- Figure 45: Western Europe Market Attractiveness Analysis by Product Type
- Figure 46: Western Europe Market Value Share and BPS Analysis by End Use Application, 2026 and 2036
- Figure 47: Western Europe Market Y-o-Y Growth Comparison by End Use Application, 2026-2036
- Figure 48: Western Europe Market Attractiveness Analysis by End Use Application
- Figure 49: Western Europe Market Value Share and BPS Analysis by Form, 2026 and 2036
- Figure 50: Western Europe Market Y-o-Y Growth Comparison by Form, 2026-2036
- Figure 51: Western Europe Market Attractiveness Analysis by Form
- Figure 52: Eastern Europe Market Value Share and BPS Analysis by Country, 2026 and 2036
- Figure 53: Eastern Europe Market Value Share and BPS Analysis by Product Type, 2026 and 2036
- Figure 54: Eastern Europe Market Y-o-Y Growth Comparison by Product Type, 2026-2036
- Figure 55: Eastern Europe Market Attractiveness Analysis by Product Type
- Figure 56: Eastern Europe Market Value Share and BPS Analysis by End Use Application, 2026 and 2036
- Figure 57: Eastern Europe Market Y-o-Y Growth Comparison by End Use Application, 2026-2036
- Figure 58: Eastern Europe Market Attractiveness Analysis by End Use Application
- Figure 59: Eastern Europe Market Value Share and BPS Analysis by Form, 2026 and 2036
- Figure 60: Eastern Europe Market Y-o-Y Growth Comparison by Form, 2026-2036
- Figure 61: Eastern Europe Market Attractiveness Analysis by Form
- Figure 62: East Asia Market Value Share and BPS Analysis by Country, 2026 and 2036
- Figure 63: East Asia Market Value Share and BPS Analysis by Product Type, 2026 and 2036
- Figure 64: East Asia Market Y-o-Y Growth Comparison by Product Type, 2026-2036
- Figure 65: East Asia Market Attractiveness Analysis by Product Type
- Figure 66: East Asia Market Value Share and BPS Analysis by End Use Application, 2026 and 2036
- Figure 67: East Asia Market Y-o-Y Growth Comparison by End Use Application, 2026-2036
- Figure 68: East Asia Market Attractiveness Analysis by End Use Application
- Figure 69: East Asia Market Value Share and BPS Analysis by Form, 2026 and 2036
- Figure 70: East Asia Market Y-o-Y Growth Comparison by Form, 2026-2036
- Figure 71: East Asia Market Attractiveness Analysis by Form
- Figure 72: South Asia and Pacific Market Value Share and BPS Analysis by Country, 2026 and 2036
- Figure 73: South Asia and Pacific Market Value Share and BPS Analysis by Product Type, 2026 and 2036
- Figure 74: South Asia and Pacific Market Y-o-Y Growth Comparison by Product Type, 2026-2036
- Figure 75: South Asia and Pacific Market Attractiveness Analysis by Product Type
- Figure 76: South Asia and Pacific Market Value Share and BPS Analysis by End Use Application, 2026 and 2036
- Figure 77: South Asia and Pacific Market Y-o-Y Growth Comparison by End Use Application, 2026-2036
- Figure 78: South Asia and Pacific Market Attractiveness Analysis by End Use Application
- Figure 79: South Asia and Pacific Market Value Share and BPS Analysis by Form, 2026 and 2036
- Figure 80: South Asia and Pacific Market Y-o-Y Growth Comparison by Form, 2026-2036
- Figure 81: South Asia and Pacific Market Attractiveness Analysis by Form
- Figure 82: Middle East and Africa Market Value Share and BPS Analysis by Country, 2026 and 2036
- Figure 83: Middle East and Africa Market Value Share and BPS Analysis by Product Type, 2026 and 2036
- Figure 84: Middle East and Africa Market Y-o-Y Growth Comparison by Product Type, 2026-2036
- Figure 85: Middle East and Africa Market Attractiveness Analysis by Product Type
- Figure 86: Middle East and Africa Market Value Share and BPS Analysis by End Use Application, 2026 and 2036
- Figure 87: Middle East and Africa Market Y-o-Y Growth Comparison by End Use Application, 2026-2036
- Figure 88: Middle East and Africa Market Attractiveness Analysis by End Use Application
- Figure 89: Middle East and Africa Market Value Share and BPS Analysis by Form, 2026 and 2036
- Figure 90: Middle East and Africa Market Y-o-Y Growth Comparison by Form, 2026-2036
- Figure 91: Middle East and Africa Market Attractiveness Analysis by Form
- Figure 92: Global Market - Tier Structure Analysis
- Figure 93: Global Market - Company Share Analysis
Frequently Asked Questions
How big is the Fortified Yeast Market in 2026, and what is forecast for 2036?
The Fortified Yeast Market is valued at USD 271.8 million in 2026 and is projected to reach USD 806.9 million by 2036. Food and supplement makers use vitamin and mineral yeast to deliver measured nutrient doses in finished products.
What is the CAGR of the Fortified Yeast Market from 2026 to 2036?
The Fortified Yeast Market is projected to grow at 11.5% CAGR from 2026 to 2036. Food and supplement applications support demand for yeast grades that deliver measured vitamin or mineral doses.
Which product type segment accounts for 27.7% in 2026?
Vitamin-fortified yeast accounts for 27.7% of product type in 2026. Multiple nutrient grades let formulators match the vitamin form with food and supplement requirements.
Which end use application accounts for 34.2% in 2026?
Dietary supplements account for 34.2% of end use application in 2026. Set serving sizes help formulators control vitamin or mineral delivery across common formats.
How do country growth rates compare in the Fortified Yeast Market?
France is projected at 14.3% CAGR through 2036 under national supplement declaration rules. Germany is projected at 7.8% CAGR as nutrient guidance keeps dose control central to formulation.
Which companies are active in the Fortified Yeast Market?
Lesaffre, Lallemand, Angel Yeast Co., AB Mauri, Leiber GmbH, and Alltech are notable companies in this market. Their portfolios cover human nutrition, food applications, animal feed, and pet nutrition through different fortified yeast routes.
Preview the report firsthand - request a free sample
Get SampleGet the brochure for pricing and purchase details.
Get PDF
