The global yeast market is worth USD 4.19 billion in 2025 and is anticipated to reach USD 6.6 billion by 2035, which shows a CAGR of 4.6% during the forecast period. Growth is being driven by rising demand across the food and beverage, pharmaceuticals, and personal care applications. Yeast offers critical advantages, such as its functional properties in fermentation, its nutritional benefits, and its ability to enhance the flavor profile of products.
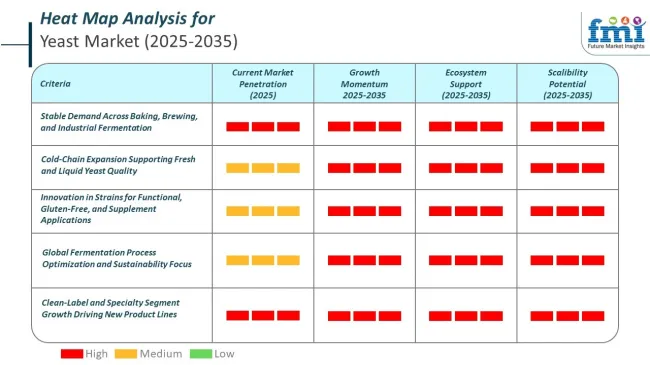
The surge in demand for plant-based and clean-label products has created sustained demand for yeast, particularly in bakery goods, alcoholic beverages, and bioethanol production. Additionally, yeast is increasingly utilized for its antioxidant and immune-boosting properties, making it an essential ingredient in health supplements and functional foods.
Product innovation and technological advancements are further accelerating market momentum. Leading manufacturers are investing in developing new yeast strains with enhanced functional benefits, including improved fermentation efficiency and higher nutritional value. Innovations in fermentation technologies are also helping to improve yield and quality, driving the adoption of yeast in a broader range of products. From personalized nutrition solutions to plant-based protein alternatives, yeast is becoming a critical ingredient in the health and wellness industry. These advancements are helping companies stay competitive while meeting the growing consumer demand for high-quality, sustainable, and functional food ingredients.
Moreover, the yeast market is likely to benefit from tightening environmental regulations and shifting industry priorities. Regulatory bodies such as the USA, FDA and European Food Safety Authority (EFSA) are enforcing stricter standards on food and supplement ingredients, pushing manufacturers toward more sustainable and traceable sourcing practices. Regulations like the EU’s REACH and the USA Organic Food Production Act are guiding manufacturers to adopt eco-friendly production methods, ensuring that yeast products are produced sustainably. As consumer demand for clean-label, organic, and sustainable ingredients increases, the market is likely to experience stronger growth, particularly through innovations in production and the adoption of sustainable sourcing practices.
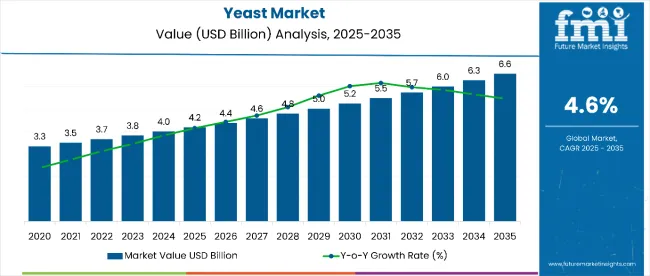
| Metric | Value |
|---|---|
| Industry Size (2025E) | USD 4.19 billion |
| Industry Value (2035F) | USD 6.6 billion |
| CAGR (2025 to 2035) | 4.6% |
The yeast market in 2025 shows varied per-capita consumption. European nations, particularly Germany and France, record higher per-person yeast use through industrial bakery applications. In the U.S., intake stabilizes due to frozen bakery penetration and increased use of dry yeast in household formats. Southeast Asian nations, including Vietnam and Thailand, reflect moderate per-capita use, especially in fermented soy and rice preparations. Sub-Saharan Africa sees minimal individual intake due to limited retail exposure.
Cold-chain demand varies by product format. Fresh yeast requires temperature-controlled transport and short-cycle delivery. Dry and instant formats remain shelf-stable, distributed through foodservice and modern retail. In India and Brazil, regional warehousing handles block yeast under ambient protocols with humidity moderation.
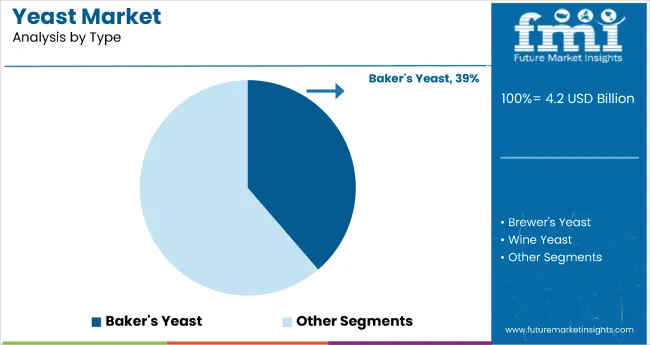
Baker's yeast holds the dominant position with 38.7% of the market share in the type category within the yeast market. This leadership is driven by the expanding global bakery industry and increasing consumer demand for fresh bread, artisanal baked goods, and convenience baking products.
Baker's yeast serves as the essential leavening agent in bread production, enabling the fermentation process that creates the desired texture, volume, and flavor characteristics that consumers expect from quality baked goods.
The segment's dominance is reinforced by the growing trend toward home baking, particularly following the COVID-19 pandemic, which significantly increased consumer interest in bread-making and baking activities.
The rise of specialty bakeries, artisanal bread production, and premium baked goods continues to drive demand for high-quality baker's yeast. Additionally, innovations in yeast strains that offer improved performance, longer shelf life, and enhanced flavor profiles support the segment's market leadership through continued technological advancement and product optimization.
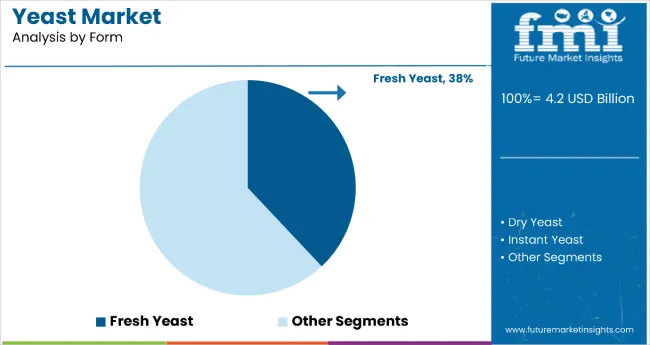
Fresh yeast dominates the yeast market with 38% of the market share in the form category. This substantial leadership is attributed to fresh yeast's superior fermentation performance, faster activation properties, and consistent quality that make it particularly valuable for commercial bakery operations and industrial bread production.
Fresh yeast provides rapid fermentation and reliable results, making it the preferred choice for large-scale bakeries that require predictable production schedules and consistent product quality.
The segment's dominance is reinforced by fresh yeast's exceptional performance in high-sugar and laminated dough applications where controlled gas formation is essential for product integrity. Despite challenges related to cold-chain requirements and shorter shelf life compared to dry alternatives, fresh yeast maintains its market leadership through its proven reliability in commercial baking operations.
The segment is projected to experience robust growth with a CAGR of 6.9%, driven by expanding bakery production capacity and increasing demand for premium baked goods that benefit from fresh yeast's superior fermentation characteristics.
Rise of Craft Brewing
The craft beer movement has significantly transformed the global beverage landscape, leading to an increased demand for specialized yeast strains. Craft brewers are dedicated to creating unique and innovative beer styles, often experimenting with various yeast varieties to develop distinctive flavors and aromas. This experimentation allows brewers to differentiate their products in a competitive market, appealing to consumers seeking novel taste experiences.
As a result, the brewer’s yeast segment is witnessing substantial growth, with a focus on both traditional and unconventional yeast strains. The rise of craft brewing not only enhances consumer choice but also fosters a culture of creativity and quality, further driving the demand for high-quality yeast in the brewing industry.
Innovative Applications
Yeast is increasingly being recognized for its versatility beyond traditional baking and brewing applications. Innovative food manufacturers are exploring yeast's potential in the production of plant-based meat alternatives and dairy substitutes, tapping into the growing demand for vegan and vegetarian options. By utilizing specific yeast strains, companies can enhance the texture, flavor, and nutritional profile of these products, making them more appealing to health-conscious consumers.
This diversification of yeast applications is expanding the market and attracting new customer segments, including those interested in sustainable and clean-label foods. As the trend towards plant-based diets continues to rise, yeast's role in creating innovative food solutions is becoming increasingly significant.
Convenience Foods Growth
The demand for convenience foods is on the rise, driven by busy lifestyles and the need for quick meal solutions. This trend encompasses ready-to-eat meals, frozen products, and snack foods, all of which often rely on yeast as a key ingredient. Yeast serves multiple purposes in these products, acting as a leavening agent to improve texture and as a flavor enhancer to elevate taste.
Manufacturers are increasingly incorporating yeast to extend shelf life and maintain product quality, making it an essential component in the formulation of convenience foods. As consumers prioritize convenience without compromising on taste or quality, the yeast market is poised for growth, reflecting the evolving preferences of modern consumers.
Tier 1 Companies comprise the industry leaders with substantial market revenue exceeding USD 20 million and a market share of approximately 40% to 50%. These companies are recognized for their high production capacity, extensive product portfolios, and robust geographical reach. They possess significant expertise in manufacturing and reconditioning yeast products across multiple packaging formats.
Their strong consumer base and established brand reputation further solidify their market position. Prominent companies within Tier 1 include Lesaffre, AB Mauri, Angel Yeast Co., Ltd., Kerry Group, and Lallemand Inc. These leaders are at the forefront of innovation, investing in research and development to enhance product quality and meet evolving consumer demands.
Tier 2 Companies consist of mid-sized players with revenues ranging from USD 5 million to USD 20 million. These companies have a notable presence in specific regions and significantly influence the local retail space. They are characterized by a strong understanding of consumer preferences and regional market dynamics.
While they may not possess the extensive global reach of Tier 1 companies, they leverage good technology and ensure regulatory compliance. Prominent companies in Tier 2 include Fermentis, Nutreco, Mannatech, Inc., and Chr. Hansen. These players often focus on niche markets and specialized applications, allowing them to carve out a competitive advantage in their respective regions.
Tier 3 Companies encompass a majority of small-scale enterprises operating primarily at the local level, with revenues below USD 5 million. These companies cater to niche demands and are often characterized by limited geographical reach.
They play a crucial role in fulfilling local marketplace needs but may lack the formal structure and resources of larger competitors. The Tier 3 segment is recognized as an unorganized field, where many small players operate without extensive market influence.
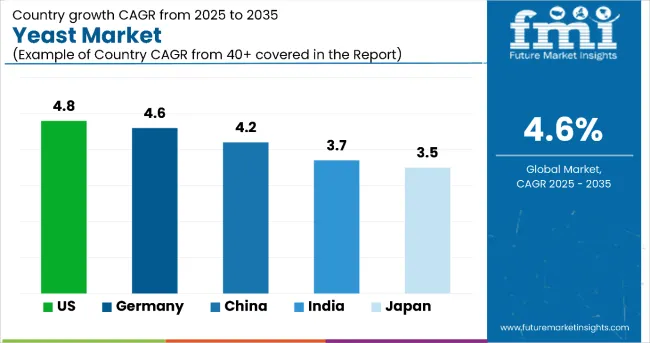
| Countries | Market Value (2035) |
|---|---|
| United States | USD 1,950.5 million |
| Germany | USD 323.0 million |
| China | USD 67.5 million |
| India | USD 23.5 million |
| Japan | USD 15.7 million |
The craft brewing boom and the rise of artisanal baking are significantly driving yeast demand in the USA. The craft beer industry has flourished, with thousands of microbreweries and craft breweries emerging, each seeking unique and specialized yeast strains to develop distinctive flavors and styles.
This trend has led to a diverse range of yeast products being utilized in brewing. Simultaneously, the resurgence of interest in artisanal and homemade bread has prompted home bakers and small-scale bakeries to increasingly incorporate high-quality yeast. Consumers are prioritizing natural ingredients to achieve the desired texture and flavor in their baked goods. Together, these trends reflect a growing appreciation for quality and innovation in both brewing and baking, further fueling yeast demand in the market.
Technological advancements in fermentation are significantly impacting the yeast market in Germany, as companies invest heavily in research and development. These innovations focus on optimizing yeast production processes, improving fermentation efficiency, and developing specialized yeast strains tailored to specific applications.
By leveraging cutting-edge techniques such as genetic engineering and fermentation optimization, manufacturers can enhance the quality, flavor, and performance of yeast products. This focus on innovation not only meets the evolving demands of the brewing, baking, and food processing industries but also positions German companies as leaders in the global yeast market, driving growth and competitiveness.
The rapid expansion of China's food processing industry is significantly driving the demand for yeast, which plays a crucial role in various applications. Yeast is increasingly utilized for fermentation processes, enhancing flavors, and preserving food products. As consumer preferences shift towards fermented foods, sauces, and condiments, manufacturers are incorporating yeast to improve the quality and shelf life of their offerings.
This trend is particularly evident in the production of traditional Chinese fermented products, as well as modern sauces and seasonings. The focus on quality and innovation in food processing is further propelling the need for specialized yeast solutions in the market.
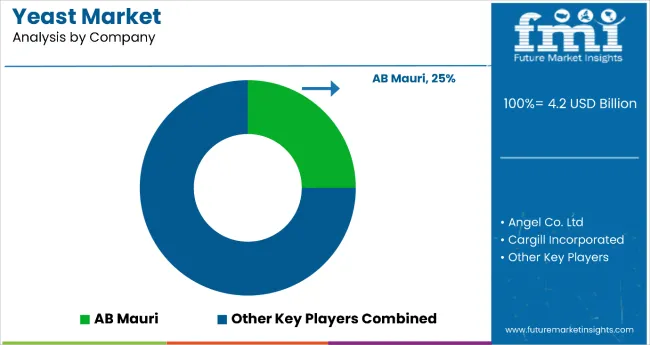
The competition in the global yeast market is intensifying as companies focus on innovation, product diversification, and sustainability to maintain their market position. Key players are investing in research and development to create specialized yeast strains that cater to specific consumer needs, such as health benefits and flavor enhancement.
Additionally, firms are forming strategic partnerships and collaborations to expand their distribution networks and improve supply chain efficiency. Emphasizing clean-label products and sustainable practices further enhances their appeal in a rapidly evolving market.
For instance
| Report Attributes | Details |
|---|---|
| Current Market Size (2025) | USD 4.19 billion |
| Projected Market Size (2035) | USD 6.6 billion |
| Overall Market CAGR (2025 to 2035) | 4.6% |
| Base Year for Estimation | 2024 |
| Historical Period | 2020 to 2024 |
| Forecast Period | 2025 to 2035 |
| Report Parameter | Revenue in USD billion |
| By Types Analyzed | Baker’s Yeast, Bi-ethanol Yeast, Feed Yeast, Wine Yeast, Brewer’s Yeast |
| By Forms Analyzed | Dry Yeast, Fresh Yeast, Instant Yeast |
| Regions Covered | North America, Latin America, Western Europe, Eastern Europe, East Asia, South Asia & Pacific, Middle East & Africa |
| Countries Covered | United States, Japan, Germany, India, United Kingdom, France, Italy, Brazil, Canada, South Korea, Australia, Spain, Netherlands, Saudi Arabia, Switzerland |
| Key Players | Associated British Foods plc, Angel Yeast, Lallemand Inc., Lesaffre, AB Mauri, Oriental Yeast India, Chr. Hansen, Kerry Group, DSM, Leiber GmbH, Ohly GmbH, Fadayeast.com, AGRANO GmbH, Kothari Fermentation |
| Additional Attributes | Dollar sales by value, market share analysis by region, and country-wise analysis |
| Customization & Pricing | Available upon request |
This segment is further categorized into Baker’s Yeast, Bi-ethanol Yeast, Feed Yeast, Wine Yeast, and Brewer’s Yeast.
This segment is further categorized into Dry Yeast, Fresh Yeast, and Instant Yeast.
Industry analysis has been carried out in key countries of North America, Latin America, Eastern Europe, Western Europe, East Asia, South Asia & Pacific, Central Asia, Balkan and Baltic Countries, Russia & Belarus and the Middle East & Africa.
The global yeast market is projected to reach USD 6.6 billion by 2035, growing from USD 4.19 billion in 2025, at a CAGR of 4.6%.
Fresh yeast is the leading form, accounting for 38% of market share in 2025 due to its superior quality and faster fermentation in bakery and brewing applications.
The demand is driven by rising adoption across food and beverage, pharmaceuticals, and personal care sectors, with yeast's role in fermentation, flavor enhancement, and nutrition being key contributors.
North America is expected to dominate, with strong growth driven by advancements in food production and fermentation technologies, particularly in bakery and brewing industries.
Key players include Lesaffre, AB Mauri, Angel Yeast Co., Ltd., Kerry Group, and Lallemand Inc., leading innovations and sustainability in yeast production.
Table 1: Global Market Value (US$ Million) Forecast by Region, 2018 to 2033
Table 2: Global Market Volume (MT) Forecast by Region, 2018 to 2033
Table 3: Global Market Value (US$ Million) Forecast by Type, 2018 to 2033
Table 4: Global Market Volume (MT) Forecast by Type, 2018 to 2033
Table 5: Global Market Value (US$ Million) Forecast by Form, 2018 to 2033
Table 6: Global Market Volume (MT) Forecast by Form, 2018 to 2033
Table 7: North America Market Value (US$ Million) Forecast by Country, 2018 to 2033
Table 8: North America Market Volume (MT) Forecast by Country, 2018 to 2033
Table 9: North America Market Value (US$ Million) Forecast by Type, 2018 to 2033
Table 10: North America Market Volume (MT) Forecast by Type, 2018 to 2033
Table 11: North America Market Value (US$ Million) Forecast by Form, 2018 to 2033
Table 12: North America Market Volume (MT) Forecast by Form, 2018 to 2033
Table 13: Latin America Market Value (US$ Million) Forecast by Country, 2018 to 2033
Table 14: Latin America Market Volume (MT) Forecast by Country, 2018 to 2033
Table 15: Latin America Market Value (US$ Million) Forecast by Type, 2018 to 2033
Table 16: Latin America Market Volume (MT) Forecast by Type, 2018 to 2033
Table 17: Latin America Market Value (US$ Million) Forecast by Form, 2018 to 2033
Table 18: Latin America Market Volume (MT) Forecast by Form, 2018 to 2033
Table 19: Western Europe Market Value (US$ Million) Forecast by Country, 2018 to 2033
Table 20: Western Europe Market Volume (MT) Forecast by Country, 2018 to 2033
Table 21: Western Europe Market Value (US$ Million) Forecast by Type, 2018 to 2033
Table 22: Western Europe Market Volume (MT) Forecast by Type, 2018 to 2033
Table 23: Western Europe Market Value (US$ Million) Forecast by Form, 2018 to 2033
Table 24: Western Europe Market Volume (MT) Forecast by Form, 2018 to 2033
Table 25: Eastern Europe Market Value (US$ Million) Forecast by Country, 2018 to 2033
Table 26: Eastern Europe Market Volume (MT) Forecast by Country, 2018 to 2033
Table 27: Eastern Europe Market Value (US$ Million) Forecast by Type, 2018 to 2033
Table 28: Eastern Europe Market Volume (MT) Forecast by Type, 2018 to 2033
Table 29: Eastern Europe Market Value (US$ Million) Forecast by Form, 2018 to 2033
Table 30: Eastern Europe Market Volume (MT) Forecast by Form, 2018 to 2033
Table 31: South Asia and Pacific Market Value (US$ Million) Forecast by Country, 2018 to 2033
Table 32: South Asia and Pacific Market Volume (MT) Forecast by Country, 2018 to 2033
Table 33: South Asia and Pacific Market Value (US$ Million) Forecast by Type, 2018 to 2033
Table 34: South Asia and Pacific Market Volume (MT) Forecast by Type, 2018 to 2033
Table 35: South Asia and Pacific Market Value (US$ Million) Forecast by Form, 2018 to 2033
Table 36: South Asia and Pacific Market Volume (MT) Forecast by Form, 2018 to 2033
Table 37: East Asia Market Value (US$ Million) Forecast by Country, 2018 to 2033
Table 38: East Asia Market Volume (MT) Forecast by Country, 2018 to 2033
Table 39: East Asia Market Value (US$ Million) Forecast by Type, 2018 to 2033
Table 40: East Asia Market Volume (MT) Forecast by Type, 2018 to 2033
Table 41: East Asia Market Value (US$ Million) Forecast by Form, 2018 to 2033
Table 42: East Asia Market Volume (MT) Forecast by Form, 2018 to 2033
Table 43: Middle East and Africa Market Value (US$ Million) Forecast by Country, 2018 to 2033
Table 44: Middle East and Africa Market Volume (MT) Forecast by Country, 2018 to 2033
Table 45: Middle East and Africa Market Value (US$ Million) Forecast by Type, 2018 to 2033
Table 46: Middle East and Africa Market Volume (MT) Forecast by Type, 2018 to 2033
Table 47: Middle East and Africa Market Value (US$ Million) Forecast by Form, 2018 to 2033
Table 48: Middle East and Africa Market Volume (MT) Forecast by Form, 2018 to 2033
Figure 1: Global Market Value (US$ Million) by Type, 2023 to 2033
Figure 2: Global Market Value (US$ Million) by Form, 2023 to 2033
Figure 3: Global Market Value (US$ Million) by Region, 2023 to 2033
Figure 4: Global Market Value (US$ Million) Analysis by Region, 2018 to 2033
Figure 5: Global Market Volume (MT) Analysis by Region, 2018 to 2033
Figure 6: Global Market Value Share (%) and BPS Analysis by Region, 2023 to 2033
Figure 7: Global Market Y-o-Y Growth (%) Projections by Region, 2023 to 2033
Figure 8: Global Market Value (US$ Million) Analysis by Type, 2018 to 2033
Figure 9: Global Market Volume (MT) Analysis by Type, 2018 to 2033
Figure 10: Global Market Value Share (%) and BPS Analysis by Type, 2023 to 2033
Figure 11: Global Market Y-o-Y Growth (%) Projections by Type, 2023 to 2033
Figure 12: Global Market Value (US$ Million) Analysis by Form, 2018 to 2033
Figure 13: Global Market Volume (MT) Analysis by Form, 2018 to 2033
Figure 14: Global Market Value Share (%) and BPS Analysis by Form, 2023 to 2033
Figure 15: Global Market Y-o-Y Growth (%) Projections by Form, 2023 to 2033
Figure 16: Global Market Attractiveness by Type, 2023 to 2033
Figure 17: Global Market Attractiveness by Form, 2023 to 2033
Figure 18: Global Market Attractiveness by Region, 2023 to 2033
Figure 19: North America Market Value (US$ Million) by Type, 2023 to 2033
Figure 20: North America Market Value (US$ Million) by Form, 2023 to 2033
Figure 21: North America Market Value (US$ Million) by Country, 2023 to 2033
Figure 22: North America Market Value (US$ Million) Analysis by Country, 2018 to 2033
Figure 23: North America Market Volume (MT) Analysis by Country, 2018 to 2033
Figure 24: North America Market Value Share (%) and BPS Analysis by Country, 2023 to 2033
Figure 25: North America Market Y-o-Y Growth (%) Projections by Country, 2023 to 2033
Figure 26: North America Market Value (US$ Million) Analysis by Type, 2018 to 2033
Figure 27: North America Market Volume (MT) Analysis by Type, 2018 to 2033
Figure 28: North America Market Value Share (%) and BPS Analysis by Type, 2023 to 2033
Figure 29: North America Market Y-o-Y Growth (%) Projections by Type, 2023 to 2033
Figure 30: North America Market Value (US$ Million) Analysis by Form, 2018 to 2033
Figure 31: North America Market Volume (MT) Analysis by Form, 2018 to 2033
Figure 32: North America Market Value Share (%) and BPS Analysis by Form, 2023 to 2033
Figure 33: North America Market Y-o-Y Growth (%) Projections by Form, 2023 to 2033
Figure 34: North America Market Attractiveness by Type, 2023 to 2033
Figure 35: North America Market Attractiveness by Form, 2023 to 2033
Figure 36: North America Market Attractiveness by Country, 2023 to 2033
Figure 37: Latin America Market Value (US$ Million) by Type, 2023 to 2033
Figure 38: Latin America Market Value (US$ Million) by Form, 2023 to 2033
Figure 39: Latin America Market Value (US$ Million) by Country, 2023 to 2033
Figure 40: Latin America Market Value (US$ Million) Analysis by Country, 2018 to 2033
Figure 41: Latin America Market Volume (MT) Analysis by Country, 2018 to 2033
Figure 42: Latin America Market Value Share (%) and BPS Analysis by Country, 2023 to 2033
Figure 43: Latin America Market Y-o-Y Growth (%) Projections by Country, 2023 to 2033
Figure 44: Latin America Market Value (US$ Million) Analysis by Type, 2018 to 2033
Figure 45: Latin America Market Volume (MT) Analysis by Type, 2018 to 2033
Figure 46: Latin America Market Value Share (%) and BPS Analysis by Type, 2023 to 2033
Figure 47: Latin America Market Y-o-Y Growth (%) Projections by Type, 2023 to 2033
Figure 48: Latin America Market Value (US$ Million) Analysis by Form, 2018 to 2033
Figure 49: Latin America Market Volume (MT) Analysis by Form, 2018 to 2033
Figure 50: Latin America Market Value Share (%) and BPS Analysis by Form, 2023 to 2033
Figure 51: Latin America Market Y-o-Y Growth (%) Projections by Form, 2023 to 2033
Figure 52: Latin America Market Attractiveness by Type, 2023 to 2033
Figure 53: Latin America Market Attractiveness by Form, 2023 to 2033
Figure 54: Latin America Market Attractiveness by Country, 2023 to 2033
Figure 55: Western Europe Market Value (US$ Million) by Type, 2023 to 2033
Figure 56: Western Europe Market Value (US$ Million) by Form, 2023 to 2033
Figure 57: Western Europe Market Value (US$ Million) by Country, 2023 to 2033
Figure 58: Western Europe Market Value (US$ Million) Analysis by Country, 2018 to 2033
Figure 59: Western Europe Market Volume (MT) Analysis by Country, 2018 to 2033
Figure 60: Western Europe Market Value Share (%) and BPS Analysis by Country, 2023 to 2033
Figure 61: Western Europe Market Y-o-Y Growth (%) Projections by Country, 2023 to 2033
Figure 62: Western Europe Market Value (US$ Million) Analysis by Type, 2018 to 2033
Figure 63: Western Europe Market Volume (MT) Analysis by Type, 2018 to 2033
Figure 64: Western Europe Market Value Share (%) and BPS Analysis by Type, 2023 to 2033
Figure 65: Western Europe Market Y-o-Y Growth (%) Projections by Type, 2023 to 2033
Figure 66: Western Europe Market Value (US$ Million) Analysis by Form, 2018 to 2033
Figure 67: Western Europe Market Volume (MT) Analysis by Form, 2018 to 2033
Figure 68: Western Europe Market Value Share (%) and BPS Analysis by Form, 2023 to 2033
Figure 69: Western Europe Market Y-o-Y Growth (%) Projections by Form, 2023 to 2033
Figure 70: Western Europe Market Attractiveness by Type, 2023 to 2033
Figure 71: Western Europe Market Attractiveness by Form, 2023 to 2033
Figure 72: Western Europe Market Attractiveness by Country, 2023 to 2033
Figure 73: Eastern Europe Market Value (US$ Million) by Type, 2023 to 2033
Figure 74: Eastern Europe Market Value (US$ Million) by Form, 2023 to 2033
Figure 75: Eastern Europe Market Value (US$ Million) by Country, 2023 to 2033
Figure 76: Eastern Europe Market Value (US$ Million) Analysis by Country, 2018 to 2033
Figure 77: Eastern Europe Market Volume (MT) Analysis by Country, 2018 to 2033
Figure 78: Eastern Europe Market Value Share (%) and BPS Analysis by Country, 2023 to 2033
Figure 79: Eastern Europe Market Y-o-Y Growth (%) Projections by Country, 2023 to 2033
Figure 80: Eastern Europe Market Value (US$ Million) Analysis by Type, 2018 to 2033
Figure 81: Eastern Europe Market Volume (MT) Analysis by Type, 2018 to 2033
Figure 82: Eastern Europe Market Value Share (%) and BPS Analysis by Type, 2023 to 2033
Figure 83: Eastern Europe Market Y-o-Y Growth (%) Projections by Type, 2023 to 2033
Figure 84: Eastern Europe Market Value (US$ Million) Analysis by Form, 2018 to 2033
Figure 85: Eastern Europe Market Volume (MT) Analysis by Form, 2018 to 2033
Figure 86: Eastern Europe Market Value Share (%) and BPS Analysis by Form, 2023 to 2033
Figure 87: Eastern Europe Market Y-o-Y Growth (%) Projections by Form, 2023 to 2033
Figure 88: Eastern Europe Market Attractiveness by Type, 2023 to 2033
Figure 89: Eastern Europe Market Attractiveness by Form, 2023 to 2033
Figure 90: Eastern Europe Market Attractiveness by Country, 2023 to 2033
Figure 91: South Asia and Pacific Market Value (US$ Million) by Type, 2023 to 2033
Figure 92: South Asia and Pacific Market Value (US$ Million) by Form, 2023 to 2033
Figure 93: South Asia and Pacific Market Value (US$ Million) by Country, 2023 to 2033
Figure 94: South Asia and Pacific Market Value (US$ Million) Analysis by Country, 2018 to 2033
Figure 95: South Asia and Pacific Market Volume (MT) Analysis by Country, 2018 to 2033
Figure 96: South Asia and Pacific Market Value Share (%) and BPS Analysis by Country, 2023 to 2033
Figure 97: South Asia and Pacific Market Y-o-Y Growth (%) Projections by Country, 2023 to 2033
Figure 98: South Asia and Pacific Market Value (US$ Million) Analysis by Type, 2018 to 2033
Figure 99: South Asia and Pacific Market Volume (MT) Analysis by Type, 2018 to 2033
Figure 100: South Asia and Pacific Market Value Share (%) and BPS Analysis by Type, 2023 to 2033
Figure 101: South Asia and Pacific Market Y-o-Y Growth (%) Projections by Type, 2023 to 2033
Figure 102: South Asia and Pacific Market Value (US$ Million) Analysis by Form, 2018 to 2033
Figure 103: South Asia and Pacific Market Volume (MT) Analysis by Form, 2018 to 2033
Figure 104: South Asia and Pacific Market Value Share (%) and BPS Analysis by Form, 2023 to 2033
Figure 105: South Asia and Pacific Market Y-o-Y Growth (%) Projections by Form, 2023 to 2033
Figure 106: South Asia and Pacific Market Attractiveness by Type, 2023 to 2033
Figure 107: South Asia and Pacific Market Attractiveness by Form, 2023 to 2033
Figure 108: South Asia and Pacific Market Attractiveness by Country, 2023 to 2033
Figure 109: East Asia Market Value (US$ Million) by Type, 2023 to 2033
Figure 110: East Asia Market Value (US$ Million) by Form, 2023 to 2033
Figure 111: East Asia Market Value (US$ Million) by Country, 2023 to 2033
Figure 112: East Asia Market Value (US$ Million) Analysis by Country, 2018 to 2033
Figure 113: East Asia Market Volume (MT) Analysis by Country, 2018 to 2033
Figure 114: East Asia Market Value Share (%) and BPS Analysis by Country, 2023 to 2033
Figure 115: East Asia Market Y-o-Y Growth (%) Projections by Country, 2023 to 2033
Figure 116: East Asia Market Value (US$ Million) Analysis by Type, 2018 to 2033
Figure 117: East Asia Market Volume (MT) Analysis by Type, 2018 to 2033
Figure 118: East Asia Market Value Share (%) and BPS Analysis by Type, 2023 to 2033
Figure 119: East Asia Market Y-o-Y Growth (%) Projections by Type, 2023 to 2033
Figure 120: East Asia Market Value (US$ Million) Analysis by Form, 2018 to 2033
Figure 121: East Asia Market Volume (MT) Analysis by Form, 2018 to 2033
Figure 122: East Asia Market Value Share (%) and BPS Analysis by Form, 2023 to 2033
Figure 123: East Asia Market Y-o-Y Growth (%) Projections by Form, 2023 to 2033
Figure 124: East Asia Market Attractiveness by Type, 2023 to 2033
Figure 125: East Asia Market Attractiveness by Form, 2023 to 2033
Figure 126: East Asia Market Attractiveness by Country, 2023 to 2033
Figure 127: Middle East and Africa Market Value (US$ Million) by Type, 2023 to 2033
Figure 128: Middle East and Africa Market Value (US$ Million) by Form, 2023 to 2033
Figure 129: Middle East and Africa Market Value (US$ Million) by Country, 2023 to 2033
Figure 130: Middle East and Africa Market Value (US$ Million) Analysis by Country, 2018 to 2033
Figure 131: Middle East and Africa Market Volume (MT) Analysis by Country, 2018 to 2033
Figure 132: Middle East and Africa Market Value Share (%) and BPS Analysis by Country, 2023 to 2033
Figure 133: Middle East and Africa Market Y-o-Y Growth (%) Projections by Country, 2023 to 2033
Figure 134: Middle East and Africa Market Value (US$ Million) Analysis by Type, 2018 to 2033
Figure 135: Middle East and Africa Market Volume (MT) Analysis by Type, 2018 to 2033
Figure 136: Middle East and Africa Market Value Share (%) and BPS Analysis by Type, 2023 to 2033
Figure 137: Middle East and Africa Market Y-o-Y Growth (%) Projections by Type, 2023 to 2033
Figure 138: Middle East and Africa Market Value (US$ Million) Analysis by Form, 2018 to 2033
Figure 139: Middle East and Africa Market Volume (MT) Analysis by Form, 2018 to 2033
Figure 140: Middle East and Africa Market Value Share (%) and BPS Analysis by Form, 2023 to 2033
Figure 141: Middle East and Africa Market Y-o-Y Growth (%) Projections by Form, 2023 to 2033
Figure 142: Middle East and Africa Market Attractiveness by Type, 2023 to 2033
Figure 143: Middle East and Africa Market Attractiveness by Form, 2023 to 2033
Figure 144: Middle East and Africa Market Attractiveness by Country, 2023 to 2033


Our Research Products

The "Full Research Suite" delivers actionable market intel, deep dives on markets or technologies, so clients act faster, cut risk, and unlock growth.

The Leaderboard benchmarks and ranks top vendors, classifying them as Established Leaders, Leading Challengers, or Disruptors & Challengers.

Locates where complements amplify value and substitutes erode it, forecasting net impact by horizon

We deliver granular, decision-grade intel: market sizing, 5-year forecasts, pricing, adoption, usage, revenue, and operational KPIs—plus competitor tracking, regulation, and value chains—across 60 countries broadly.

Spot the shifts before they hit your P&L. We track inflection points, adoption curves, pricing moves, and ecosystem plays to show where demand is heading, why it is changing, and what to do next across high-growth markets and disruptive tech

Real-time reads of user behavior. We track shifting priorities, perceptions of today’s and next-gen services, and provider experience, then pace how fast tech moves from trial to adoption, blending buyer, consumer, and channel inputs with social signals (#WhySwitch, #UX).

Partner with our analyst team to build a custom report designed around your business priorities. From analysing market trends to assessing competitors or crafting bespoke datasets, we tailor insights to your needs.
Supplier Intelligence
Discovery & Profiling
Capacity & Footprint
Performance & Risk
Compliance & Governance
Commercial Readiness
Who Supplies Whom
Scorecards & Shortlists
Playbooks & Docs
Category Intelligence
Definition & Scope
Demand & Use Cases
Cost Drivers
Market Structure
Supply Chain Map
Trade & Policy
Operating Norms
Deliverables
Buyer Intelligence
Account Basics
Spend & Scope
Procurement Model
Vendor Requirements
Terms & Policies
Entry Strategy
Pain Points & Triggers
Outputs
Pricing Analysis
Benchmarks
Trends
Should-Cost
Indexation
Landed Cost
Commercial Terms
Deliverables
Brand Analysis
Positioning & Value Prop
Share & Presence
Customer Evidence
Go-to-Market
Digital & Reputation
Compliance & Trust
KPIs & Gaps
Outputs
Full Research Suite comprises of:
Market outlook & trends analysis
Interviews & case studies
Strategic recommendations
Vendor profiles & capabilities analysis
5-year forecasts
8 regions and 60+ country-level data splits
Market segment data splits
12 months of continuous data updates
DELIVERED AS:
PDF EXCEL ONLINE
Yeast Beta Glucan Market Size and Share Forecast Outlook 2025 to 2035
Yeast Based Aqua Protein Market Size and Share Forecast Outlook 2025 to 2035
Yeast-based Spreads Market Size and Share Forecast Outlook 2025 to 2035
Yeast Extract Market Analysis - Size, Share, and Forecast Outlook 2025 to 2035
Yeast-derived Collagen Market Analysis – Size, Share, and Forecast Outlook 2025 to 2035
Yeast Extract Industry Analysis in USA Size, Growth, and Forecast for 2025 to 2035
Understanding Yeast Extract Market Share & Key Players
Yeastless Dough Market Growth - Innovations & Consumer Preferences 2025 to 2035
Yeast Infection Diagnostics Market Report - Demand, Trends & Industry Forecast 2025 to 2035
Yeast Nucleotides Market Analysis by Product Type, Nature, Form and Application Through 2035
Yeast Infection Treatment Market by Drug Type, Distribution Channel, End User, and Region, 2025 to 2035
Yeast Autolysates Market Outlook - Growth, Demand & Forecast 2024 to 2034
Yeast Flakes Market
UK Yeast Extract Market Report – Trends, Demand & Industry Forecast 2025–2035
Dry Yeast Market Report - Size, Demand & Forecast 2025 to 2035
GCC Yeast Market Trends – Growth, Demand & Forecast 2025–2035
USA Yeast Market Analysis – Size, Share & Forecast 2025-2035
ASEAN Yeast Market Report – Trends, Demand & Industry Forecast 2025–2035
Japan Yeast Market Insights – Demand, Size & Industry Trends 2025–2035
ASEAN Yeast Extract Market Growth – Trends, Demand & Innovations 2025–2035

Thank you!
You will receive an email from our Business Development Manager. Please be sure to check your SPAM/JUNK folder too.
Chat With
MaRIA