Yeast Beta Glucan Market Size and Share Forecast Outlook (2024 to 2034)

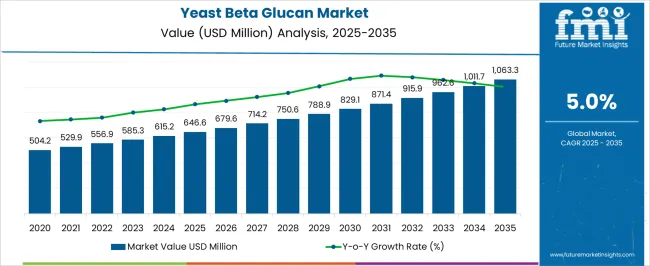
The global Yeast Beta Glucan market is expected to expand at a CAGR of 5.1% from 2024 to 2034. The market value is projected to increase from USD 615.2 million in 2024 to USD 991.5 million by 2034.

Attributes Key Insights
Estimated Global Yeast Beta Glucan Market Size (2024E) USD 615.2 million
Projected Yeast Beta Glucan Market Value (2034F) USD 991.5 million
Value-based CAGR (2024 to 2034) 5.1%

The yeast beta-glucan market is bourgeoning due to consumers' growing preference for healthy alternatives. This natural compound is becoming increasingly popular in several industries, such as food, pharmaceuticals, and cosmetics.

The heightened awareness of yeast beta-glucan's health benefits, such as supporting the immune system and cardiovascular health, is propelling its global demand. Health-conscious consumers are driving the integration of yeast beta-glucan into a wide array of food and beverage products.

Industries such as cosmetics and pharmaceuticals are embracing yeast beta-glucan for its effective properties in skin care products and pharmaceutical formulations. Further, the agriculture sector is exploring its potential for crop protection.

With significant investments from key industry players in research & development to refine formulations and explore new applications, the yeast beta-glucan market is poised for sustained growth. It offers diverse opportunities and aligns with the global shift toward health-conscious and sustainable consumer preferences.

Trends Influencing the Yeast Beta Glucan Industry

Demand for Functional Food and Effective Skincare Products Drive Sales

Key Trends
  • Increasing adoption of yeast beta-glucan in skincare and cosmetics, driven by its natural and sustainable characteristics
  • Growing demand for 1,3-glucan in functional food and beverages for its immune-boosting properties
  • There is a surge in research & development activities to unlock new applications and benefits of yeast beta-glucan
  • Escalating interest in yeast beta-glucan as a key ingredient in animal feed, promoting health and performance in livestock
  • Rising consumer awareness of the health benefits of yeast beta-glucan contributes to its prevalence in dietary supplements
  • Expansion of yeast beta-glucan applications in agriculture for enhanced crop protection and plant health
  • The emergence of innovative formulations incorporating yeast beta-glucan for its multifunctional properties in personal care products
  • Increasing preference for yeast beta-glucan as a clean-label and natural ingredient in the food industry
  • Collaborations and partnerships between key players to leverage synergies and advance yeast beta glucan market penetration
Challenges
  • The cost of producing yeast beta-glucans is high, which is set to impact the final cost of goods containing these substances. This financial barrier is expected to prevent yeast beta-glucan from being widely used, particularly in industries where cost is a factor.
  • Though knowledge of yeast beta glucans' health advantages is increasing, it can still be modest compared to other well-known components. A lack of customer knowledge is expected to reduce the yeast beta glucan-containing product market.
  • Alternative substances with comparable health advantages compete in the yeast beta glucan market. Customers and producers choose to use beta-glucans from other sources, including barley or oats, which is set to affect the market for beta-glucans made from yeast.

Sales Analysis of Yeast Beta Glucan (2019 to 2023) vs Forecast (2024 to 2034)

Between 2019 and 2023, the global yeast beta glucan market experienced a dynamic sales outlook marked by robust demand and adoption of functional food across industries.

  • The historical period witnessed an increasing trend in incorporating yeast beta-glucans in food & beverages, skin care products, dietary supplements, and agricultural applications.
  • There has been an increasing use of yeast beta-glucans in animal nutrition, especially for cattle and aquaculture.
  • The benefits of yeast beta-glucans for improving animal performance and health have motivated the incorporation of beta-glucans in animal feed.

From 2024 to 2034, the yeast beta glucan market is poised for an even more significant sales outlook of USD 991.5 million by 2034.

  • Anticipated factors contributing to growth include sustained consumer interest in natural and sustainable ingredients, continuous research & development activities unlocking new applications, and collaborations among key players to capitalize on the versatile properties of yeast beta-glucan.
  • The scenario comparison underscores a continued upward trajectory for the yeast beta-glucan market, portraying its integral role in shaping diverse sectors and meeting evolving consumer preferences for healthy and eco-conscious choices.

Analysis of Top Countries Manufacturing and Consuming Yeast Beta Glucan

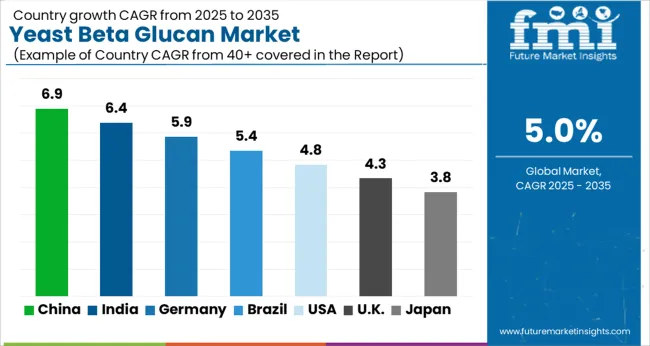
The table below shows the estimated growth rates of the top four countries. The United States, China, and Japan are set to record high CAGRs of 6.7%, 8.1%, and 5.7%, respectively, through 2034.

Countries CAGR
United States 6.7%
China 8.1%
United Kingdom 5.1%
Japan 5.7%

Robust Research and Developmental Efforts Boost the Market Growth in the United States

The United States market is projected to have a hold of 27% and reach a valuation of USD 166.1 million by 2034. The market expansion is led by the robust efforts of key players in the field of research and development. The players are also raising awareness about the product, thus fostering a culture of yeast beta-glucan adoption.

Rising Consumer Preference for Clean-label Ingredients Increasing Prospects in China

China is anticipated to capture a value share of 13.2%, reaching a valuation of USD 81.2 million by 2034. The market is led by rising health consciousness among consumers. Additionally, strategic initiatives by players to expand their footprint in this burgeoning market are also improving the market growth. Further, the expanding middle-class population and rising disposable income are expected to raise demand for health-promoting products like yeast beta-glucan.

The rising consumer demand for natural, clean-label ingredients is positioning yeast beta-glucan as a key industry in the country’s evolving health and nutrition landscape.

Increasing Fitness and Sports Nutrition Trends Spurs the United Kingdom

The United Kingdom is expected to stake a 22.0% market share, reaching a valuation of USD 135.3 million by 2024. The main factors supporting the yeast beta glucan market growth in the country are, increasing fitness and sports nutrition trends among consumers are influencing yeast beta-glucan adoption in the United Kingdom.

Collaborations with local health and wellness brands is elevating the visibility of yeast beta glucan, contributing to its market prominence. The United Kingdom’s environmentally conscious consumer base appreciates yeast beta-glucan as a sustainable and eco-friendly ingredient, aligning with the nation's broad sustainability and ethical consumption trends.
Emerging Opportunities in Japan Attracting Market Players

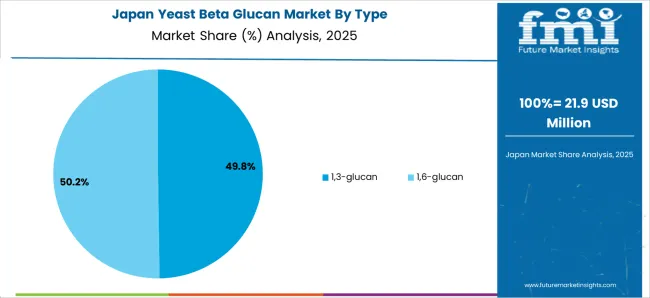
The market in Japan is expected to exhibit a CAGR of 5.7% through 2034. The demand for yeast beta-glucan in Japan is driven by the rising use of functional substances in food and supplements. The use of yeast beta-glucan is driven by its varied health advantages. Further, manufacturers and suppliers are taking proactive steps to enlighten consumers about the benefits of yeast beta-glucan and increase its popularity. The proactive efforts of yeast beta-glucan manufacturers and suppliers to educate consumers about the benefits of yeast beta-glucan contribute to their popularity in Japan.

Advanced Wellness Culture in South Korea to Push Growth

The primary factors bolstering the yeast beta glucan market size in South Korea are, the yeast beta-glucan market benefits from a progressive wellness culture in South Korea, where consumers prioritize preventive health measures. The ingredient's versatility is harnessed in traditional food & beverages and the rapidly expanding nutraceutical sector.

Yeast Beta Glucan Industry Analysis by Top Investment Segments

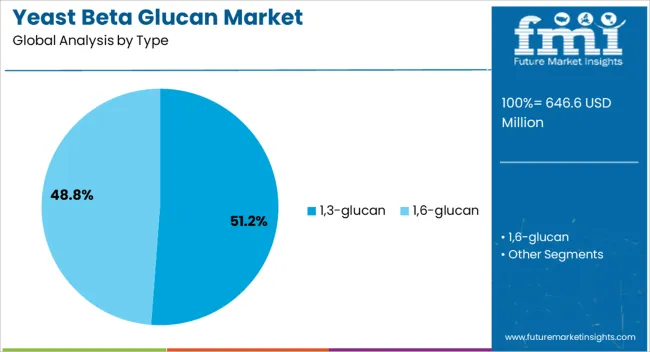
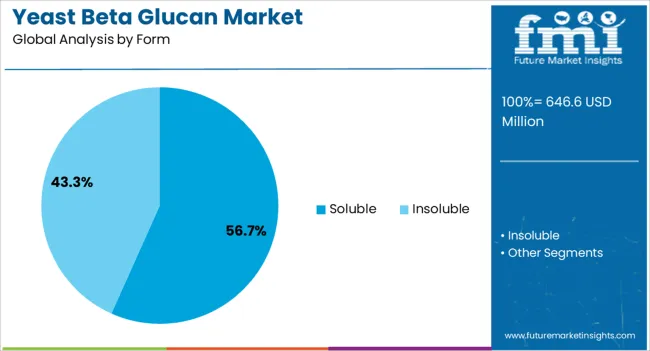
The section below shows the 1,3-glucan segment dominating by type. It is predicted to hold a market share of 51.2% in 2024. Based on form, the soluble segment is anticipated to generate a dominant share through 2024. It is set to hold a share of 56.7% in 2024.

Segment Market Share (2024)
1,3-glucan (Type) 51.2%
Soluble (Form) 56.7%
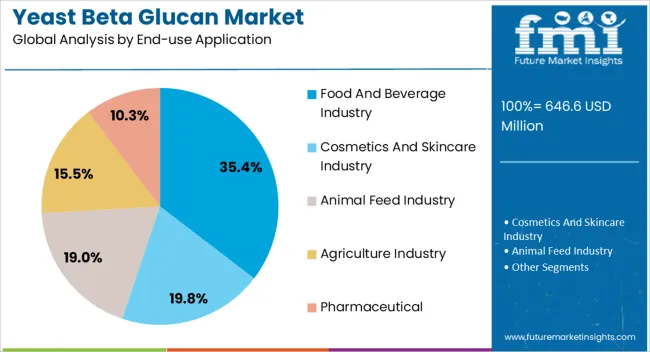
Food and beverage Industry (End Use Application) 35.4%

Demand to Remain High for 1,3-glucan through 2034

The 1,3-glucan is set to take the spotlight in the market, a trend authenticated by factors such as:

  • 1,3-glucan is in high demand due to its unique immunomodulatory properties, making it a sought-after ingredient in functional foods, dietary supplements, and pharmaceuticals.
  • Extensive research supports 1,3-glucan’s role in enhancing immune system responses, which is particularly appealing in the context of increasing consumer interest in wellness and preventive healthcare.
  • The soluble nature of 1,3-glucan allows for easy incorporation into several products, further driving its demand in the food and beverage industry.
  • 1,3-glucan’s recognition for promoting overall health positions it as a preferred choice for manufacturers looking to meet the growing demand for immunity-boosting and health-promoting products.

Soluble Yeast Beta Glucan to Witness Exception Demand

Soluble form is anticipated to lead the way, holding an impressive yeast beta glucan market share. Factors supporting its sales are as follows:

  • Soluble yeast beta-glucan is highly preferred across several industries due to its remarkable solubility in water. Its water-soluble nature enhances its versatility in formulations, making it suitable for beverages, functional foods, and dietary supplements.
  • Soluble yeast beta-glucan is known for its potential immune-boosting properties and other health benefits, contributing to its popularity in the food, pharmaceutical, and nutraceutical sectors.

Yeast Beta Glucan is Widely Used in the Food and Beverage Industry

Based on the end-use application, the food and beverage industry is projected to rise at a significant CAGR through 2034. Key factors propelling the growth of the segment are:
  • Yeast beta-glucan is finding increasing application in the food and beverage sector due to its versatile properties and health benefits. Its soluble nature allows easy incorporation into food and beverage products without affecting taste or texture.
  • Yeast beta-glucan, with its functional attributes, emerges as a desirable ingredient, contributing to the growth of the segment.

Competitive Landscape of the Yeast Beta Glucan Market

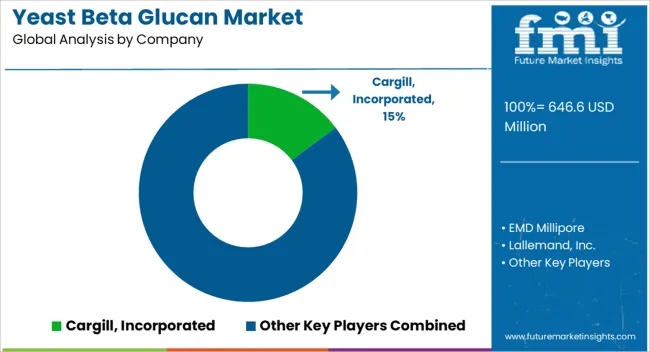
The yeast beta-glucan market has a diverse and dynamic competitive landscape. Leading companies specializing in diverse fields are focusing on research & development, sustainable sourcing, and new formulations.

Leading players are strongly emphasizing product certifications, ecologically friendly processes, and meeting the growing demand for natural & sustainable products. Further, they prioritize quality and innovation and cater to customer preferences to maintain their market position and take advantage of the rising demand.

Product Launches and Key Developments

  • In 2020, Angel Yeast augmented its yeast beta-glucan production capacity, responding to the escalating demand.
  • In December 2020, Lallemand Bio-Ingredients expanded its beta-glucan portfolio by acquiring Biotec BetaGlucans (BBG), a subsidiary of ArticZymes Technologies.
  • In April 2022, AIDP, Inc. announced the launch of Puremune™, an insoluble yeast beta-glucan from Immudyne Nutritional (Jacksonville, FL.

Key Companies Profiled in the Yeast Beta Glucan Sector

  • Cargill, Incorporated
  • EMD Millipore
  • Lallemand, Inc.
  • Van Wankum Ingredients
  • Biorigin
  • Angel Yeast Co., Ltd.
  • Kerry Group plc
  • Leiber
  • Lesaffre Human Care
  • Specialty Biotech Co., Ltd.

Top Segments Studied in the Yeast Beta Glucan Market

By Type:

  • 1,3-glucan
  • 1,6-glucan

By Form:

  • Soluble
  • Insoluble

By End-use Application:

  • Food and Beverage Industry
  • Cosmetics and Skincare Industry
  • Animal Feed Industry
  • Agriculture Industry
  • Pharmaceutical

By Region:

  • North America
  • Latin America
  • Europe
  • East Asia
  • South Asia
  • Oceania
  • Middle East and Africa

Table of Content

  • 1. Executive Summary
  • 2. Market Overview
  • 3. Market Dynamics
  • 4. Value Chain Analysis
  • 5. Global Market - Pricing Analysis
  • 6. Global Market Size (in Value (USD million) and Volume (MT)) Analysis 2019 to 2023 and Forecast, 2024 to 2034
  • 7. Global Market Analysis 2019 to 2023 and Forecast 2024 to 2034, By Form
    • 7.1. Soluble
    • 7.2. Insoluble
  • 8. Global Market Analysis 2019 to 2023 and Forecast 2024 to 2034, By Type
    • 8.1. 1,3-glucan
    • 8.2. 1,6-glucan
  • 9. Global Market Analysis 2019 to 2023 and Forecast 2024 to 2034, By End-use Application
    • 9.1. Food and Beverage Industry
    • 9.2. Cosmetics and Skincare Industry
    • 9.3. Animal Feed Industry
    • 9.4. Agriculture Industry
  • 10. Global Market Analysis 2019 to 2023 and Forecast 2024 to 2034, By Region
    • 10.1. North America
    • 10.2. Latin America
    • 10.3. Europe
    • 10.4. East Asia
    • 10.5. South Asia
    • 10.6. Oceania
    • 10.7. Middle East and Africa
  • 11. North America Market Analysis 2019 to 2023 and Forecast 2024 to 2034
  • 12. Latin America Market Analysis 2019 to 2023 and Forecast 2024 to 2034
  • 13. Europe Market Analysis 2019 to 2023 and Forecast 2024 to 2034
  • 14. East Asia Market Analysis 2019 to 2023 and Forecast 2024 to 2034
  • 15. South Asia Market Analysis 2019 to 2023 and Forecast 2024 to 2034
  • 16. Oceania Market Analysis 2019 to 2023 and Forecast 2024 to 2034
  • 17. Middle East and Africa Market Analysis 2019 to 2023 and Forecast 2024 to 2034
  • 18. Country-level Market Analysis, 2024
  • 19. Market Structure Analysis
  • 20. Competition Analysis
    • 20.1. Leiber
    • 20.2. Cargill, Incorporated
    • 20.3. Lesaffre Human Care
    • 20.4. EMD Millipore
    • 20.5. Biorigin
    • 20.6. Kerry Group plc
    • 20.7. Lallemand, Inc.
    • 20.8. Specialty Biotech Co., Ltd.
    • 20.9. Van Wankum Ingredients
    • 20.10. Angel Yeast Co., Ltd.
    • 20.11. Other Players (On Additional Requests)
  • 21. Assumptions and Acronyms Used
  • 22. Research Methodology

List of Tables

Table 1: Global Market Value (US$ million) Forecast by Region, 2019 to 2034

Table 2: Global Market Volume (MT) Forecast by Region, 2019 to 2034

Table 3: Global Market Value (US$ million) Forecast by Type, 2019 to 2034

Table 4: Global Market Volume (MT) Forecast by Type, 2019 to 2034

Table 5: Global Market Value (US$ million) Forecast by Form, 2019 to 2034

Table 6: Global Market Volume (MT) Forecast by Form, 2019 to 2034

Table 7: Global Market Value (US$ million) Forecast by End-use Application, 2019 to 2034

Table 8: Global Market Volume (MT) Forecast by End-use Application, 2019 to 2034

Table 9: North America Market Value (US$ million) Forecast by Country, 2019 to 2034

Table 10: North America Market Volume (MT) Forecast by Country, 2019 to 2034

Table 11: North America Market Value (US$ million) Forecast by Type, 2019 to 2034

Table 12: North America Market Volume (MT) Forecast by Type, 2019 to 2034

Table 13: North America Market Value (US$ million) Forecast by Form, 2019 to 2034

Table 14: North America Market Volume (MT) Forecast by Form, 2019 to 2034

Table 15: North America Market Value (US$ million) Forecast by End-use Application, 2019 to 2034

Table 16: North America Market Volume (MT) Forecast by End-use Application, 2019 to 2034

Table 17: Latin America Market Value (US$ million) Forecast by Country, 2019 to 2034

Table 18: Latin America Market Volume (MT) Forecast by Country, 2019 to 2034

Table 19: Latin America Market Value (US$ million) Forecast by Type, 2019 to 2034

Table 20: Latin America Market Volume (MT) Forecast by Type, 2019 to 2034

Table 21: Latin America Market Value (US$ million) Forecast by Form, 2019 to 2034

Table 22: Latin America Market Volume (MT) Forecast by Form, 2019 to 2034

Table 23: Latin America Market Value (US$ million) Forecast by End-use Application, 2019 to 2034

Table 24: Latin America Market Volume (MT) Forecast by End-use Application, 2019 to 2034

Table 25: Europe Market Value (US$ million) Forecast by Country, 2019 to 2034

Table 26: Europe Market Volume (MT) Forecast by Country, 2019 to 2034

Table 27: Europe Market Value (US$ million) Forecast by Type, 2019 to 2034

Table 28: Europe Market Volume (MT) Forecast by Type, 2019 to 2034

Table 29: Europe Market Value (US$ million) Forecast by Form, 2019 to 2034

Table 30: Europe Market Volume (MT) Forecast by Form, 2019 to 2034

Table 31: Europe Market Value (US$ million) Forecast by End-use Application, 2019 to 2034

Table 32: Europe Market Volume (MT) Forecast by End-use Application, 2019 to 2034

Table 33: East Asia Market Value (US$ million) Forecast by Country, 2019 to 2034

Table 34: East Asia Market Volume (MT) Forecast by Country, 2019 to 2034

Table 35: East Asia Market Value (US$ million) Forecast by Type, 2019 to 2034

Table 36: East Asia Market Volume (MT) Forecast by Type, 2019 to 2034

Table 37: East Asia Market Value (US$ million) Forecast by Form, 2019 to 2034

Table 38: East Asia Market Volume (MT) Forecast by Form, 2019 to 2034

Table 39: East Asia Market Value (US$ million) Forecast by End-use Application, 2019 to 2034

Table 40: East Asia Market Volume (MT) Forecast by End-use Application, 2019 to 2034

Table 41: South Asia Market Value (US$ million) Forecast by Country, 2019 to 2034

Table 42: South Asia Market Volume (MT) Forecast by Country, 2019 to 2034

Table 43: South Asia Market Value (US$ million) Forecast by Type, 2019 to 2034

Table 44: South Asia Market Volume (MT) Forecast by Type, 2019 to 2034

Table 45: South Asia Market Value (US$ million) Forecast by Form, 2019 to 2034

Table 46: South Asia Market Volume (MT) Forecast by Form, 2019 to 2034

Table 47: South Asia Market Value (US$ million) Forecast by End-use Application, 2019 to 2034

Table 48: South Asia Market Volume (MT) Forecast by End-use Application, 2019 to 2034

Table 49: Oceania Market Value (US$ million) Forecast by Country, 2019 to 2034

Table 50: Oceania Market Volume (MT) Forecast by Country, 2019 to 2034

Table 51: Oceania Market Value (US$ million) Forecast by Type, 2019 to 2034

Table 52: Oceania Market Volume (MT) Forecast by Type, 2019 to 2034

Table 53: Oceania Market Value (US$ million) Forecast by Form, 2019 to 2034

Table 54: Oceania Market Volume (MT) Forecast by Form, 2019 to 2034

Table 55: Oceania Market Value (US$ million) Forecast by End-use Application, 2019 to 2034

Table 56: Oceania Market Volume (MT) Forecast by End-use Application, 2019 to 2034

Table 57: Middle East and Africa Market Value (US$ million) Forecast by Country, 2019 to 2034

Table 58: Middle East and Africa Market Volume (MT) Forecast by Country, 2019 to 2034

Table 59: Middle East and Africa Market Value (US$ million) Forecast by Type, 2019 to 2034

Table 60: Middle East and Africa Market Volume (MT) Forecast by Type, 2019 to 2034

Table 61: Middle East and Africa Market Value (US$ million) Forecast by Form, 2019 to 2034

Table 62: Middle East and Africa Market Volume (MT) Forecast by Form, 2019 to 2034

Table 63: Middle East and Africa Market Value (US$ million) Forecast by End-use Application, 2019 to 2034

Table 64: Middle East and Africa Market Volume (MT) Forecast by End-use Application, 2019 to 2034

List of Figures

Figure 1: Global Market Value (US$ million) by Type, 2024 to 2034

Figure 2: Global Market Value (US$ million) by Form, 2024 to 2034

Figure 3: Global Market Value (US$ million) by End-use Application, 2024 to 2034

Figure 4: Global Market Value (US$ million) by Region, 2024 to 2034

Figure 5: Global Market Value (US$ million) Analysis by Region, 2019 to 2034

Figure 6: Global Market Volume (MT) Analysis by Region, 2019 to 2034

Figure 7: Global Market Value Share (%) and BPS Analysis by Region, 2024 to 2034

Figure 8: Global Market Y-o-Y Growth (%) Projections by Region, 2024 to 2034

Figure 9: Global Market Value (US$ million) Analysis by Type, 2019 to 2034

Figure 10: Global Market Volume (MT) Analysis by Type, 2019 to 2034

Figure 11: Global Market Value Share (%) and BPS Analysis by Type, 2024 to 2034

Figure 12: Global Market Y-o-Y Growth (%) Projections by Type, 2024 to 2034

Figure 13: Global Market Value (US$ million) Analysis by Form, 2019 to 2034

Figure 14: Global Market Volume (MT) Analysis by Form, 2019 to 2034

Figure 15: Global Market Value Share (%) and BPS Analysis by Form, 2024 to 2034

Figure 16: Global Market Y-o-Y Growth (%) Projections by Form, 2024 to 2034

Figure 17: Global Market Value (US$ million) Analysis by End-use Application, 2019 to 2034

Figure 18: Global Market Volume (MT) Analysis by End-use Application, 2019 to 2034

Figure 19: Global Market Value Share (%) and BPS Analysis by End-use Application, 2024 to 2034

Figure 20: Global Market Y-o-Y Growth (%) Projections by End-use Application, 2024 to 2034

Figure 21: Global Market Attractiveness by Type, 2024 to 2034

Figure 22: Global Market Attractiveness by Form, 2024 to 2034

Figure 23: Global Market Attractiveness by End-use Application, 2024 to 2034

Figure 24: Global Market Attractiveness by Region, 2024 to 2034

Figure 25: North America Market Value (US$ million) by Type, 2024 to 2034

Figure 26: North America Market Value (US$ million) by Form, 2024 to 2034

Figure 27: North America Market Value (US$ million) by End-use Application, 2024 to 2034

Figure 28: North America Market Value (US$ million) by Country, 2024 to 2034

Figure 29: North America Market Value (US$ million) Analysis by Country, 2019 to 2034

Figure 30: North America Market Volume (MT) Analysis by Country, 2019 to 2034

Figure 31: North America Market Value Share (%) and BPS Analysis by Country, 2024 to 2034

Figure 32: North America Market Y-o-Y Growth (%) Projections by Country, 2024 to 2034

Figure 33: North America Market Value (US$ million) Analysis by Type, 2019 to 2034

Figure 34: North America Market Volume (MT) Analysis by Type, 2019 to 2034

Figure 35: North America Market Value Share (%) and BPS Analysis by Type, 2024 to 2034

Figure 36: North America Market Y-o-Y Growth (%) Projections by Type, 2024 to 2034

Figure 37: North America Market Value (US$ million) Analysis by Form, 2019 to 2034

Figure 38: North America Market Volume (MT) Analysis by Form, 2019 to 2034

Figure 39: North America Market Value Share (%) and BPS Analysis by Form, 2024 to 2034

Figure 40: North America Market Y-o-Y Growth (%) Projections by Form, 2024 to 2034

Figure 41: North America Market Value (US$ million) Analysis by End-use Application, 2019 to 2034

Figure 42: North America Market Volume (MT) Analysis by End-use Application, 2019 to 2034

Figure 43: North America Market Value Share (%) and BPS Analysis by End-use Application, 2024 to 2034

Figure 44: North America Market Y-o-Y Growth (%) Projections by End-use Application, 2024 to 2034

Figure 45: North America Market Attractiveness by Type, 2024 to 2034

Figure 46: North America Market Attractiveness by Form, 2024 to 2034

Figure 47: North America Market Attractiveness by End-use Application, 2024 to 2034

Figure 48: North America Market Attractiveness by Country, 2024 to 2034

Figure 49: Latin America Market Value (US$ million) by Type, 2024 to 2034

Figure 50: Latin America Market Value (US$ million) by Form, 2024 to 2034

Figure 51: Latin America Market Value (US$ million) by End-use Application, 2024 to 2034

Figure 52: Latin America Market Value (US$ million) by Country, 2024 to 2034

Figure 53: Latin America Market Value (US$ million) Analysis by Country, 2019 to 2034

Figure 54: Latin America Market Volume (MT) Analysis by Country, 2019 to 2034

Figure 55: Latin America Market Value Share (%) and BPS Analysis by Country, 2024 to 2034

Figure 56: Latin America Market Y-o-Y Growth (%) Projections by Country, 2024 to 2034

Figure 57: Latin America Market Value (US$ million) Analysis by Type, 2019 to 2034

Figure 58: Latin America Market Volume (MT) Analysis by Type, 2019 to 2034

Figure 59: Latin America Market Value Share (%) and BPS Analysis by Type, 2024 to 2034

Figure 60: Latin America Market Y-o-Y Growth (%) Projections by Type, 2024 to 2034

Figure 61: Latin America Market Value (US$ million) Analysis by Form, 2019 to 2034

Figure 62: Latin America Market Volume (MT) Analysis by Form, 2019 to 2034

Figure 63: Latin America Market Value Share (%) and BPS Analysis by Form, 2024 to 2034

Figure 64: Latin America Market Y-o-Y Growth (%) Projections by Form, 2024 to 2034

Figure 65: Latin America Market Value (US$ million) Analysis by End-use Application, 2019 to 2034

Figure 66: Latin America Market Volume (MT) Analysis by End-use Application, 2019 to 2034

Figure 67: Latin America Market Value Share (%) and BPS Analysis by End-use Application, 2024 to 2034

Figure 68: Latin America Market Y-o-Y Growth (%) Projections by End-use Application, 2024 to 2034

Figure 69: Latin America Market Attractiveness by Type, 2024 to 2034

Figure 70: Latin America Market Attractiveness by Form, 2024 to 2034

Figure 71: Latin America Market Attractiveness by End-use Application, 2024 to 2034

Figure 72: Latin America Market Attractiveness by Country, 2024 to 2034

Figure 73: Europe Market Value (US$ million) by Type, 2024 to 2034

Figure 74: Europe Market Value (US$ million) by Form, 2024 to 2034

Figure 75: Europe Market Value (US$ million) by End-use Application, 2024 to 2034

Figure 76: Europe Market Value (US$ million) by Country, 2024 to 2034

Figure 77: Europe Market Value (US$ million) Analysis by Country, 2019 to 2034

Figure 78: Europe Market Volume (MT) Analysis by Country, 2019 to 2034

Figure 79: Europe Market Value Share (%) and BPS Analysis by Country, 2024 to 2034

Figure 80: Europe Market Y-o-Y Growth (%) Projections by Country, 2024 to 2034

Figure 81: Europe Market Value (US$ million) Analysis by Type, 2019 to 2034

Figure 82: Europe Market Volume (MT) Analysis by Type, 2019 to 2034

Figure 83: Europe Market Value Share (%) and BPS Analysis by Type, 2024 to 2034

Figure 84: Europe Market Y-o-Y Growth (%) Projections by Type, 2024 to 2034

Figure 85: Europe Market Value (US$ million) Analysis by Form, 2019 to 2034

Figure 86: Europe Market Volume (MT) Analysis by Form, 2019 to 2034

Figure 87: Europe Market Value Share (%) and BPS Analysis by Form, 2024 to 2034

Figure 88: Europe Market Y-o-Y Growth (%) Projections by Form, 2024 to 2034

Figure 89: Europe Market Value (US$ million) Analysis by End-use Application, 2019 to 2034

Figure 90: Europe Market Volume (MT) Analysis by End-use Application, 2019 to 2034

Figure 91: Europe Market Value Share (%) and BPS Analysis by End-use Application, 2024 to 2034

Figure 92: Europe Market Y-o-Y Growth (%) Projections by End-use Application, 2024 to 2034

Figure 93: Europe Market Attractiveness by Type, 2024 to 2034

Figure 94: Europe Market Attractiveness by Form, 2024 to 2034

Figure 95: Europe Market Attractiveness by End-use Application, 2024 to 2034

Figure 96: Europe Market Attractiveness by Country, 2024 to 2034

Figure 97: East Asia Market Value (US$ million) by Type, 2024 to 2034

Figure 98: East Asia Market Value (US$ million) by Form, 2024 to 2034

Figure 99: East Asia Market Value (US$ million) by End-use Application, 2024 to 2034

Figure 100: East Asia Market Value (US$ million) by Country, 2024 to 2034

Figure 101: East Asia Market Value (US$ million) Analysis by Country, 2019 to 2034

Figure 102: East Asia Market Volume (MT) Analysis by Country, 2019 to 2034

Figure 103: East Asia Market Value Share (%) and BPS Analysis by Country, 2024 to 2034

Figure 104: East Asia Market Y-o-Y Growth (%) Projections by Country, 2024 to 2034

Figure 105: East Asia Market Value (US$ million) Analysis by Type, 2019 to 2034

Figure 106: East Asia Market Volume (MT) Analysis by Type, 2019 to 2034

Figure 107: East Asia Market Value Share (%) and BPS Analysis by Type, 2024 to 2034

Figure 108: East Asia Market Y-o-Y Growth (%) Projections by Type, 2024 to 2034

Figure 109: East Asia Market Value (US$ million) Analysis by Form, 2019 to 2034

Figure 110: East Asia Market Volume (MT) Analysis by Form, 2019 to 2034

Figure 111: East Asia Market Value Share (%) and BPS Analysis by Form, 2024 to 2034

Figure 112: East Asia Market Y-o-Y Growth (%) Projections by Form, 2024 to 2034

Figure 113: East Asia Market Value (US$ million) Analysis by End-use Application, 2019 to 2034

Figure 114: East Asia Market Volume (MT) Analysis by End-use Application, 2019 to 2034

Figure 115: East Asia Market Value Share (%) and BPS Analysis by End-use Application, 2024 to 2034

Figure 116: East Asia Market Y-o-Y Growth (%) Projections by End-use Application, 2024 to 2034

Figure 117: East Asia Market Attractiveness by Type, 2024 to 2034

Figure 118: East Asia Market Attractiveness by Form, 2024 to 2034

Figure 119: East Asia Market Attractiveness by End-use Application, 2024 to 2034

Figure 120: East Asia Market Attractiveness by Country, 2024 to 2034

Figure 121: South Asia Market Value (US$ million) by Type, 2024 to 2034

Figure 122: South Asia Market Value (US$ million) by Form, 2024 to 2034

Figure 123: South Asia Market Value (US$ million) by End-use Application, 2024 to 2034

Figure 124: South Asia Market Value (US$ million) by Country, 2024 to 2034

Figure 125: South Asia Market Value (US$ million) Analysis by Country, 2019 to 2034

Figure 126: South Asia Market Volume (MT) Analysis by Country, 2019 to 2034

Figure 127: South Asia Market Value Share (%) and BPS Analysis by Country, 2024 to 2034

Figure 128: South Asia Market Y-o-Y Growth (%) Projections by Country, 2024 to 2034

Figure 129: South Asia Market Value (US$ million) Analysis by Type, 2019 to 2034

Figure 130: South Asia Market Volume (MT) Analysis by Type, 2019 to 2034

Figure 131: South Asia Market Value Share (%) and BPS Analysis by Type, 2024 to 2034

Figure 132: South Asia Market Y-o-Y Growth (%) Projections by Type, 2024 to 2034

Figure 133: South Asia Market Value (US$ million) Analysis by Form, 2019 to 2034

Figure 134: South Asia Market Volume (MT) Analysis by Form, 2019 to 2034

Figure 135: South Asia Market Value Share (%) and BPS Analysis by Form, 2024 to 2034

Figure 136: South Asia Market Y-o-Y Growth (%) Projections by Form, 2024 to 2034

Figure 137: South Asia Market Value (US$ million) Analysis by End-use Application, 2019 to 2034

Figure 138: South Asia Market Volume (MT) Analysis by End-use Application, 2019 to 2034

Figure 139: South Asia Market Value Share (%) and BPS Analysis by End-use Application, 2024 to 2034

Figure 140: South Asia Market Y-o-Y Growth (%) Projections by End-use Application, 2024 to 2034

Figure 141: South Asia Market Attractiveness by Type, 2024 to 2034

Figure 142: South Asia Market Attractiveness by Form, 2024 to 2034

Figure 143: South Asia Market Attractiveness by End-use Application, 2024 to 2034

Figure 144: South Asia Market Attractiveness by Country, 2024 to 2034

Figure 145: Oceania Market Value (US$ million) by Type, 2024 to 2034

Figure 146: Oceania Market Value (US$ million) by Form, 2024 to 2034

Figure 147: Oceania Market Value (US$ million) by End-use Application, 2024 to 2034

Figure 148: Oceania Market Value (US$ million) by Country, 2024 to 2034

Figure 149: Oceania Market Value (US$ million) Analysis by Country, 2019 to 2034

Figure 150: Oceania Market Volume (MT) Analysis by Country, 2019 to 2034

Figure 151: Oceania Market Value Share (%) and BPS Analysis by Country, 2024 to 2034

Figure 152: Oceania Market Y-o-Y Growth (%) Projections by Country, 2024 to 2034

Figure 153: Oceania Market Value (US$ million) Analysis by Type, 2019 to 2034

Figure 154: Oceania Market Volume (MT) Analysis by Type, 2019 to 2034

Figure 155: Oceania Market Value Share (%) and BPS Analysis by Type, 2024 to 2034

Figure 156: Oceania Market Y-o-Y Growth (%) Projections by Type, 2024 to 2034

Figure 157: Oceania Market Value (US$ million) Analysis by Form, 2019 to 2034

Figure 158: Oceania Market Volume (MT) Analysis by Form, 2019 to 2034

Figure 159: Oceania Market Value Share (%) and BPS Analysis by Form, 2024 to 2034

Figure 160: Oceania Market Y-o-Y Growth (%) Projections by Form, 2024 to 2034

Figure 161: Oceania Market Value (US$ million) Analysis by End-use Application, 2019 to 2034

Figure 162: Oceania Market Volume (MT) Analysis by End-use Application, 2019 to 2034

Figure 163: Oceania Market Value Share (%) and BPS Analysis by End-use Application, 2024 to 2034

Figure 164: Oceania Market Y-o-Y Growth (%) Projections by End-use Application, 2024 to 2034

Figure 165: Oceania Market Attractiveness by Type, 2024 to 2034

Figure 166: Oceania Market Attractiveness by Form, 2024 to 2034

Figure 167: Oceania Market Attractiveness by End-use Application, 2024 to 2034

Figure 168: Oceania Market Attractiveness by Country, 2024 to 2034

Figure 169: Middle East and Africa Market Value (US$ million) by Type, 2024 to 2034

Figure 170: Middle East and Africa Market Value (US$ million) by Form, 2024 to 2034

Figure 171: Middle East and Africa Market Value (US$ million) by End-use Application, 2024 to 2034

Figure 172: Middle East and Africa Market Value (US$ million) by Country, 2024 to 2034

Figure 173: Middle East and Africa Market Value (US$ million) Analysis by Country, 2019 to 2034

Figure 174: Middle East and Africa Market Volume (MT) Analysis by Country, 2019 to 2034

Figure 175: Middle East and Africa Market Value Share (%) and BPS Analysis by Country, 2024 to 2034

Figure 176: Middle East and Africa Market Y-o-Y Growth (%) Projections by Country, 2024 to 2034

Figure 177: Middle East and Africa Market Value (US$ million) Analysis by Type, 2019 to 2034

Figure 178: Middle East and Africa Market Volume (MT) Analysis by Type, 2019 to 2034

Figure 179: Middle East and Africa Market Value Share (%) and BPS Analysis by Type, 2024 to 2034

Figure 180: Middle East and Africa Market Y-o-Y Growth (%) Projections by Type, 2024 to 2034

Figure 181: Middle East and Africa Market Value (US$ million) Analysis by Form, 2019 to 2034

Figure 182: Middle East and Africa Market Volume (MT) Analysis by Form, 2019 to 2034

Figure 183: Middle East and Africa Market Value Share (%) and BPS Analysis by Form, 2024 to 2034

Figure 184: Middle East and Africa Market Y-o-Y Growth (%) Projections by Form, 2024 to 2034

Figure 185: Middle East and Africa Market Value (US$ million) Analysis by End-use Application, 2019 to 2034

Figure 186: Middle East and Africa Market Volume (MT) Analysis by End-use Application, 2019 to 2034

Figure 187: Middle East and Africa Market Value Share (%) and BPS Analysis by End-use Application, 2024 to 2034

Figure 188: Middle East and Africa Market Y-o-Y Growth (%) Projections by End-use Application, 2024 to 2034

Figure 189: Middle East and Africa Market Attractiveness by Type, 2024 to 2034

Figure 190: Middle East and Africa Market Attractiveness by Form, 2024 to 2034

Figure 191: Middle East and Africa Market Attractiveness by End-use Application, 2024 to 2034

Figure 192: Middle East and Africa Market Attractiveness by Country, 2024 to 2034

Frequently Asked Questions

How big is the yeast beta glucan market?

The market is set to reach USD 615.2 million in 2024.

What is the forecast for the yeast beta glucan market?

Demand for yeast beta-glucan is slated to expand at a 5.1% CAGR by 2034.

What is the outlook for the yeast beta glucan market?

The market is set to reach USD 991.5 million in 2034.

Who are the key players in the yeast beta glucan market?

Lesaffre Human Care, Cargill, Incorporated, and EMD Millipore are the key players.

Which type would lead the yeast beta glucan market?

1,3-glucan is expected to lead the market with a 51.2% share in 2024.

Explore Similar Insights

Future Market Insights

Yeast Beta Glucan Market