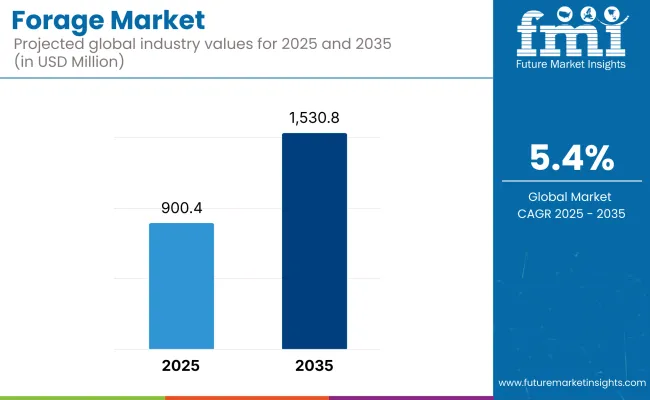
The global Forage industry is estimated to be worth USD 900.4 million by 2025 and is anticipated to reach USD 1,530.8 million by 2035, reflecting a CAGR of 5.4% over the assessment period 2025 to 2035.
There is an increasing demand for higher-quality animal feed that can ensure livestock's good health and productivity. Forage refers to the grasses, legumes, and silage that are mainly eaten by cattle, sheep, and goats, which are ruminating animals. There is growth due to the steady rise of sustainable agricultural practices and organic cattle production.
The major driver of this growth is the advancing livestock sector and the increasing global demand for meat and dairy products. Farmers and feed manufacturers are prioritizing nutrient-rich forage crops to enhance animal digestion, milk production, and weight gain. Furthermore, the transition toward non-GMO and chemical-free feed is changing the way consumers think and directing the course of the industry.
The development of hydroponics and precision farming also drives innovation. High-tech growing methods, like vertical farming and controlled-environment agriculture, are leading to better consistency in yield and nutritional quality. The broader use of blends, like alfalfa, clover, and timothy grass, is a further factor enhancing not just feed diversity but livestock performance, too.
Advancements in technologies related to harvesting fodder, preserving, and storing it are linking crop quality to feed reduction of nutrient loss. Additionally, the progress of fortified and enriched products by adding probiotics, vitamins, and minerals is also advancing. Furthermore, digital tools that enable monitoring soil health and crop rotation are helping farmers in their battle for improved crop production.
Nevertheless, certain restraints exist, such as the effect of climate change on crop yields, the unpredictability of feed prices, and supply chain problems. Furthermore, the competition posed by commercial compound feed products can affect the adoption of traditional forage-based diets.
However, these hurdles offer ways for continuous development in the sector. The growing need for organic and sustainably sourced fodder, along with government schemes geared towards promoting regenerative agriculture and soil conservation, offers new paths for growth. Introducing alternative protein sources in animal nutrition is likely to encourage further advancement in feeding the animals with forage-based solutions.
As animal husbandry producers focus on nutrition and sustainability, good growth is likely in the years to come.
Sales are gradually increasing, led by dairy farms and livestock feed industries, which require high-quality alfalfa, silage, and hay. The growing global demand for dairy and meat products has resulted in the use of nutrient-rich fodder to improve animal health and productivity.
In horse nutrition, forage is selected based on digestibility and mineral value, and organic and non-GMO foods are becoming increasingly popular. Manufacturers add forage to poultry feeds for fiber and natural antioxidants, although in lesser quantities than to livestock.
Sustainability is impacting trends with a focus on drought-tolerant crops and organic growing methods. Developments in preservation, silage additives, and hydroponic fodder systems are also on the horizon. Cost efficiency continues to be an important consideration, particularly for high-volume feed operations, and price fluctuations of fodder crops are a major buying concern.
Between 2020 and 2024, there was steady expansion in the industry, and the key driver was growth in animal protein demand as well as increased production of livestock. There was increased demand for milk and meat between 2020 and 2024, especially among emerging countries in Asia-Pacific, Latin America, and the Middle East.
Global population growth and shifting dietary preferences towards protein food stimulated demand for high-quality fodder to underpin more livestock production. There are tech advancements, including superior seed genetics and precision harvesting, enhanced crop quality, and yields.
2025 to 2035 will be a transformative era characterized by technological revolution, shifting trade flows, and shifting livestock production patterns. Growing emphasis on livestock productivity and nutritional maximization will drive demand for innovative solutions, including biofortified crops and precision fermentation technologies.
Growing global demand for high-quality meat and dairy will compel producers to be led towards higher-quality fodder that enhances animal well-being and efficiency of yield. However, expanding sales in Southeast Asia, Africa, and South America will increasingly become prominent in propelling consumption, with urbanization and expanding middle-class populations propelling higher demand for animal products.
A Comparative Market Shift Analysis (2020 to 2024 vs. 2025 to 2035)
| 2020 to 2024 | 2025 to 2035 |
|---|---|
| Increased need for good quality animal feed, increasing livestock farming, and increasing awareness about forage values. | Enhanced breeding technology, climate-tolerant fodder types, and green pastureland management practices. |
| Organic and non-GMO fodder demand, increasing need for alfalfa and grassland types. | Shifting to precision nutrition using individualized mix, need for innovative protein-rich fodder crops. |
| Enhanced high-protein fodder development, silage storage methods, and higher fiber digestibility. | Artificial intelligence-based fodder optimization, genetically engineered high-yielding varieties, and smart silage fermentation technology. |
| Adoption of regenerative agriculture, reduced chemical use, and improved water management. | Carbon-neutral production, eco-friendly packaging for preserved fodder, and artificial intelligence-based resource-efficient agriculture. |
| Digital solutions for quality evaluation and precision harvesting machinery. | Automated fodder analysis, drone-based pasture management, and IoT-based grazing optimization. |
There are challenges such as climate change due to the erratic weather, drought, and extremely high temperatures that directly affect the productivity of crops. The changing pattern of rain and the conditions of the soil, in turn, alter the quality of fodder and its availability altogether, thus necessitating farmers and suppliers to implement resilient agricultural practices, including, but not limited to, drought-resistant crops and precision farming techniques.
Supply chain disruptions are a major challenge owing to the lack of transport, shortage of labor, and geopolitical trade limitations. Global fluctuations in grain and feed prices raise costs, which results in livestock producers` profitability problems. Finding local suppliers and introducing various suppliers will partly help reduce the risks stemming from external dependencies.
Demand changes are influencing price volatility. For instance, livestock population variations, new meat and dairy consumption trends, and the introduction of alternative feed products are the factors that affect fodder demand. Producers must include industry trend monitoring in their plans, modify production where necessary, and explore value-added products to maintain their competitive advantage.
Technological improvements in processing and storage both provide prospects and challenges. Despite innovations that boost space use and add nutritional value to feed, obstacles in the form of high startup costs and the requirements of specific training impede the likelihood of its adoption. Investors should measure technology development against cost-effectiveness in order to achieve the desired longevity and, therefore, maintain sustainability in the long run.
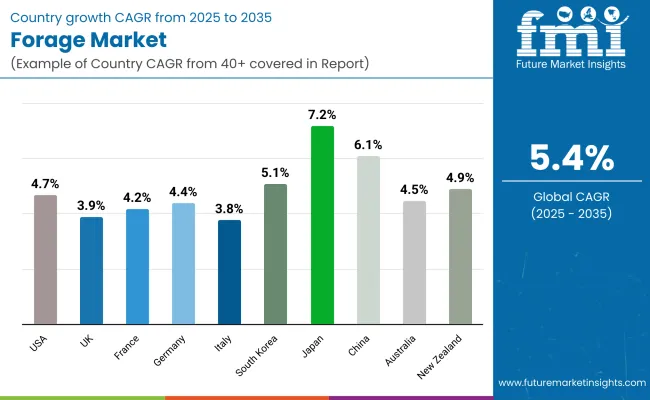
| Countries | CAGR |
|---|---|
| USA | 4.7% |
| UK | 3.9% |
| France | 4.2% |
| Germany | 4.4% |
| Italy | 3.8% |
| South Korea | 5.1% |
| Japan | 7.2% |
| China | 6.1% |
| Australia | 4.5% |
| New Zealand | 4.9% |
The USA is undergoing steady growth fueled by progress in agricultural technology and rising requirements for high-performance animal feed. With an extremely strong emphasis on enhancing feed efficiency, USA producers are increasingly turning towards genetically enhanced fodder crops like high-biomass alfalfa and resilient grasses.
Its dairy and beef economies are highly dependent on fodder, and it is investing in precision farming systems and storage facilities to reduce post-harvest losses. Support from government schemes and subsidies for sustainable agriculture are also driving growth. A well-established export infrastructure also complements the USA and is now emerging as a leading supplier.
An increasing focus on sustainable and organic feed defines the UK. With stringent environmental legislation, producers are shifting to green fodder production, such as carbon-neutral pastures and regenerative agriculture. Precision farming has gone large in the UK, ushering in greater possibilities for yield increase efficiency, especially for perennial ryegrass and clover, both of which are traditional fodder crops.
Furthermore, there is strong support from demand in the dairy sector, where quality is most important to influence milk production. Uncertainty surrounding trade policy in the post-Brexit world has, however, added sophistication in achieving constant supply chains, affecting market behavior.
France is expanding because of its strong dairy and meat industries. Since it is one of the leading agricultural countries in Europe, France is emphasizing achieving self-sufficiency via fodder production through the application of modern irrigation and fertilization techniques. The country is also improving sustainable feeding techniques for animals and promoting the use of mixed blends of fodder to improve the health and efficiency of ruminants.
France's geography is also conducive to a variety of fodder crops, ranging from alfalfa to silage maize, which forms a secure home supply. Increasing demand for organic farming also influences sales, with farmers employing biodynamic farming practices.
Technical innovation in agritech and increased demand for energy-dense formulation of feeds are mainly driving growth in Germany. The country has played a leading role in the development of independent harvesting machinery that enhances productivity and minimizes labor costs. The animal husbandry sector, especially in the dairy sector, is still a major consumer of fodder, with a preference for clover-based and silage maize feed.
Strong research and development centers in Germany are propelling innovation in processing to provide higher nutritional value and longer shelf life. Government-supported programs for sustainable agriculture are also propelling the use of climate-resilient crop varieties.
Italy is dominated by its established livestock sector, which emphasizes quality dairy production. The country's Mediterranean climate encourages multiplicity in crop production, including leguminous crops and grass silage. Climate change issues, including drought in the southern parts of the country, are propelling investments in water-saving irrigation technology.
Farmers are increasingly finding hydroponic systems to guarantee year-round supply, cutting reliance on season. Increased demand for organic and non-GMO fodder is also influencing market forces, with consumers demanding better quality meat and dairy.
South Korea is facing increasing demand due to its expanding livestock industry and enhanced government support for local feed production. Since the nation relies on imported fodder, attempts are being made to increase domestic production by using vertical farming methods and hydroponic farming.
The incorporation of smart farming systems is maximizing yield potential, especially in high-nutrition fodder crops such as Timothy hay and silage maize. Furthermore, increasing consumer awareness of sustainable meat production is encouraging the adoption of green substitutes, lowering the industry's carbon footprint.
Japan is growing at a high rate because of the focus on self-reliance and quality improvement in animal feed. With scarce land resources for planting, Japan has shifted towards technology like controlled-environment agriculture and genetically enhanced crops to achieve maximum yield. Demand for high-quality beef and dairy products is driving the use of nutrient-dense fodder types like high-energy silage mixes.
Government-sponsored research programs are also propelling the industry, targeting climate-resilient feedstocks to mitigate the impact of unpredictable weather patterns. Japan's policies are also shifting to address increasing import needs while increasing in-country supply chains.
China is expanding exponentially as the nation is accelerating its plans to modernize its livestock industry. The government is heavily investing in large-scale forage production centers, incorporating AI-driven yield improvement and precision agriculture.
The growing demand from the middle class for quality meat and dairy products is driving forage consumption at a faster rate, thereby driving R&D spending in climate-resilient and high-nutrition feed types. China's initiative towards self-sufficiency in forage production is also lowering the import dependence, which is driving indigenous supply chains. The growth in dairy cooperatives and feed mills is also driving growth.
Australia's large livestock industry, especially beef and dairy cattle farming, dominates the country. The large grazing lands support bulk cultivation of largely drought-tolerant species such as Rhodes grass and lucerne. Climatic variability weakens yields, necessitating the use of water-efficient irrigation and good crop genetics.
Australia is also an exporter of high-value products with strong Asian trade relations. The integration of digital farming technology improves yield prediction and resource planning, facilitating sustainable development in the industry.
New Zealand is the cornerstone of its world-renowned dairy sector, where pasture-fed feeding systems are essential to milk production. New Zealand's temperate climate favors the growth of high-quality ryegrass and clover pastures, with a constant supply of high-nutrient fodder. However, environmental policy is leading farm practice toward minimizing nitrogen runoff and environmentally sustainable grazing management.
Expenditure on alternative resources like multi-species legume mixtures is on the rise and is aimed at improving animal and soil health. New Zealand's export strategy also makes it the contextually strategic supplier of high-quality fodder to the international market.
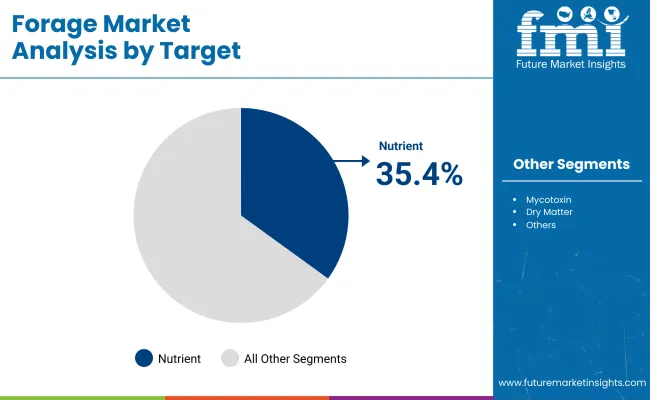
| Segment | Value Share (2025) |
|---|---|
| Nutrient | 35.4% |
The growth is likely to be steady as livestock producers focus on high-quality feed for animal health, milk productivity, and meat production. By 2025, the key targets are segmented in the market: Nutrients and Mycotoxin control. The Nutrients segment will account for a 35.4% market share due to the growing demand for fodder supplemented with the necessary proteins, vitamins, and minerals. In fact, given the significance of optimized nutrition in overall livestock performance, particularly in dairy and beef, fortified feed has become the norm, thanks to leading brands like Cargill and ADM.
Alternatively, with a market share of 33.2%, the Mycotoxin control segment is closely growing on account of increasing feed contamination concerns. Mycotoxins, toxins produced by molds, are a major threat to livestock health, affecting reproduction, digestion, and immunity. In response, livestock owners are investing in toxin-binding additives and advanced preservation methods. Industry experts like Biomin and Alltech have thus developed new mycotoxin mitigation solutions to ensure the feed stays safe and of high quality.
There is also a growing demand for sustainable options, which leads to a rise in the use of eco-friendly feed alternatives and precision farming strategies. The demand for clean, nutrient-rich fodder is growing as global demand for meat and dairy continues to rise, resulting in investments. Rising regulatory scrutiny around feed safety across the globe is also forcing changes to production systems, which are likely to spur further innovations. As research in animal nutrition and biotechnology continues, good growth is expected in the future.
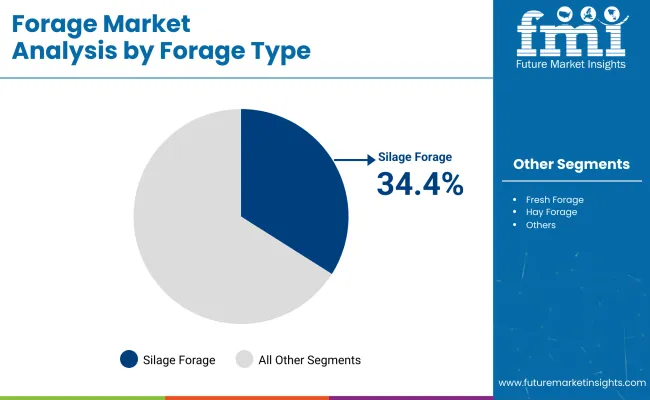
| Segment | Value Share (2025) |
|---|---|
| Silage Forage | 34.4% |
Livestock owners strive for premium feed solutions to ensure optimal animal nutrition and productivity. According to the Estimate for 2025, the based-on type will be dominated by silage (34.4%) and then Ration (34.2%).
Silage and other high-moisture forages have the upper hand over dry fodder simply because ruminants benefit from the fermentation process and improved digestibility, regardless of moisture content. It plays a crucial role in the nutrition of dairy and beef cattle to stabilize their feeds over the years. According to FAO, silage requires 30 percent less feed wastage, referring to dry forages, making silage a more efficient and economical source of feed for livestock, especially for big farms.
Other agricultural giants, such as Corteva Agriscience and Lallemand Animal Nutrition, also produce advanced silage inoculants that enhance fermentation efficiency, reduce spoilage, and increase nutrient retention.
The graphs show that ration-based forage, which is a mix of dehydrated fodder, grains, and protein sources, is the most common and provides a balanced ration. Ration-based feeds have seen a rise in popularity since these can be adjusted based on individual dietary requirements and currently represent 34.2% market share.
Further, ration formulations are being innovated through new precision feeding technologies that can help gradually improve milk yield and meat quality - that which companies like Trouw Nutrition, a part of the Nutreco group of companies, and Purina Animal Nutrition produce.
Sustainability and feed efficiency are key motives, so newly creative conservation methods and precision feeding solutions paired with mycotoxin control will push the market toward new heights. Your ability to eat management based on data will also play an increasingly important role in shaping the new model for derived livestock.
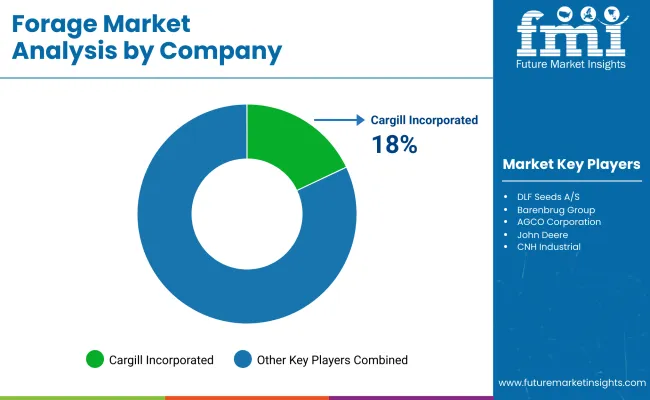
There is a high degree of competition, with active players involved in advanced product innovation, increasing production capacities, and strengthening their supply chains to meet the demand for high-quality animal feeds. Companies that are engaged ensure nutrient-rich solutions to meet the changing needs of the livestock, dairy, and poultry industries. Among key players, Cargill, Incorporated ranks prominently due to a large portfolio of products and continuous investments in research as well as development (R&D) for better solutions.
It also has competitive advantages due to its expertise in animal nutrition and global distribution network. Forage Genetics International is a subsidiary of Land O'Lakes that breeds high-yielding alfalfa and fodder seeds to offer customized solutions to enhance the resilience of crops against livestock productivity. The company's biotechnology and seed innovation pursuits improve its reliability across North America, Europe, and Asia-Pacific.
Barenbrug Group, one of the global leaders in grass and forage seed development, is utilizing advanced breeding programs to develop drought-resistant and high-yield varieties. In more than 20 countries, this company supports improvement in quality related to the ever-growing demand for livestock feed efficiency.
On a parallel track, Dairyland Seed Co. is developing high-performance hybrids with a keen interest in digestibility and animal health effects. This peculiar way allows for the company to respond to the needs of modern livestock operations nimbly. Another contender with some weight is Allied Seed, LLC, which offers a full range of legumes and grasses. Its ability to vertically integrate its operations guarantees the company quality and supply consistency, especially within North America.
Market Share Analysis by Company
| Company Name | Estimated Market Share (%) |
|---|---|
| Cargill, Incorporated | 18-22% |
| Forage Genetics International (Land O'Lakes) | 15-19% |
| DLF Seeds A/S | 12-16% |
| Barenbrug Group | 10-14% |
| AGCO Corporation | 8-12% |
| Other Companies (Combined) | 30-40% |
| Company Name | Key Offerings/Activities |
|---|---|
| Cargill, Incorporated | Develops nutrient-optimized blends for livestock health, with a focus on sustainability and precision feeding. |
| Forage Genetics International | Specializes in biotech-driven high-yield alfalfa and forage seeds, improving crop resilience and animal productivity. |
| DLF Seeds A/S | Offers advanced grass seed genetics for improved drought tolerance and feed quality, supporting livestock efficiency. |
| Barenbrug Group | Leverages cutting-edge breeding programs to develop high-yield, climate-adapted varieties. |
| AGCO Corporation | Provides mechanized solutions, including hay and silage equipment for optimized harvesting and storage. |
Key Company Insights
Cargill, Incorporated (18-22%)
Cargill dominates the animal nutrition industry, focusing on high-energy fodder solutions and sustainable feed production. The company integrates precision feeding programs to optimize livestock growth and dairy output.
Forage Genetics International (15-19%)
A leading innovator in alfalfa and forage seed biotechnology, Forage Genetics International utilizes advanced genetic research to develop high-yield, disease-resistant crops that improve milk production and animal performance.
DLF Seeds A/S (12-16%)
DLF Seeds leads in forage seed innovation, offering climate-resilient grasses and legumes that enhance livestock feed efficiency. The company’s research in grass breeding and digestibility improvements supports sustainable livestock farming.
Barenbrug Group (10-14%)
Barenbrug specializes in high-yield seed development, focusing on drought-resistant varieties that help livestock farmers adapt to changing climatic conditions while maintaining optimal nutritional value.
AGCO Corporation (8-12%)
AGCO provides comprehensive mechanization solutions, including precision hay and silage processing equipment, ensuring maximum nutrient preservation in livestock feed.
Other Key Players (30-40% Combined)
The segmentation is into cereals, legumes, grains, and other foods.
The segmentation includes Nutrients, Mycotoxins, Dry Matter, and Other Targets.
The segmentation is into Fresh, Ration, Hay Forage, and Others.
The segmentation is into cattle, equine, sheep, poultry, and other types of animals.
The industry analysis covers North America, Latin America, Western Europe, Eastern Europe, East Asia, South Asia and the Pacific, Central Asia, Russia and Belarus, Balkan and Baltic Countries, and the Middle East and Africa.
The industry is expected to reach USD 900.4 million in 2025.
The market is projected to grow to USD 1,530.8 million by 2035.
The market is expected to grow at a CAGR of 5.4% from 2025 to 2035.
Japan is expected to grow at the fastest rate, with a CAGR of 7.2% during the forecast period.
The Silage Forage segment is among the most widely used in the market.
Leading companies include Cargill, Incorporated; Forage Genetics International (Land O'Lakes, Inc.); DLF Seeds A/S; Barenbrug Group; AGCO Corporation; John Deere; CNH Industrial; Krone Group; Standlee Premium Products, LLC; Anderson Hay & Grain Co., Inc.; and others.


Our Research Products

The "Full Research Suite" delivers actionable market intel, deep dives on markets or technologies, so clients act faster, cut risk, and unlock growth.

The Leaderboard benchmarks and ranks top vendors, classifying them as Established Leaders, Leading Challengers, or Disruptors & Challengers.

Locates where complements amplify value and substitutes erode it, forecasting net impact by horizon

We deliver granular, decision-grade intel: market sizing, 5-year forecasts, pricing, adoption, usage, revenue, and operational KPIs—plus competitor tracking, regulation, and value chains—across 60 countries broadly.

Spot the shifts before they hit your P&L. We track inflection points, adoption curves, pricing moves, and ecosystem plays to show where demand is heading, why it is changing, and what to do next across high-growth markets and disruptive tech

Real-time reads of user behavior. We track shifting priorities, perceptions of today’s and next-gen services, and provider experience, then pace how fast tech moves from trial to adoption, blending buyer, consumer, and channel inputs with social signals (#WhySwitch, #UX).

Partner with our analyst team to build a custom report designed around your business priorities. From analysing market trends to assessing competitors or crafting bespoke datasets, we tailor insights to your needs.
Supplier Intelligence
Discovery & Profiling
Capacity & Footprint
Performance & Risk
Compliance & Governance
Commercial Readiness
Who Supplies Whom
Scorecards & Shortlists
Playbooks & Docs
Category Intelligence
Definition & Scope
Demand & Use Cases
Cost Drivers
Market Structure
Supply Chain Map
Trade & Policy
Operating Norms
Deliverables
Buyer Intelligence
Account Basics
Spend & Scope
Procurement Model
Vendor Requirements
Terms & Policies
Entry Strategy
Pain Points & Triggers
Outputs
Pricing Analysis
Benchmarks
Trends
Should-Cost
Indexation
Landed Cost
Commercial Terms
Deliverables
Brand Analysis
Positioning & Value Prop
Share & Presence
Customer Evidence
Go-to-Market
Digital & Reputation
Compliance & Trust
KPIs & Gaps
Outputs
Full Research Suite comprises of:
Market outlook & trends analysis
Interviews & case studies
Strategic recommendations
Vendor profiles & capabilities analysis
5-year forecasts
8 regions and 60+ country-level data splits
Market segment data splits
12 months of continuous data updates
DELIVERED AS:
PDF EXCEL ONLINE
Global Forage Seeds Market Size, Growth, and Forecast for 2025 to 2035
Forage Inoculants Market
Haying and Forage Equipment Market Size and Share Forecast Outlook 2025 to 2035

Thank you!
You will receive an email from our Business Development Manager. Please be sure to check your SPAM/JUNK folder too.
Chat With
MaRIA