Biopolymers Market Size and Share Forecast Outlook 2025 to 2035

The Biopolymers Market is estimated to be valued at USD 13.4 billion in 2025 and is projected to reach USD 38.2 billion by 2035, registering a compound annual growth rate (CAGR) of 11.0% over the forecast period.
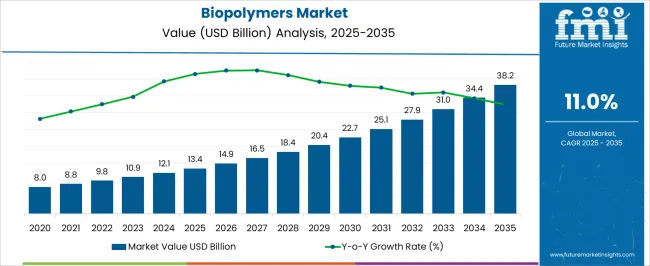
Quick Stats for Biopolymers Market

  • Biopolymers Market Value (2025): USD 13.4 billion
  • Biopolymers Market Forecast Value (2035): USD 38.2 billion
  • Biopolymers Market Forecast CAGR: 11.0%
  • Leading Segment in Biopolymers Market in 2025: Bio-PE (32.2%)
  • Key Growth Regions in Biopolymers Market: North America, Asia-Pacific, Europe
  • Top Key Players in Biopolymers Market: BASF SE, Braskem S.A., Arkema, Meredian Holdings Group Inc., NatureWorks LLC, Corbion NV, Metabolix, Inc., Danimer Scientific, Biopolymer International, Solanyl Biopolymers, HARBEC, Inc., Metabolix Inc., Novamont S.p.A.

Biopolymers Market Market Value Analysis

Biopolymers Market Key Takeaways

Metric Value
Biopolymers Market Estimated Value in (2025 E) USD 13.4 billion
Biopolymers Market Forecast Value in (2035 F) USD 38.2 billion
Forecast CAGR (2025 to 2035) 11.0%

Why is the Biopolymers Market Growing?

The Biopolymers market is experiencing strong growth, driven by increasing environmental awareness, regulatory pressure to reduce plastic waste, and the global push for sustainable materials. Adoption is being supported by technological advancements in polymer synthesis, biodegradability, and performance properties that enable substitution of conventional plastics in diverse applications. Demand is further reinforced by consumer preference for eco-friendly products and corporate sustainability initiatives across industries.

The market is shaped by the integration of biopolymers into packaging, automotive components, consumer goods, and healthcare products, where performance and environmental compliance are both critical. Cost reductions achieved through process optimization and scaling of production capacities are increasing commercial viability. Additionally, partnerships between biopolymer manufacturers and end-use industries are accelerating product development tailored to specific application requirements.

With rising investments in research and development, regulatory incentives, and growing adoption of circular economy principles, the Biopolymers market is poised for sustained expansion Continuous innovation in material performance, process efficiency, and eco-design is expected to create new growth opportunities over the coming decade.

Segmental Analysis

The biopolymers market is segmented by product type, application, end-use industry, and geographic regions. By product type, biopolymers market is divided into Bio-PE, Bio-PET, Poly Lactic Acid (PLA), Polyhydroxyalkanoate (PHA), Biodegradable Polyesters, and Others (Biodegradable Starch Blends, Biodegradable Polyesters etc.). In terms of application, biopolymers market is classified into Packaging, Bottles, Fibers, Agriculture Seed Coatings, Automotive Interior Parts, and Others (Medical Implants). Based on end-use industry, biopolymers market is segmented into Automotive, Food & Beverage, Bio-Medical, Agriculture, Electrical & Electronics, Aerospace, and Others. Regionally, the biopolymers industry is classified into North America, Latin America, Western Europe, Eastern Europe, Balkan & Baltic Countries, Russia & Belarus, Central Asia, East Asia, South Asia & Pacific, and the Middle East & Africa.
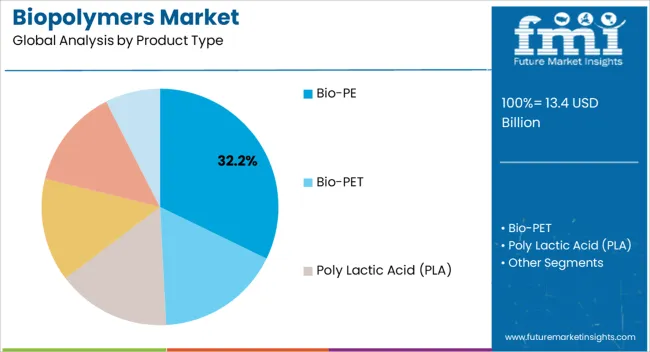
Insights into the Bio-PE Product Type Segment

Biopolymers Market Analysis By Product Type

The bio-PE product type segment is projected to hold 32.2% of the Biopolymers market revenue in 2025, making it the leading product type. Growth in this segment is being driven by its chemical and physical similarity to conventional polyethylene, which enables easy integration into existing manufacturing processes without extensive equipment modification. Bio-PE offers benefits such as renewability, lower carbon footprint, and compatibility with recycling systems, which support adoption across multiple applications.

Increasing demand from packaging, consumer goods, and automotive sectors has reinforced its market position. Technological advancements in feedstock utilization and polymerization processes have improved performance consistency and reduced production costs, making it a commercially attractive option.

The scalability of bio-PE production, combined with regulatory support for renewable and low-emission materials, is further contributing to growth As industries continue to adopt sustainable materials to meet environmental targets and consumer expectations, bio-PE is expected to maintain its leadership in the market, supported by ongoing innovations in material performance and process efficiency.
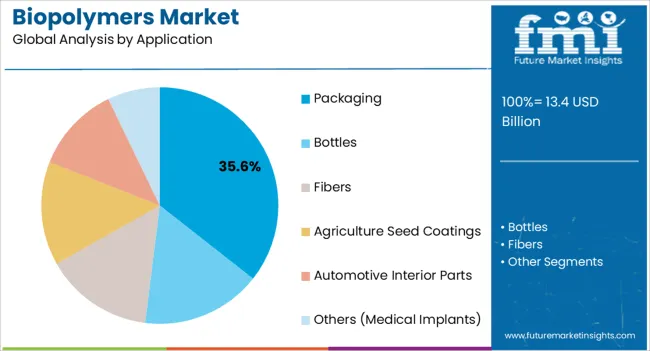
Insights into the Packaging Application Segment

Biopolymers Market Analysis By Application

The packaging application segment is anticipated to account for 35.6% of the market revenue in 2025, establishing it as the leading application area. Growth in this segment is being driven by the increasing global emphasis on sustainable and eco-friendly packaging solutions to reduce plastic waste and comply with environmental regulations. Biopolymers are being adopted for flexible films, rigid containers, and biodegradable packaging products that meet functional and environmental requirements.

Integration of bio-based materials into supply chains enables manufacturers to meet corporate sustainability goals while addressing consumer demand for environmentally responsible packaging. Technological advancements in biopolymer processing, barrier properties, and mechanical strength have enhanced suitability for packaging applications.

The ability to customize biopolymer formulations to achieve desired properties without compromising biodegradability or recyclability is reinforcing adoption As regulatory pressure intensifies and corporate responsibility initiatives grow, packaging is expected to remain the primary application driving Biopolymers market growth, supported by continuous innovation in material performance and cost-effective production.
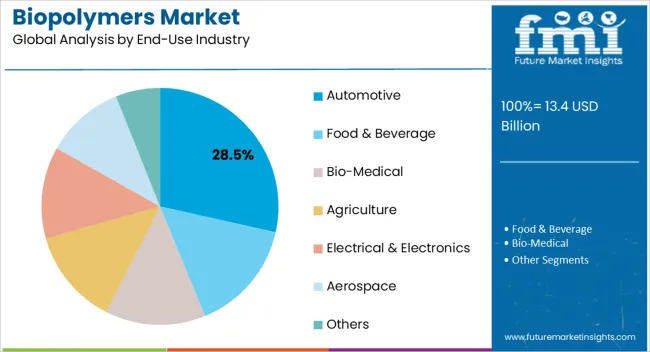
Insights into the Automotive End-Use Industry Segment

Biopolymers Market Analysis By End Use Industry

The automotive end-use industry segment is projected to hold 28.5% of the Biopolymers market revenue in 2025, positioning it as the leading end-use industry. Growth is being driven by the increasing adoption of lightweight, renewable, and recyclable materials to improve fuel efficiency, reduce emissions, and meet environmental regulations. Biopolymers are being leveraged for interior components, panels, and under-the-hood applications where durability, performance, and sustainability are essential.

Integration of biopolymers supports automakers in achieving carbon reduction targets and enhances brand positioning through eco-friendly initiatives. Technological innovations in thermal stability, mechanical performance, and process compatibility have enabled broader adoption in automotive manufacturing.

Collaborations between biopolymer producers and automotive OEMs have facilitated the development of application-specific materials, reducing implementation barriers As the automotive sector increasingly prioritizes sustainability and regulatory compliance, biopolymers are expected to maintain their leadership, supported by continued investment in R&D, performance optimization, and cost-effective production methods that meet industry standards.

Market Overview

Market Snapshot

According to the latest market survey conducted by Future Market Insights, the global Biopolymers market is relishing a market valuation of US$ 12.09 Bn in 2025 and is all set to expand with a CAGR of 11.03% during the 2025 – 2035 period. The market is anticipated to top a valuation of US$ 34.42 Bn by the end of the forecast period.

Market Size 2025 US$ 12.09 Bn
Market Size 2035 US$ 34.42 Bn
Value CAGR (2025-2035) 11.03%
Collective Value Share: Top 3 Countries (2025E) 45% – 55%

Biopolymers are synthetic materials made from plant-based sources such as sugar cane, corn, and other agricultural products as well as residual wood and standing lumber. Unlike conventional polymers or plastics, which contribute to a number of environmental problems like pollution and global warming, biopolymers are naturally biodegradable, making them useful in a variety of applications, including, emulsions, edible films, packaging materials in the food industry, as well as drug transport materials, dressing materials, and medical implants in pharmaceutical industries.

The manufacturing of polymers from renewable resources is expected to be one of the fastest-growing material industries during the past several years. These polymers have the potential to displace polymers derived from fossil fuels, which is what is driving their research. The primary causes of this drive can be summed up as follows: insufficient fossil fuel resources; unstable fossil fuel prices; the role of fossil fuel as a feedstock in climate change; its sporadic use as a political weapon; and its connection to the waste disposal issue brought on by polymers made from fossil fuels.
Analysis of Biopolymers Market By Key Countries

Biopolymers Market Cagr Analysis By Country

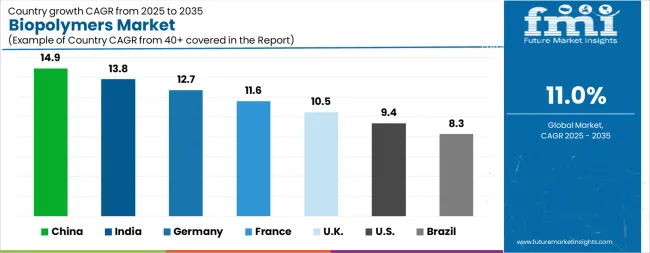
Country CAGR
China 14.9%
India 13.8%
Germany 12.7%
France 11.6%
UK 10.5%
USA 9.4%
Brazil 8.3%

Country-wise Analysis

The Biopolymers Market is expected to register a CAGR of 11.0% during the forecast period, exhibiting varied country level momentum. China leads with the highest CAGR of 14.9%, followed by India at 13.8%. Developed markets such as Germany, France, and the UK continue to expand steadily, while the USA is likely to grow at consistent rates. Brazil posts the lowest CAGR at 8.3%, yet still underscores a broadly positive trajectory for the global Biopolymers Market. In 2024, Germany held a dominant revenue in the Western Europe market and is expected to grow with a CAGR of 12.7%. The USA Biopolymers Market is estimated to be valued at USD 4.6 billion in 2025 and is anticipated to reach a valuation of USD 11.2 billion by 2035. Sales are projected to rise at a CAGR of 9.4% over the forecast period between 2025 and 2035. While Japan and South Korea markets are estimated to be valued at USD 696.0 million and USD 406.3 million respectively in 2025.
Key Players in the Biopolymers Market

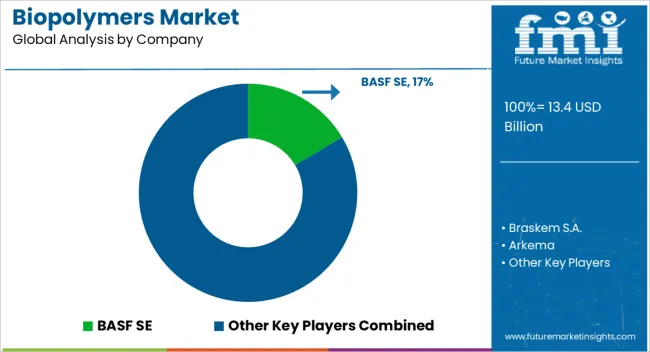
Biopolymers Market Analysis By Company

  • BASF SE
  • Braskem S.A.
  • Arkema
  • Meredian Holdings Group Inc.
  • NatureWorks LLC
  • Corbion NV
  • Metabolix, Inc.
  • Danimer Scientific
  • Biopolymer International
  • Solanyl Biopolymers
  • HARBEC, Inc.
  • Metabolix Inc.
  • Novamont S.p.A.

Scope of the Report

Item Value
Quantitative Units USD 13.4 Billion
Product Type Bio-PE, Bio-PET, Poly Lactic Acid (PLA), Polyhydroxyalkanoate (PHA), Biodegradable Polyesters, and Others (Biodegradable Starch Blends, Biodegradable Polyesters etc.)
Application Packaging, Bottles, Fibers, Agriculture Seed Coatings, Automotive Interior Parts, and Others (Medical Implants)
End-Use Industry Automotive, Food & Beverage, Bio-Medical, Agriculture, Electrical & Electronics, Aerospace, and Others
Regions Covered North America, Europe, Asia-Pacific, Latin America, Middle East & Africa
Country Covered United States, Canada, Germany, France, United Kingdom, China, Japan, India, Brazil, South Africa
Key Companies Profiled BASF SE, Braskem S.A., Arkema, Meredian Holdings Group Inc., NatureWorks LLC, Corbion NV, Metabolix, Inc., Danimer Scientific, Biopolymer International, Solanyl Biopolymers, HARBEC, Inc., Metabolix Inc., and Novamont S.p.A.

Biopolymers Market by Segments

Product Type:

  • Bio-PE
  • Bio-PET
  • Poly Lactic Acid (PLA)
  • Polyhydroxyalkanoate (PHA)
  • Biodegradable Polyesters
  • Others (Biodegradable Starch Blends, Biodegradable Polyesters etc.)

Application:

  • Packaging
  • Bottles
  • Fibers
  • Agriculture Seed Coatings
  • Automotive Interior Parts
  • Others (Medical Implants)

End-Use Industry:

  • Automotive
  • Food & Beverage
  • Bio-Medical
  • Agriculture
  • Electrical & Electronics
  • Aerospace
  • Others

Region:

  • North America
    • USA
    • Canada
    • Mexico
  • Latin America
    • Brazil
    • Chile
    • Rest of Latin America
  • Western Europe
    • Germany
    • UK
    • Italy
    • Spain
    • France
    • Nordic
    • BENELUX
    • Rest of Western Europe
  • Eastern Europe
    • Russia
    • Poland
    • Hungary
    • Balkan & Baltic
    • Rest of Eastern Europe
  • East Asia
    • China
    • Japan
    • South Korea
  • South Asia and Pacific
    • India
    • ASEAN
    • Australia & New Zealand
    • Rest of South Asia and Pacific
  • Middle East & Africa
    • Kingdom of Saudi Arabia
    • Other GCC Countries
    • Turkiye
    • South Africa
    • Other African Union
    • Rest of Middle East & Africa

Table of Content

  1. Executive Summary
    • Global Market Outlook
    • Demand-side Trends
    • Supply-side Trends
    • Technology Roadmap Analysis
    • Analysis and Recommendations
  2. Market Overview
    • Market Coverage / Taxonomy
    • Market Definition / Scope / Limitations
  3. Market Background
    • Market Dynamics
      • Drivers
      • Restraints
      • Opportunity
      • Trends
    • Scenario Forecast
      • Demand in Optimistic Scenario
      • Demand in Likely Scenario
      • Demand in Conservative Scenario
    • Opportunity Map Analysis
    • Product Life Cycle Analysis
    • Supply Chain Analysis
    • Investment Feasibility Matrix
    • Value Chain Analysis
    • PESTLE and Porter’s Analysis
    • Regulatory Landscape
    • Regional Parent Market Outlook
    • Production and Consumption Statistics
    • Import and Export Statistics
  4. Global Market Analysis 2020 to 2024 and Forecast, 2025 to 2035
    • Historical Market Size Value (USD Million) Analysis, 2020 to 2024
    • Current and Future Market Size Value (USD Million) Projections, 2025 to 2035
      • Y-o-Y Growth Trend Analysis
      • Absolute $ Opportunity Analysis
  5. Global Market Pricing Analysis 2020 to 2024 and Forecast 2025 to 2035
  6. Global Market Analysis 2020 to 2024 and Forecast 2025 to 2035, By Product Type
    • Introduction / Key Findings
    • Historical Market Size Value (USD Million) Analysis By Product Type , 2020 to 2024
    • Current and Future Market Size Value (USD Million) Analysis and Forecast By Product Type , 2025 to 2035
      • Bio-PE
      • Bio-PET
      • Poly Lactic Acid (PLA)
      • Polyhydroxyalkanoate (PHA)
      • Biodegradable Polyesters
      • Others (Biodegradable Starch Blends, Biodegradable Polyesters etc.)
    • Y-o-Y Growth Trend Analysis By Product Type , 2020 to 2024
    • Absolute $ Opportunity Analysis By Product Type , 2025 to 2035
  7. Global Market Analysis 2020 to 2024 and Forecast 2025 to 2035, By Application
    • Introduction / Key Findings
    • Historical Market Size Value (USD Million) Analysis By Application, 2020 to 2024
    • Current and Future Market Size Value (USD Million) Analysis and Forecast By Application, 2025 to 2035
      • Packaging
      • Bottles
      • Fibers
      • Agriculture Seed Coatings
      • Automotive Interior Parts
      • Others (Medical Implants)
    • Y-o-Y Growth Trend Analysis By Application, 2020 to 2024
    • Absolute $ Opportunity Analysis By Application, 2025 to 2035
  8. Global Market Analysis 2020 to 2024 and Forecast 2025 to 2035, By End-Use Industry
    • Introduction / Key Findings
    • Historical Market Size Value (USD Million) Analysis By End-Use Industry, 2020 to 2024
    • Current and Future Market Size Value (USD Million) Analysis and Forecast By End-Use Industry, 2025 to 2035
      • Automotive
      • Food & Beverage
      • Bio-Medical
      • Agriculture
      • Electrical & Electronics
      • Aerospace
      • Others
    • Y-o-Y Growth Trend Analysis By End-Use Industry, 2020 to 2024
    • Absolute $ Opportunity Analysis By End-Use Industry, 2025 to 2035
  9. Global Market Analysis 2020 to 2024 and Forecast 2025 to 2035, By Region
    • Introduction
    • Historical Market Size Value (USD Million) Analysis By Region, 2020 to 2024
    • Current Market Size Value (USD Million) Analysis and Forecast By Region, 2025 to 2035
      • North America
      • Latin America
      • Western Europe
      • Eastern Europe
      • East Asia
      • South Asia and Pacific
      • Middle East & Africa
    • Market Attractiveness Analysis By Region
  10. North America Market Analysis 2020 to 2024 and Forecast 2025 to 2035, By Country
    • Historical Market Size Value (USD Million) Trend Analysis By Market Taxonomy, 2020 to 2024
    • Market Size Value (USD Million) Forecast By Market Taxonomy, 2025 to 2035
      • By Country
        • USA
        • Canada
        • Mexico
      • By Product Type
      • By Application
      • By End-Use Industry
    • Market Attractiveness Analysis
      • By Country
      • By Product Type
      • By Application
      • By End-Use Industry
    • Key Takeaways
  11. Latin America Market Analysis 2020 to 2024 and Forecast 2025 to 2035, By Country
    • Historical Market Size Value (USD Million) Trend Analysis By Market Taxonomy, 2020 to 2024
    • Market Size Value (USD Million) Forecast By Market Taxonomy, 2025 to 2035
      • By Country
        • Brazil
        • Chile
        • Rest of Latin America
      • By Product Type
      • By Application
      • By End-Use Industry
    • Market Attractiveness Analysis
      • By Country
      • By Product Type
      • By Application
      • By End-Use Industry
    • Key Takeaways
  12. Western Europe Market Analysis 2020 to 2024 and Forecast 2025 to 2035, By Country
    • Historical Market Size Value (USD Million) Trend Analysis By Market Taxonomy, 2020 to 2024
    • Market Size Value (USD Million) Forecast By Market Taxonomy, 2025 to 2035
      • By Country
        • Germany
        • UK
        • Italy
        • Spain
        • France
        • Nordic
        • BENELUX
        • Rest of Western Europe
      • By Product Type
      • By Application
      • By End-Use Industry
    • Market Attractiveness Analysis
      • By Country
      • By Product Type
      • By Application
      • By End-Use Industry
    • Key Takeaways
  13. Eastern Europe Market Analysis 2020 to 2024 and Forecast 2025 to 2035, By Country
    • Historical Market Size Value (USD Million) Trend Analysis By Market Taxonomy, 2020 to 2024
    • Market Size Value (USD Million) Forecast By Market Taxonomy, 2025 to 2035
      • By Country
        • Russia
        • Poland
        • Hungary
        • Balkan & Baltic
        • Rest of Eastern Europe
      • By Product Type
      • By Application
      • By End-Use Industry
    • Market Attractiveness Analysis
      • By Country
      • By Product Type
      • By Application
      • By End-Use Industry
    • Key Takeaways
  14. East Asia Market Analysis 2020 to 2024 and Forecast 2025 to 2035, By Country
    • Historical Market Size Value (USD Million) Trend Analysis By Market Taxonomy, 2020 to 2024
    • Market Size Value (USD Million) Forecast By Market Taxonomy, 2025 to 2035
      • By Country
        • China
        • Japan
        • South Korea
      • By Product Type
      • By Application
      • By End-Use Industry
    • Market Attractiveness Analysis
      • By Country
      • By Product Type
      • By Application
      • By End-Use Industry
    • Key Takeaways
  15. South Asia and Pacific Market Analysis 2020 to 2024 and Forecast 2025 to 2035, By Country
    • Historical Market Size Value (USD Million) Trend Analysis By Market Taxonomy, 2020 to 2024
    • Market Size Value (USD Million) Forecast By Market Taxonomy, 2025 to 2035
      • By Country
        • India
        • ASEAN
        • Australia & New Zealand
        • Rest of South Asia and Pacific
      • By Product Type
      • By Application
      • By End-Use Industry
    • Market Attractiveness Analysis
      • By Country
      • By Product Type
      • By Application
      • By End-Use Industry
    • Key Takeaways
  16. Middle East & Africa Market Analysis 2020 to 2024 and Forecast 2025 to 2035, By Country
    • Historical Market Size Value (USD Million) Trend Analysis By Market Taxonomy, 2020 to 2024
    • Market Size Value (USD Million) Forecast By Market Taxonomy, 2025 to 2035
      • By Country
        • Kingdom of Saudi Arabia
        • Other GCC Countries
        • Turkiye
        • South Africa
        • Other African Union
        • Rest of Middle East & Africa
      • By Product Type
      • By Application
      • By End-Use Industry
    • Market Attractiveness Analysis
      • By Country
      • By Product Type
      • By Application
      • By End-Use Industry
    • Key Takeaways
  17. Key Countries Market Analysis
    • USA
      • Pricing Analysis
      • Market Share Analysis, 2024
        • By Product Type
        • By Application
        • By End-Use Industry
    • Canada
      • Pricing Analysis
      • Market Share Analysis, 2024
        • By Product Type
        • By Application
        • By End-Use Industry
    • Mexico
      • Pricing Analysis
      • Market Share Analysis, 2024
        • By Product Type
        • By Application
        • By End-Use Industry
    • Brazil
      • Pricing Analysis
      • Market Share Analysis, 2024
        • By Product Type
        • By Application
        • By End-Use Industry
    • Chile
      • Pricing Analysis
      • Market Share Analysis, 2024
        • By Product Type
        • By Application
        • By End-Use Industry
    • Germany
      • Pricing Analysis
      • Market Share Analysis, 2024
        • By Product Type
        • By Application
        • By End-Use Industry
    • UK
      • Pricing Analysis
      • Market Share Analysis, 2024
        • By Product Type
        • By Application
        • By End-Use Industry
    • Italy
      • Pricing Analysis
      • Market Share Analysis, 2024
        • By Product Type
        • By Application
        • By End-Use Industry
    • Spain
      • Pricing Analysis
      • Market Share Analysis, 2024
        • By Product Type
        • By Application
        • By End-Use Industry
    • France
      • Pricing Analysis
      • Market Share Analysis, 2024
        • By Product Type
        • By Application
        • By End-Use Industry
    • India
      • Pricing Analysis
      • Market Share Analysis, 2024
        • By Product Type
        • By Application
        • By End-Use Industry
    • ASEAN
      • Pricing Analysis
      • Market Share Analysis, 2024
        • By Product Type
        • By Application
        • By End-Use Industry
    • Australia & New Zealand
      • Pricing Analysis
      • Market Share Analysis, 2024
        • By Product Type
        • By Application
        • By End-Use Industry
    • China
      • Pricing Analysis
      • Market Share Analysis, 2024
        • By Product Type
        • By Application
        • By End-Use Industry
    • Japan
      • Pricing Analysis
      • Market Share Analysis, 2024
        • By Product Type
        • By Application
        • By End-Use Industry
    • South Korea
      • Pricing Analysis
      • Market Share Analysis, 2024
        • By Product Type
        • By Application
        • By End-Use Industry
    • Russia
      • Pricing Analysis
      • Market Share Analysis, 2024
        • By Product Type
        • By Application
        • By End-Use Industry
    • Poland
      • Pricing Analysis
      • Market Share Analysis, 2024
        • By Product Type
        • By Application
        • By End-Use Industry
    • Hungary
      • Pricing Analysis
      • Market Share Analysis, 2024
        • By Product Type
        • By Application
        • By End-Use Industry
    • Kingdom of Saudi Arabia
      • Pricing Analysis
      • Market Share Analysis, 2024
        • By Product Type
        • By Application
        • By End-Use Industry
    • Turkiye
      • Pricing Analysis
      • Market Share Analysis, 2024
        • By Product Type
        • By Application
        • By End-Use Industry
    • South Africa
      • Pricing Analysis
      • Market Share Analysis, 2024
        • By Product Type
        • By Application
        • By End-Use Industry
  18. Market Structure Analysis
    • Competition Dashboard
    • Competition Benchmarking
    • Market Share Analysis of Top Players
      • By Regional
      • By Product Type
      • By Application
      • By End-Use Industry
  19. Competition Analysis
    • Competition Deep Dive
      • BASF SE
        • Overview
        • Product Portfolio
        • Profitability by Market Segments (Product/Age /Sales Channel/Region)
        • Sales Footprint
        • Strategy Overview
          • Marketing Strategy
          • Product Strategy
          • Channel Strategy
      • Braskem S.A.
      • Arkema
      • Meredian Holdings Group Inc.
      • NatureWorks LLC
      • Corbion NV
      • Metabolix, Inc.
      • Danimer Scientific
      • Biopolymer International
      • Solanyl Biopolymers
      • HARBEC, Inc.
      • Metabolix Inc.
      • Novamont S.p.A.
  20. Assumptions & Acronyms Used
  21. Research Methodology

List of Tables

  • Table 1: Global Market Value (USD Million) Forecast by Region, 2020 to 2035
  • Table 2: Global Market Value (USD Million) Forecast by Product Type , 2020 to 2035
  • Table 3: Global Market Value (USD Million) Forecast by Application, 2020 to 2035
  • Table 4: Global Market Value (USD Million) Forecast by End-Use Industry, 2020 to 2035
  • Table 5: North America Market Value (USD Million) Forecast by Country, 2020 to 2035
  • Table 6: North America Market Value (USD Million) Forecast by Product Type , 2020 to 2035
  • Table 7: North America Market Value (USD Million) Forecast by Application, 2020 to 2035
  • Table 8: North America Market Value (USD Million) Forecast by End-Use Industry, 2020 to 2035
  • Table 9: Latin America Market Value (USD Million) Forecast by Country, 2020 to 2035
  • Table 10: Latin America Market Value (USD Million) Forecast by Product Type , 2020 to 2035
  • Table 11: Latin America Market Value (USD Million) Forecast by Application, 2020 to 2035
  • Table 12: Latin America Market Value (USD Million) Forecast by End-Use Industry, 2020 to 2035
  • Table 13: Western Europe Market Value (USD Million) Forecast by Country, 2020 to 2035
  • Table 14: Western Europe Market Value (USD Million) Forecast by Product Type , 2020 to 2035
  • Table 15: Western Europe Market Value (USD Million) Forecast by Application, 2020 to 2035
  • Table 16: Western Europe Market Value (USD Million) Forecast by End-Use Industry, 2020 to 2035
  • Table 17: Eastern Europe Market Value (USD Million) Forecast by Country, 2020 to 2035
  • Table 18: Eastern Europe Market Value (USD Million) Forecast by Product Type , 2020 to 2035
  • Table 19: Eastern Europe Market Value (USD Million) Forecast by Application, 2020 to 2035
  • Table 20: Eastern Europe Market Value (USD Million) Forecast by End-Use Industry, 2020 to 2035
  • Table 21: East Asia Market Value (USD Million) Forecast by Country, 2020 to 2035
  • Table 22: East Asia Market Value (USD Million) Forecast by Product Type , 2020 to 2035
  • Table 23: East Asia Market Value (USD Million) Forecast by Application, 2020 to 2035
  • Table 24: East Asia Market Value (USD Million) Forecast by End-Use Industry, 2020 to 2035
  • Table 25: South Asia and Pacific Market Value (USD Million) Forecast by Country, 2020 to 2035
  • Table 26: South Asia and Pacific Market Value (USD Million) Forecast by Product Type , 2020 to 2035
  • Table 27: South Asia and Pacific Market Value (USD Million) Forecast by Application, 2020 to 2035
  • Table 28: South Asia and Pacific Market Value (USD Million) Forecast by End-Use Industry, 2020 to 2035
  • Table 29: Middle East & Africa Market Value (USD Million) Forecast by Country, 2020 to 2035
  • Table 30: Middle East & Africa Market Value (USD Million) Forecast by Product Type , 2020 to 2035
  • Table 31: Middle East & Africa Market Value (USD Million) Forecast by Application, 2020 to 2035
  • Table 32: Middle East & Africa Market Value (USD Million) Forecast by End-Use Industry, 2020 to 2035

List of Figures

  • Figure 1: Global Market Pricing Analysis
  • Figure 2: Global Market Value (USD Million) Forecast 2020 to 2035
  • Figure 3: Global Market Value Share and BPS Analysis by Product Type , 2025 and 2035
  • Figure 4: Global Market Y-o-Y Growth Comparison by Product Type , 2025 to 2035
  • Figure 5: Global Market Attractiveness Analysis by Product Type
  • Figure 6: Global Market Value Share and BPS Analysis by Application, 2025 and 2035
  • Figure 7: Global Market Y-o-Y Growth Comparison by Application, 2025 to 2035
  • Figure 8: Global Market Attractiveness Analysis by Application
  • Figure 9: Global Market Value Share and BPS Analysis by End-Use Industry, 2025 and 2035
  • Figure 10: Global Market Y-o-Y Growth Comparison by End-Use Industry, 2025 to 2035
  • Figure 11: Global Market Attractiveness Analysis by End-Use Industry
  • Figure 12: Global Market Value (USD Million) Share and BPS Analysis by Region, 2025 and 2035
  • Figure 13: Global Market Y-o-Y Growth Comparison by Region, 2025 to 2035
  • Figure 14: Global Market Attractiveness Analysis by Region
  • Figure 15: North America Market Incremental Dollar Opportunity, 2025 to 2035
  • Figure 16: Latin America Market Incremental Dollar Opportunity, 2025 to 2035
  • Figure 17: Western Europe Market Incremental Dollar Opportunity, 2025 to 2035
  • Figure 18: Eastern Europe Market Incremental Dollar Opportunity, 2025 to 2035
  • Figure 19: East Asia Market Incremental Dollar Opportunity, 2025 to 2035
  • Figure 20: South Asia and Pacific Market Incremental Dollar Opportunity, 2025 to 2035
  • Figure 21: Middle East & Africa Market Incremental Dollar Opportunity, 2025 to 2035
  • Figure 22: North America Market Value Share and BPS Analysis by Country, 2025 and 2035
  • Figure 23: North America Market Value Share and BPS Analysis by Product Type , 2025 and 2035
  • Figure 24: North America Market Y-o-Y Growth Comparison by Product Type , 2025 to 2035
  • Figure 25: North America Market Attractiveness Analysis by Product Type
  • Figure 26: North America Market Value Share and BPS Analysis by Application, 2025 and 2035
  • Figure 27: North America Market Y-o-Y Growth Comparison by Application, 2025 to 2035
  • Figure 28: North America Market Attractiveness Analysis by Application
  • Figure 29: North America Market Value Share and BPS Analysis by End-Use Industry, 2025 and 2035
  • Figure 30: North America Market Y-o-Y Growth Comparison by End-Use Industry, 2025 to 2035
  • Figure 31: North America Market Attractiveness Analysis by End-Use Industry
  • Figure 32: Latin America Market Value Share and BPS Analysis by Country, 2025 and 2035
  • Figure 33: Latin America Market Value Share and BPS Analysis by Product Type , 2025 and 2035
  • Figure 34: Latin America Market Y-o-Y Growth Comparison by Product Type , 2025 to 2035
  • Figure 35: Latin America Market Attractiveness Analysis by Product Type
  • Figure 36: Latin America Market Value Share and BPS Analysis by Application, 2025 and 2035
  • Figure 37: Latin America Market Y-o-Y Growth Comparison by Application, 2025 to 2035
  • Figure 38: Latin America Market Attractiveness Analysis by Application
  • Figure 39: Latin America Market Value Share and BPS Analysis by End-Use Industry, 2025 and 2035
  • Figure 40: Latin America Market Y-o-Y Growth Comparison by End-Use Industry, 2025 to 2035
  • Figure 41: Latin America Market Attractiveness Analysis by End-Use Industry
  • Figure 42: Western Europe Market Value Share and BPS Analysis by Country, 2025 and 2035
  • Figure 43: Western Europe Market Value Share and BPS Analysis by Product Type , 2025 and 2035
  • Figure 44: Western Europe Market Y-o-Y Growth Comparison by Product Type , 2025 to 2035
  • Figure 45: Western Europe Market Attractiveness Analysis by Product Type
  • Figure 46: Western Europe Market Value Share and BPS Analysis by Application, 2025 and 2035
  • Figure 47: Western Europe Market Y-o-Y Growth Comparison by Application, 2025 to 2035
  • Figure 48: Western Europe Market Attractiveness Analysis by Application
  • Figure 49: Western Europe Market Value Share and BPS Analysis by End-Use Industry, 2025 and 2035
  • Figure 50: Western Europe Market Y-o-Y Growth Comparison by End-Use Industry, 2025 to 2035
  • Figure 51: Western Europe Market Attractiveness Analysis by End-Use Industry
  • Figure 52: Eastern Europe Market Value Share and BPS Analysis by Country, 2025 and 2035
  • Figure 53: Eastern Europe Market Value Share and BPS Analysis by Product Type , 2025 and 2035
  • Figure 54: Eastern Europe Market Y-o-Y Growth Comparison by Product Type , 2025 to 2035
  • Figure 55: Eastern Europe Market Attractiveness Analysis by Product Type
  • Figure 56: Eastern Europe Market Value Share and BPS Analysis by Application, 2025 and 2035
  • Figure 57: Eastern Europe Market Y-o-Y Growth Comparison by Application, 2025 to 2035
  • Figure 58: Eastern Europe Market Attractiveness Analysis by Application
  • Figure 59: Eastern Europe Market Value Share and BPS Analysis by End-Use Industry, 2025 and 2035
  • Figure 60: Eastern Europe Market Y-o-Y Growth Comparison by End-Use Industry, 2025 to 2035
  • Figure 61: Eastern Europe Market Attractiveness Analysis by End-Use Industry
  • Figure 62: East Asia Market Value Share and BPS Analysis by Country, 2025 and 2035
  • Figure 63: East Asia Market Value Share and BPS Analysis by Product Type , 2025 and 2035
  • Figure 64: East Asia Market Y-o-Y Growth Comparison by Product Type , 2025 to 2035
  • Figure 65: East Asia Market Attractiveness Analysis by Product Type
  • Figure 66: East Asia Market Value Share and BPS Analysis by Application, 2025 and 2035
  • Figure 67: East Asia Market Y-o-Y Growth Comparison by Application, 2025 to 2035
  • Figure 68: East Asia Market Attractiveness Analysis by Application
  • Figure 69: East Asia Market Value Share and BPS Analysis by End-Use Industry, 2025 and 2035
  • Figure 70: East Asia Market Y-o-Y Growth Comparison by End-Use Industry, 2025 to 2035
  • Figure 71: East Asia Market Attractiveness Analysis by End-Use Industry
  • Figure 72: South Asia and Pacific Market Value Share and BPS Analysis by Country, 2025 and 2035
  • Figure 73: South Asia and Pacific Market Value Share and BPS Analysis by Product Type , 2025 and 2035
  • Figure 74: South Asia and Pacific Market Y-o-Y Growth Comparison by Product Type , 2025 to 2035
  • Figure 75: South Asia and Pacific Market Attractiveness Analysis by Product Type
  • Figure 76: South Asia and Pacific Market Value Share and BPS Analysis by Application, 2025 and 2035
  • Figure 77: South Asia and Pacific Market Y-o-Y Growth Comparison by Application, 2025 to 2035
  • Figure 78: South Asia and Pacific Market Attractiveness Analysis by Application
  • Figure 79: South Asia and Pacific Market Value Share and BPS Analysis by End-Use Industry, 2025 and 2035
  • Figure 80: South Asia and Pacific Market Y-o-Y Growth Comparison by End-Use Industry, 2025 to 2035
  • Figure 81: South Asia and Pacific Market Attractiveness Analysis by End-Use Industry
  • Figure 82: Middle East & Africa Market Value Share and BPS Analysis by Country, 2025 and 2035
  • Figure 83: Middle East & Africa Market Value Share and BPS Analysis by Product Type , 2025 and 2035
  • Figure 84: Middle East & Africa Market Y-o-Y Growth Comparison by Product Type , 2025 to 2035
  • Figure 85: Middle East & Africa Market Attractiveness Analysis by Product Type
  • Figure 86: Middle East & Africa Market Value Share and BPS Analysis by Application, 2025 and 2035
  • Figure 87: Middle East & Africa Market Y-o-Y Growth Comparison by Application, 2025 to 2035
  • Figure 88: Middle East & Africa Market Attractiveness Analysis by Application
  • Figure 89: Middle East & Africa Market Value Share and BPS Analysis by End-Use Industry, 2025 and 2035
  • Figure 90: Middle East & Africa Market Y-o-Y Growth Comparison by End-Use Industry, 2025 to 2035
  • Figure 91: Middle East & Africa Market Attractiveness Analysis by End-Use Industry
  • Figure 92: Global Market – Tier Structure Analysis
  • Figure 93: Global Market – Company Share Analysis

Frequently Asked Questions

How big is the biopolymers market in 2025?

The global biopolymers market is estimated to be valued at USD 13.4 billion in 2025.

What will be the size of biopolymers market in 2035?

The market size for the biopolymers market is projected to reach USD 38.2 billion by 2035.

How much will be the biopolymers market growth between 2025 and 2035?

The biopolymers market is expected to grow at a 11.0% CAGR between 2025 and 2035.

What are the key product types in the biopolymers market?

The key product types in biopolymers market are bio-pe, bio-pet, poly lactic acid (pla), polyhydroxyalkanoate (pha), biodegradable polyesters and others (biodegradable starch blends, biodegradable polyesters etc.).

Which application segment to contribute significant share in the biopolymers market in 2025?

In terms of application, packaging segment to command 35.6% share in the biopolymers market in 2025.

Future Market Insights

Biopolymers Market

Chat With

MaRIA

Hi There, I am MaRIA, Your Market Research Intelligence Assistant. How may I help you?