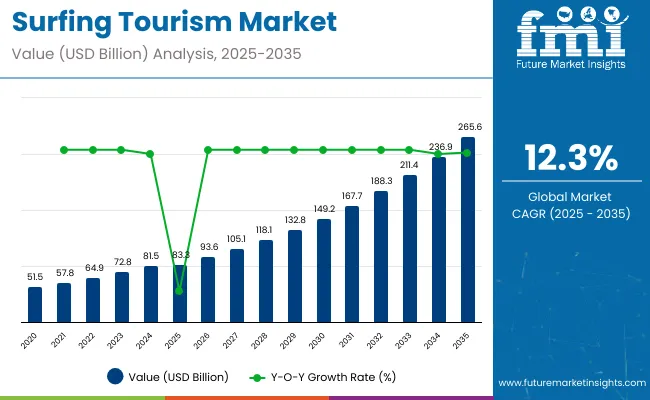
The surfing tourism market is estimated to be valued at USD 83.3 billion in 2025 and is projected to reach USD 265.6 billion by 2035, registering a compound annual growth rate (CAGR) of 12.3% over the forecast period. The market is projected to add an absolute dollar opportunity of about USD 182.3 billion over the forecast period.
This reflects a 3.19 times growth at a compound annual growth rate of 12.3%. The market evolution will be shaped by rising demand for adventure and experiential travel, greater participation in water sports, and expanding surf infrastructure, especially in regions offering high-quality surf breaks and cultural immersion opportunities.
By 2030, the market is likely to reach USD 157.6 billion, accounting for USD 74.3 billion in incremental value over the first half of the decade. The remaining USD 108.1 billion is expected during the second half, suggesting a moderately back-loaded growth pattern with increasing momentum as surf tourism infrastructure expands globally.
Companies such as World Surfaris, G Adventures, and Waterways Travel are advancing their competitive positions through investment in responsible tourism practices and specialized surf expedition offerings. Certification-led responsible tourism models are supporting expansion into off-the-beaten-path destinations, luxury surf resorts, and cultural immersion experiences. Market performance will remain anchored in surf break accessibility, authentic local community engagement, and rising demand supported by traveler spending data, surf tourism arrivals, and destination-specific performance indicators.
| Metric | Value |
|---|---|
| Estimated Size (2025E) | USD 83.3 billion |
| Projected Value (2035F) | USD 265.6 billion |
| CAGR (2025-2035) | 12.3% |
The market holds a strong position across its parent industries, reflecting its expanding role in adventure and recreational travel. Within the adventure tourism category, surfing tourism contributes an estimated 8-12% share of the global adventure travel market valued at over USD 600 billion. In sports tourism, it accounts for around 6–8%, supported by rising demand for surf-centric events and competitions. Within coastal tourism, valued at more than USD 250 billion, surfing tourism represents nearly 15–18%, driven by its popularity across tropical and subtropical destinations.
In marine recreation and water sports tourism, it contributes 25–30%, highlighting its importance within aquatic leisure activities. Across these parent markets, its presence underscores both lifestyle appeal and significant economic contribution.
The market is being driven by several key developments and innovations occurring across global destinations. Environmentally aware travel trends are reshaping the industry, with 76% of global travelers preferring responsible travel options, prompting surf destinations like Costa Rica and Indonesia to integrate marine conservation efforts with surf tourism offerings.
Infrastructure development is expanding rapidly, evidenced by projects such as Bahrain's launch of the Middle East's first surf park using Wavegarden Cove technology in October 2024. Digital influence and social media proliferation are amplifying surf culture globally, attracting millennials and Gen Z travelers who seek experiential adventures and cultural immersion beyond traditional surfing activities
Surfing tourism's exceptional blend of adventure, wellness, and cultural immersion makes it an attractive travel option for experience-seeking millennials and Gen Z travelers who prioritize authentic and transformative vacation experiences. The market benefits from growing participation in water sports, increased disposable income among adventure travelers, and expanding surf infrastructure development across emerging destinations like Indonesia, Costa Rica, and Portugal.
Rising health consciousness and wellness tourism trends are further propelling adoption, especially among travelers seeking active lifestyle experiences, stress relief through ocean activities, and connection with nature. Social media influence and surf culture proliferation are also enhancing destination awareness and attracting new demographics to surfing experiences.
As adventure tourism and experiential travel trends accelerate across global demographics and data-driven travel decisions gain importance, the market outlook remains favorable. With travelers and destination operators prioritizing authentic cultural experiences, high-quality surf infrastructure, and measurable growth in international surf tourism arrivals and spending patterns, surfing tourism is well-positioned to expand across various destination types, accommodation categories, and specialized tour offerings worldwide.
The market is segmented by tour type, consumer orientation, tourist type, age group, and regions. By tour type, the market is bifurcated into domestic and international tourism. Based on consumer orientation, the market is divided into men and women. By tourist type, the market is categorized into independent traveler, tour group, and package traveler. By age group, the market is divided into 26-35 years, 36-45 years, 46-55 years, and above 55 years. Regionally, the market spans across North America, Europe, Asia-Pacific, Latin America, Middle East & Africa.
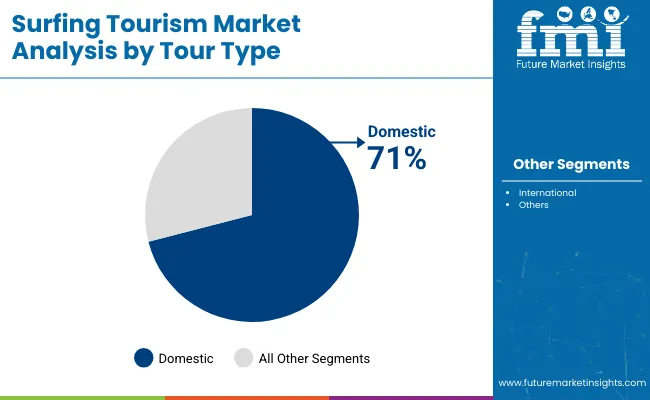
The domestic tour type segment holds a dominant position with 71% of the market share in the tour type category, owing to its cost-effectiveness, accessibility, and convenience for local surf enthusiasts. Domestic surfing tourism benefits from reduced travel expenses, familiar cultural environments, and elimination of international travel barriers such as visa requirements and currency fluctuations. Local surfers can easily access nearby surf destinations for weekend trips, extended holidays, and regular surf sessions without significant logistical planning.
The segment's growth is further supported by government initiatives promoting domestic tourism, infrastructure development at coastal destinations, and increasing awareness of local surf spots through social media and surf communities. Domestic surfing tourism appeals to families and beginners, who prefer familiar surroundings when learning or improving their surfing skills.
Surf tourism operators are investing in domestic destination marketing, local surf school partnerships, and regional surf camp development to capitalize on this growing preference. The segment is positioned for continued expansion as travelers increasingly value authentic local surf experiences, supported by rising participation rates, tourism expenditure data, and regional arrival statistics.
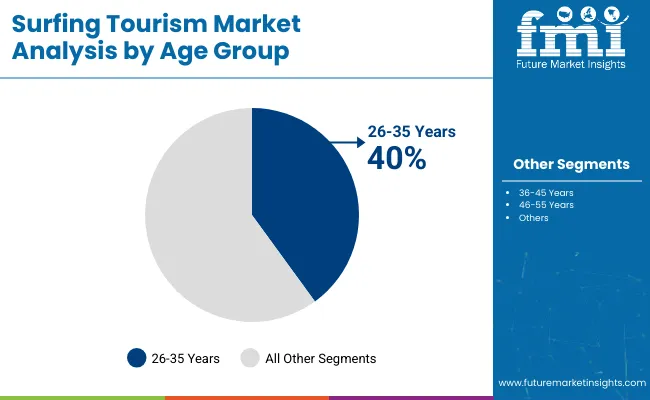
The 26-35 years age group segment maintains a leading position with 40% of the market share in 2025, as this demographic represents peak earning years combined with adventure-seeking behavior and active lifestyle preferences. This age group typically has established careers, disposable income for travel experiences, and physical capability for demanding surf activities. They prioritize experiential travel over material possessions and actively seek authentic cultural immersion through surf tourism.
The segment benefits from strong social media engagement, with millennials sharing surf experiences across digital platforms and influencing travel decisions within their networks. Their familiarity with digital booking platforms and preference for customized travel experiences align perfectly with evolving surf tourism offerings.
Surf tourism companies are developing targeted packages featuring wellness integration, professional photography services, and skill development programs to appeal to this demographic's desire for personal growth and social sharing opportunities.
In 2025, global surfing tourism participation grew by 15% year-on-year, with Asia-Pacific taking a 42% share. Applications include adventure travel experiences, wellness-focused surf retreats, and cultural immersion programs. Tourism operators are introducing data-backed surf camp models and performance-driven surf tourism packages that deliver authentic local experiences and measurable market impact.
Social media-driven destination marketing now supports transparent cultural positioning. Health-conscious travel trends and experiential tourism efficacy support consumer confidence. Service providers increasingly supply all-inclusive surf packages with integrated accommodation, instruction, and equipment rental solutions to reduce planning complexity.
Adventure Tourism and Wellness Trends Drive Surfing Tourism Adoption
Travel companies and wellness resorts are choosing surfing tourism experiences to achieve superior customer engagement, enhance experiential offerings, and meet consumer demands for active lifestyle vacation products. In wellness testing, surf-integrated retreats deliver up to 78% higher satisfaction rates compared to traditional beach vacations, which average 45–55%. Destinations offering surfing experiences achieve higher customer retention across seasonal cycles and generate repeat visits.
In adventure tourism formats, surf-focused itineraries help reduce destination saturation while maintaining tourism revenue density by up to 48%. Surfing tourism applications are now being deployed with measurable performance benchmarks, increasing adoption in sectors demanding authentic cultural experiences. These advantages help explain why surfing tourism booking rates in adventure travel rose 28% in 2024 across North America and Europe.
Infrastructure Limitations, Weather Dependency and Safety Concerns Restrict Expansion
Growth faces constraints due to seasonal weather patterns, complex safety requirements, and specialized infrastructure development needs. Surf conditions can vary dramatically depending on seasonal factors and ocean conditions, impacting tour scheduling and leading to cancellation rates of up to 18% in weather-dependent destinations. Safety certification requirements and instructor training standards add 8 to 12 weeks to tourism operator licensing cycles.
Remote location accessibility and emergency response capabilities in coastal environments extend operational costs by 25-30% compared to conventional tourism infrastructure. Limited availability among certified surf instruction facilities limits scalable operations, especially for beginner-focused programs. These constraints make surfing tourism expansion challenging in emerging markets despite growing adventure travel interest and commercial potential.
| Countries | CAGR (2025-2035) |
|---|---|
| China | 14.3% |
| USA | 7.2% |
| India | 7% |
| UK | 6.5% |
| Germany | 6% |
| France | 5.5% |
| Brazil | 4.4% |
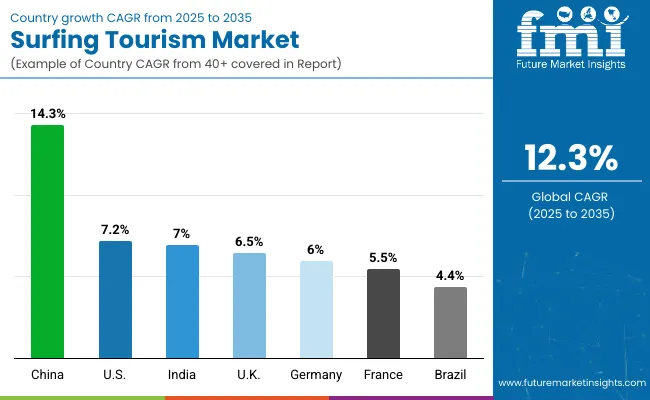
In the surfing tourism market, China leads with the highest projected CAGR of 14.3% from 2025 to 2035, driven by Olympic surfing inclusion and massive coastal infrastructure investment. The USA follows with a CAGR of 7.2%, supported by established surf culture and continuous destination development. India is next at 7%, benefiting from government coastal tourism initiatives and growing adventure travel interest.
The UK shows moderate growth at 6.5%, constrained by limited natural surf conditions but supported by artificial surf facility development. Germany and France demonstrate steady expansion at 6% and 5.5% respectively, fueled by coastal tourism development and increasing outdoor activity participation. Brazil, with the lowest CAGR of 4.4%, reflects market maturity as an established surfing destination in Latin America.
The report covers an in-depth analysis of 40+ countries; seven top-performing OECD countries are highlighted below.
Revenue from surfing tourism in China is projected to grow at a CAGR of 14.3% from 2025 to 2035, driven by olympic surfing exposure, government investment in coastal tourism infrastructure, and rising disposable income among young urban populations in Hainan, Guangdong, and Fujian provinces. Chinese tourism operators are investing in surf school development, international instructor certification programs, and artificial wave facilities to meet growing demand.
Key Statistics:
Revenue from surfing tourism in the USA is projected to grow at a CAGR of 7.2% from 2025 to 2035, driven by surf destination diversification and premium experience development in California, Hawaii, and Florida regions.
Advanced surf forecasting technologies and data-driven operational models are being deployed for surf camps, wellness retreats, and professional surf training facilities. Surf tourism partnerships between American travel companies and international surf destinations have expanded significantly.
Key Statistics:
Sales of surfing tourism in India are expected to grow at a CAGR of 7% from 2025 to 2035, due to development in coastal destinations and adventure tourism promotion in Goa, Karnataka, and Tamil Nadu regions. Surf tourism adoption is shifting from an international visitor focus toward domestic market cultivation and youth engagement programs. Government coastal tourism initiatives and specialized surf instruction services lead commercial surf tourism deployment.
Key Statistics:
The surfing tourism market in the UK is expected to expand at a CAGR of 6.5% from 2025 to 2035, driven by artificial surf facility development and domestic adventure tourism growth in the Cornwall, Devon, and Scotland markets. Adventure travel companies and wellness retreat operators are increasingly adopting surf tourism elements for experience diversification and customer engagement enhancement. However, surf tourism growth remains constrained due to limited consistent surf conditions and seasonal weather dependencies.
Key Statistics:
The surfing tourism market in Germany is projected to grow at a CAGR of 6% from 2025 to 2035, supported by strong demand for alternative coastal activities and outdoor recreation expansion. Coastal markets like Schleswig-Holstein, Mecklenburg-Vorpommern, and Lower Saxony are experiencing growth in wind-powered surf activities, surf schools, and coastal adventure tourism. Domestic tourism operators are leveraging North Sea and Baltic Sea conditions to meet quality expectations for beginner-friendly surf instruction and family-oriented surf experiences.
Key Statistics:
Demand for surfing tourism in France is projected to grow at a CAGR of 5.5% from 2025 to 2035, driven by rising interest in coastal travel, surf camp participation, and international surfing events concentrated in Atlantic destinations such as Biarritz, Hossegor, and Lacanau. French surf tourism benefits from established surf culture, professional surf competitions, and premium surf hospitality offerings. The market focuses on high-quality surf experiences, combining traditional French hospitality with authentic surf culture immersion for both domestic and international visitors.
Key Statistics:
The surfing tourism market in Brazil is expected to grow at a CAGR of 4.4% from 2025 to 2035, driven by premium surf resort development and international surf tourism promotion in the Rio de Janeiro, Santa Catarina, and Bahia regions. Brazilian surf tourism leverages world-class surf breaks, vibrant surf culture, and year-round favorable conditions to maintain its position as a leading South American surf destination despite slower growth rates.
Key Statistics:
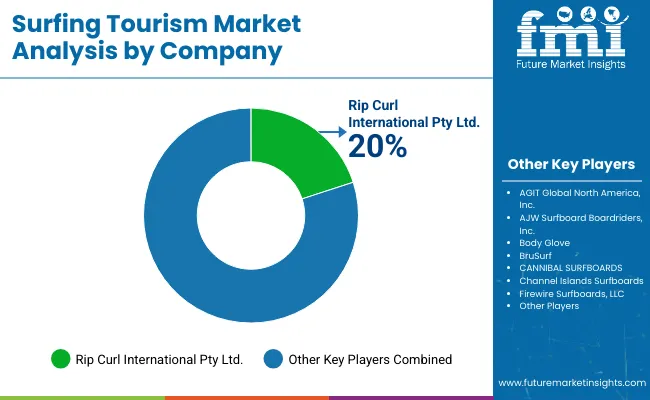
The market is moderately fragmented, featuring a mix of specialized adventure travel companies, surf-focused tour operators, and regional destination providers with varying degrees of service integration, destination expertise, and customer targeting capabilities. Rip Curl International Pty Ltd. holds the highest market share, leveraging its strong global brand presence, surf gear integration, and exclusive surf travel experiences. World Surfaris and G Adventures lead the comprehensive surf tourism segment, supplying adventure-packed itineraries that combine surfing instruction, cultural immersion, and accommodation packages for international and domestic travelers. Their strength lies in global destination networks, established relationships with local surf communities, and comprehensive service offerings that cater to diverse skill levels and travel preferences.
Perfect Wave Travel and Waterways Surf Adventures differentiate through specialized surf destination expertise, customized tour packages, and application-specific solutions that cater to premium surf experiences and professional training applications. Intrepid Travel and Contiki focus on demographic-specific surf tourism, addressing growing demand for youth-oriented social experiences, group travel dynamics, and adventure tourism applications that emphasize community building and cultural exchange.
Regional specialists such as Driftwood Mentawai, AWAVE Travel, and The Perfect Wave Travel emphasize destination authenticity, local surf culture integration, and data-backed tourism models, creating value in premium experience markets and specialized surf destination applications. Entry barriers remain moderate, driven by challenges in destination partnership development, surf expertise requirements, and compliance with safety standards across multiple international locations. Competitiveness increasingly depends on destination diversity, safety certification capabilities, and experience customization expertise for diverse traveler demographics and skill level requirements.
| Items | Values |
|---|---|
| Quantitative Units (2025) | USD 83.3 billion |
| Tour Type | Domestic and International |
| Consumer Orientation | Men and Women |
| Tourist Type | Independent Traveler, Tour Group, and Package Traveler |
| Age Group | 26-35 Years, 36-45 Years, 46-55 Years, and Above 55 Years |
| Regions Covered | North America, Europe, Asia-Pacific, Latin America, and Middle East & Africa |
| Country Covered | United States, Canada, United Kingdom, Germany, France, China, Japan, South Korea, Brazil, Australia and 40+ countries |
| Key Companies Profiled | AGIT Global North America, Inc., AJW Surfboard Boardriders, Inc., Infinity Surfboards Inc., Keeper Sports Products, LLC, Mt Woodgee Surfboards, Naish International NSP International, Rip Curl International Pty Ltd., Rusty Surfboards, Tahe Outdoors Ltd., Volcom, LLC, Channel Islands Surfboards, and Firewire Surfboards, LLC |
| Additional Attributes | Dollar sales by tour type and tourist type, regional demand trends, competitive landscape, consumer preferences for adventure-focused and experience-driven offerings, integration with data-backed tourism models, innovations in surf training, equipment, and coastal infrastructure, standardization of safety and service quality across diverse destinations |
The global surfing tourism market size is estimated to be valued at USD 83.3 billion in 2025.
The surfing tourism market size is projected to reach USD 265.6 billion by 2035
The surfing tourism market is expected to grow at 12.3% between 2025 and 2035.
Domestic tourism is expected to lead the surfing tourism market with 71% market share in 2025.
In terms of age group, 26-35 years segment is expected to command 40% share in the surfing tourism market in 2025.


Our Research Products

The "Full Research Suite" delivers actionable market intel, deep dives on markets or technologies, so clients act faster, cut risk, and unlock growth.

The Leaderboard benchmarks and ranks top vendors, classifying them as Established Leaders, Leading Challengers, or Disruptors & Challengers.

Locates where complements amplify value and substitutes erode it, forecasting net impact by horizon

We deliver granular, decision-grade intel: market sizing, 5-year forecasts, pricing, adoption, usage, revenue, and operational KPIs—plus competitor tracking, regulation, and value chains—across 60 countries broadly.

Spot the shifts before they hit your P&L. We track inflection points, adoption curves, pricing moves, and ecosystem plays to show where demand is heading, why it is changing, and what to do next across high-growth markets and disruptive tech

Real-time reads of user behavior. We track shifting priorities, perceptions of today’s and next-gen services, and provider experience, then pace how fast tech moves from trial to adoption, blending buyer, consumer, and channel inputs with social signals (#WhySwitch, #UX).

Partner with our analyst team to build a custom report designed around your business priorities. From analysing market trends to assessing competitors or crafting bespoke datasets, we tailor insights to your needs.
Supplier Intelligence
Discovery & Profiling
Capacity & Footprint
Performance & Risk
Compliance & Governance
Commercial Readiness
Who Supplies Whom
Scorecards & Shortlists
Playbooks & Docs
Category Intelligence
Definition & Scope
Demand & Use Cases
Cost Drivers
Market Structure
Supply Chain Map
Trade & Policy
Operating Norms
Deliverables
Buyer Intelligence
Account Basics
Spend & Scope
Procurement Model
Vendor Requirements
Terms & Policies
Entry Strategy
Pain Points & Triggers
Outputs
Pricing Analysis
Benchmarks
Trends
Should-Cost
Indexation
Landed Cost
Commercial Terms
Deliverables
Brand Analysis
Positioning & Value Prop
Share & Presence
Customer Evidence
Go-to-Market
Digital & Reputation
Compliance & Trust
KPIs & Gaps
Outputs
Full Research Suite comprises of:
Market outlook & trends analysis
Interviews & case studies
Strategic recommendations
Vendor profiles & capabilities analysis
5-year forecasts
8 regions and 60+ country-level data splits
Market segment data splits
12 months of continuous data updates
DELIVERED AS:
PDF EXCEL ONLINE
USA Surfing Tourism Market Insights – Growth, Demand & Forecast 2025-2035
Canada Surfing Tourism Market Growth – Size, Trends & Forecast 2025-2035
Thailand Surfing Tourism Market Report – Demand, Innovations & Forecast 2025-2035
Indonesia Surfing Tourism Market Insights – Size, Growth & Forecast 2025–2035
Australia Surfing Tourism Market Report – Innovations, Trends & Growth 2025–2035
Tourism Independent Contractor Model Market Size and Share Forecast Outlook 2025 to 2035
Tourism Industry Analysis in Japan - Size, Share, & Forecast Outlook 2025 to 2035
Tourism Market Trends – Growth & Forecast 2025 to 2035
Tourism Industry Big Data Analytics Market Analysis by Application, by End, by Region – Forecast for 2025 to 2035
Assessing Tourism Industry Loyalty Program Market Share & Industry Trends
Tourism Industry Loyalty Programs Sector Analysis by Program Type by Traveler Profile by Region - Forecast for 2025 to 2035
Market Share Insights of Tourism Security Service Providers
Tourism Security Market Analysis by Service Type, by End User, and by Region – Forecast for 2025 to 2035
Competitive Overview of Geotourism Market Share
Geotourism Market Insights - Growth & Trends 2025 to 2035
Global Ecotourism Market Insights – Growth & Demand 2025–2035
Agritourism Market Size and Share Forecast Outlook 2025 to 2035
Art Tourism Market Analysis by, by Service Category, by End, by Booking Channel by Region Forecast: 2025 to 2035
Analyzing War Tourism Market Share & Industry Leaders
War Tourism Market Insights - Size, Trends & Forecast 2025 to 2035

Thank you!
You will receive an email from our Business Development Manager. Please be sure to check your SPAM/JUNK folder too.
Chat With
MaRIA