Flavored Syrup Market Outlook for 2024 to 2034

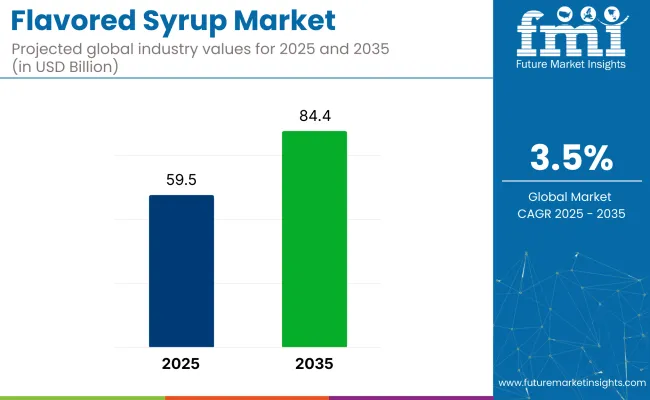
The flavored syrup market is estimated to be valued at USD 57,230.9 million in 2024. It is expected to rise to USD 81,200.0 million by 2034. The global market is projected to grow at a CAGR of 4.00% during the forecast period.

Key Market Drivers

  • Increasing consumer preferences for diverse and unique flavors in food and beverages
  • The growing popularity of specialty coffee and tea beverages, including flavored lattes, iced coffees, and artisanal teas
  • The global expansion of the beverage industry, including both non-alcoholic and alcoholic beverages
  • Convenience and customization offered by flavored syrups to consumers to modify their beverages according to their taste preferences
  • Growth in the foodservice sector, including restaurants, cafes, and bars providing a diverse and appealing menu
  • Continuous innovation in terms of new flavors and product formulations by manufacturers
  • The development of flavored syrups with natural and organic ingredients, as well as those with reduced sugar content
  • The increasing globalization of food and beverage trends, along with the influence of different cultures
Attributes Key Statistics
Flavored Syrup Market Value (2024) USD 57,230.9 million
Anticipated Market Value (2034) USD 81,200.0 million
CAGR (2024 to 2034) 4.00%

Don't pay for what you don't need

Customize your report by selecting specific countries or regions and save 30%!

Consumption Analysis of the Flavored Syrup Market

  • Beverage enthusiasts who enjoy experimenting with different beverages, such as coffee, tea, and cocktails, form one of the largest consumer groups in the global flavored syrup market. This group also includes coffee aficionados and tea lovers.
  • People who enjoy creating customized beverages at home, including flavored sodas, mocktails, and homemade coffee creations, contribute significantly to this market. They use flavored syrups in recipes for cakes, desserts, and sauces.
  • Bars and restaurants also consume a substantial amount of flavored syrup. These units incorporate unique and flavorful cocktails and mocktails in their menus, which can only be made using these syrups.
  • Health-conscious individuals are another consumer segment in this market. These individuals seek flavored syrups with natural or organic ingredients, as well as those with reduced sugar content.
  • Younger demographics, in the urban and semi-urban setups, are one of the emerging consumer bases in this market. These individuals are drawn to the Instagram-worthy food and beverage experiences.
  • Consumers who seek gourmet and specialty food items also seek flavored syrups for beverages and culinary applications.

Historical Analysis of the Flavored Syrup Market

The flavored syrup market generated an estimated revenue of USD 44,909.51 million in 2019. In the span of four years, the market grew at a pace of 3.80% CAGR. Several reasons can be attributed to this growth.

Historical Market Valuation, 2019 USD 44,909.51 million
HCAGR (2019 to 2023) 3.80%

The market heavily relies on a multitude of factors, including changes in consumer spending habits, disposable income levels, and consumer preferences for indulgent or value-added products. Trends in the broader beverage industry also influence the market. Besides this, the growth of the hospitality and foodservice industries, including restaurants, cafes, and bars, impacts the demand for flavored syrups.

In the past few years, the market has seen a series of ups and downs. During the pandemic, as the world faced sudden shutdowns, the demand for non-essential commodities such as mocktails and cocktails plunged. This negatively affected the global market revenue. The shutdown of restaurants and the hospitality sector worldwide resulted in a sudden and substantial reduction in the consumption of beverages.

However, as the world got accustomed to the new normal, things gradually began to pace up. As economies recovered, the foodservice sector rebounded, positively impacting the market. As the world continues to focus on health and wellness, the demand for flavored syrups with natural and healthier formulations is likely to drive the market.

Nandini Roy Choudhury

Principal Consultant

Talk to Analyst

Find your sweet spots for generating winning opportunities in this market.

Restraining Factors Adversely Affecting the Flavored Syrup Market

The market is anticipated to surpass a global valuation of USD 81,200.0 million by the year 2034, with a growth rate of 4.00% CAGR. While the market is expected to experience substantial growth, several restraining factors could adversely affect its development:

  • As the world pushes toward healthier dietary habits, there are increasing concerns over high sugar intake through these syrups. Consumers all over the world prefer sugar-free syrups, which is impacting sales of traditional ones.
  • The ongoing trend of clean eating, including natural and clean-label products, is deterring a substantial amount of consumers from choosing flavored syrups. Concerns about artificial colors and preservatives have led to a decline in demand.
  • The market is also becoming very competitive due to the influx of numerous companies. This has led to cut-throat competition, lower profit margins, crowding of products, and unnecessary dumping.
  • Increasing regulations related to food safety, labeling, and ingredient sourcing can pose challenges for flavored syrup manufacturers.

Category-wise Insights

Synthetic Flavored Syrups Gaining Popularity Despite the Natural Products Trend

Regardless of the general population's ongoing inclination toward clean-labeled and natural food products, synthetically flavored syrups have retained their dominance in the global market. Synthetic flavored syrups are in great demand as they offer consistent flavor profiles, cost-effectiveness, and versatility in a wide range of applications. They can also be precisely engineered to achieve a consistent taste, flavor intensity, and quality.

Attributes Details
Top Sourcing Synthetic
Market share in 2024 34.00%

Based on the sourcing, synthetic flavored syrups dominate the global market with a share of 34%. Compared to natural syrups, artificially flavored syrups also come with an extended shelf life. This makes it easier for commercial and household setups to store and transport these syrups effectively. Flavored syrups are also gaining popularity due to their cost-effectiveness compared to natural ones.

Coffee-Flavor Dominates the Flavored Syrup Market Globally

One in every two adults in the world starts their day with a brewing cup of coffee. However, with increasing concerns about the ill effects of excessive coffee consumption, consumers are opting for coffee substitutes, especially coffee-flavored beverages. This has substantially increased the demand for flavored syrups that closely resemble the taste of coffee, making them a must-have in both home kitchens and professional settings.

Attributes Details
Top Flavor Type Coffee
Market share in 2024 13.00%

On the basis of flavor, coffee-flavored syrups dominate the global market with a remarkable share of 13%. This popularity is also attributed to the ever-growing coffee culture and the desire for diverse taste experiences.

The adaptability of these syrups, where they can be incorporated into various applications, like hot and cold beverages, desserts, cakes, pastries, etc., has also brimmed with appeal and contributed significantly to the widespread adoption of coffee-flavored syrups.

Get the data you need at a Fraction of the cost

Personalize your report by choosing insights you need
and save 40%!

Country-wise Insights

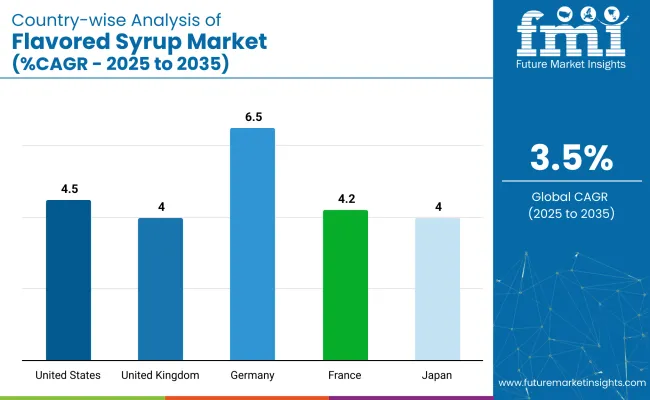
The section provides an analysis of the flavored syrup market by country, including Australia, Germany, the United States, China, and Japan. The table presents the CAGR for each country, indicating the expected growth of the market in that country through 2034.

Countries CAGR (2024 to 2034)
Germany 6.50%
China 5.50%
The United States 4.50%
Japan 4.00%
Australia 3.40%

Flavored Syrup Market in Germany

Germany is one of the leading countries in this market. The German flavored syrup market is anticipated to retain its dominance by progressing at a CAGR of 6.50% till 2034.

The German market, like the international one, has witnessed a shift toward healthier alternatives. This has boosted the demand for nutritious beverages and shakes in the general German population. Flavor is an essential component in these syrups, thus augmenting sales for these products.

Germany’s rich culture of food is another reason behind the increased demand for flavored syrups, as the use of flavored syrups is not limited to beverages, it can also be used in various dishes such as pancakes, pastries, and other desserts.

Flavored Syrup Market in China

In the Asian region, China leads the flavored syrup market. The market in China is anticipated to retain its dominance by progressing at a CAGR of 5.50% till 2034.

Western food and beverage trends have had a significant influence on the Chinese general population. This has opened new ventures for the foodservice sector in China to incorporate milkshakes, coffee-flavored beverages, and smoothies in their offerings, amplifying the growth of the flavored syrup market.

China’s growing middle-class population and rising disposable incomes have also led to an increasing demand for premium and innovative food and beverage products. All these factors have collectively skyrocketed the significance of flavored syrups in the Chinese marketplace.

Flavored Syrup Market in the United States

In the North American region, the United States dominates the market. The United States flavored syrup market is anticipated to exhibit a CAGR of 4.50% till 2034.

The ongoing trend of crafted beer and customized beverages is one of the primary reasons for the growth of the market in the United States. Flavored syrups play a significant role in creating specialty coffees, cocktails, and artisanal drinks. These syrups also provide a customizable and adaptable option, catering to the varied tastes of American consumers. All these factors have collectively contributed to the growth of this market.

Flavored Syrup Market in Japan

Japan is another country in the Asian region that is leading the market. The Japanese flavored syrup market is anticipated to register a CAGR of 4.00% through 2034.

Japan has a rich tradition of consuming tea. The Japanese have been having tea since the beginning of time. In the last few decades, there have been tremendous modifications in the way the Japanese people consume tea. The use of flavored syrups in teas and desserts, such as matcha lattes and Japanese sweets, has contributed to their popularity in the Japanese market.

Flavored Syrup Market in Australia

Australia is another country that is leading in the flavored syrup market. Australian demand for flavored syrup is projected to rise at a 3.40% CAGR over the next ten years.

Australia is one of the most visited countries in the world. Every year, millions of tourists flock to the continent to experience a pleasant vacation. The brilliant hospitality industry of Australia, including cafes and restaurants, has embraced flavored syrups to enhance the overall beverage and culinary experience. This has driven consumer awareness and demand for flavored syrups.

Competitive Landscape

The global flavored syrup market is highly concentrated, with prominent players such as Monin Inc., Sensient Technologies, The Hershey Company, Tate & Lyle, Kerry Group, etc.

Key companies in the market are engaged in the production of sugar-free syrups for health-conscious customers. International players are likely to manufacture organically flavored syrups to meet consumers' rising desire for natural food additives. There is a substantial number of small players, too, in the market. These brands cater to the demands of local consumers.

Recent Developments

  • In August 2023, Jordan's Skinny Mixes launched a new naturally sweetened Pumpkin Spice syrup, offering zero calories and sugar. The flavor, curated with natural ingredients, elevated beverages to new heights.
  • Recently, IHOP and Kraft Heinz joined forces to launch a pancake-inspired coffee line featuring Signature Blend, Chocolate Chip, and Buttery Syrup flavors, extending the iconic restaurant chain's CPG offerings.
  • In March 2023, Torani, a flavor industry leader for almost a century, introduced Torani Kettle Corn Syrup, blending sweet and salty for a familiar yet delightfully unexpected flavor in its extensive lineup.

Key Companies in the Market

  • The Hershey Company
  • Monin
  • Torani
  • DaVinci Gourmet
  • Fuerst Day Lawson (FDL)
  • Kerry Group
  • Sensient Technologies Corporation
  • Concord Foods
  • Mocafe
  • Amoretti
  • Ghirardelli Chocolate Company
  • Tate & Lyle PLC
  • Jordan's Skinny Mixes
  • Sweetbird
  • 1883 Maison Routin
  • Nestlé S.A.
  • Walden Farms
  • Jordan's Skinny Syrups
  • Sunny Sky Products
  • R. Torre & Company (Monin)

Market Segmentation

By Flavor:

  • Fruit
  • Chocolate
  • Vanilla
  • Coffee
  • Herbs & Seasonings

By Application:

  • Beverages
  • Diary & Frozen Desserts
  • Confectionery
  • Bakery

By Flavor Type:

  • Sweet
  • Salty
  • Sour
  • Savory
  • Mint

By Product type:

  • Natural
  • Synthetic

By Region:

  • North America
  • Latin America
  • Europe
  • Asia Pacific
  • MEA

Frequently Asked Questions

How Big is the Flavored Syrup Market in 2024?

The global flavored syrup market is estimated to be worth USD 57,230.9 million in 2024.

What is the Sales Forecast for Flavored Syrup through 2034?

The market is expected to reach USD 81,200.0 million by 2034.

At What Rate is the Market Expected to Grow?

The market is growing at a CAGR of 4.00% from 2024 to 2034.

Who are the Key Manufacturing Companies for Flavored Syrup?

Some of the key players in the market are Monin Inc., Sensient Technologies, The Hershey Company, Tate & Lyle, Kerry Group, etc.

Which is the Preferred Flavored Syrup in the International Market?

Coffee-flavored syrup dominates the market with a revenue share of 13%.

Table of Content
1. Executive Summary
    1.1. Global Market Outlook
    1.2. Demand-side Trends
    1.3. Supply-side Trends
    1.4. Technology Roadmap Analysis
    1.5. Analysis and Recommendations
2. Market Overview
    2.1. Market Coverage / Taxonomy
    2.2. Market Definition / Scope / Limitations
3. Market Background
    3.1. Market Dynamics
        3.1.1. Drivers
        3.1.2. Restraints
        3.1.3. Opportunity
        3.1.4. Trends
    3.2. Scenario Forecast
        3.2.1. Demand in Optimistic Scenario
        3.2.2. Demand in Likely Scenario
        3.2.3. Demand in Conservative Scenario
    3.3. Opportunity Map Analysis
    3.4. Product Life Cycle Analysis
    3.5. Supply Chain Analysis
        3.5.1. Supply Side Participants and their Roles
            3.5.1.1. Producers
            3.5.1.2. Mid-Level Participants (Traders/ Agents/ Brokers)
            3.5.1.3. Wholesalers and Distributors
        3.5.2. Value Added and Value Created at Node in the Supply Chain
        3.5.3. List of Raw Material Suppliers
        3.5.4. List of Existing and Potential Buyer’s
    3.6. Investment Feasibility Matrix
    3.7. Value Chain Analysis
        3.7.1. Profit Margin Analysis
        3.7.2. Wholesalers and Distributors
        3.7.3. Retailers
    3.8. PESTLE and Porter’s Analysis
    3.9. Regulatory Landscape
        3.9.1. By Key Regions
        3.9.2. By Key Countries
    3.10. Regional Parent Market Outlook
    3.11. Production and Consumption Statistics
    3.12. Import and Export Statistics
4. Global Market Analysis 2019 to 2023 and Forecast, 2024 to 2034
    4.1. Historical Market Size Value (US$ Million) & Volume (Tons) Analysis, 2019 to 2023
    4.2. Current and Future Market Size Value (US$ Million) & Volume (Tons) Projections, 2024 to 2034
        4.2.1. Y-o-Y Growth Trend Analysis
        4.2.2. Absolute $ Opportunity Analysis
5. Global Market Analysis 2019 to 2023 and Forecast 2024 to 2034, By Flavor
    5.1. Introduction / Key Findings
    5.2. Historical Market Size Value (US$ Million) & Volume (Tons) Analysis By Flavor, 2019 to 2023
    5.3. Current and Future Market Size Value (US$ Million) & Volume (Tons) Analysis and Forecast By Flavor, 2024 to 2034
        5.3.1. Fruit
        5.3.2. Chocolate
        5.3.3. Vanilla
        5.3.4. Coffee
        5.3.5. Herbs & Seasonings
    5.4. Y-o-Y Growth Trend Analysis By Flavor, 2019 to 2023
    5.5. Absolute $ Opportunity Analysis By Flavor, 2024 to 2034
6. Global Market Analysis 2019 to 2023 and Forecast 2024 to 2034, By Application
    6.1. Introduction / Key Findings
    6.2. Historical Market Size Value (US$ Million) & Volume (Tons) Analysis By Application, 2019 to 2023
    6.3. Current and Future Market Size Value (US$ Million) & Volume (Tons) Analysis and Forecast By Application, 2024 to 2034
        6.3.1. Beverages
        6.3.2. Diary & Frozen Desserts
        6.3.3. Confectionery
        6.3.4. Bakery
    6.4. Y-o-Y Growth Trend Analysis By Application, 2019 to 2023
    6.5. Absolute $ Opportunity Analysis By Application, 2024 to 2034
7. Global Market Analysis 2019 to 2023 and Forecast 2024 to 2034, By Flavor Type
    7.1. Introduction / Key Findings
    7.2. Historical Market Size Value (US$ Million) & Volume (Tons) Analysis By Flavor Type, 2019 to 2023
    7.3. Current and Future Market Size Value (US$ Million) & Volume (Tons) Analysis and Forecast By Flavor Type, 2024 to 2034
        7.3.1. Sweet
        7.3.2. Salty
        7.3.3. Sour
        7.3.4. Savoury
        7.3.5. Mint
    7.4. Y-o-Y Growth Trend Analysis By Flavor Type, 2019 to 2023
    7.5. Absolute $ Opportunity Analysis By Flavor Type, 2024 to 2034
8. Global Market Analysis 2019 to 2023 and Forecast 2024 to 2034, By Product type
    8.1. Introduction / Key Findings
    8.2. Historical Market Size Value (US$ Million) & Volume (Tons) Analysis By Product type, 2019 to 2023
    8.3. Current and Future Market Size Value (US$ Million) & Volume (Tons) Analysis and Forecast By Product type, 2024 to 2034
        8.3.1. Natural
        8.3.2. Synthetic
    8.4. Y-o-Y Growth Trend Analysis By Product type, 2019 to 2023
    8.5. Absolute $ Opportunity Analysis By Product type, 2024 to 2034
9. Global Market Analysis 2019 to 2023 and Forecast 2024 to 2034, By Region
    9.1. Introduction
    9.2. Historical Market Size Value (US$ Million) & Volume (Tons) Analysis By Region, 2019 to 2023
    9.3. Current Market Size Value (US$ Million) & Volume (Tons) Analysis and Forecast By Region, 2024 to 2034
        9.3.1. North America
        9.3.2. Latin America
        9.3.3. Western Europe
        9.3.4. Eastern Europe
        9.3.5. South Asia and Pacific
        9.3.6. East Asia
        9.3.7. Middle East and Africa
    9.4. Market Attractiveness Analysis By Region
10. North America Market Analysis 2019 to 2023 and Forecast 2024 to 2034, By Country
    10.1. Historical Market Size Value (US$ Million) & Volume (Tons) Trend Analysis By Market Taxonomy, 2019 to 2023
    10.2. Market Size Value (US$ Million) & Volume (Tons) Forecast By Market Taxonomy, 2024 to 2034
        10.2.1. By Country
            10.2.1.1. USA
            10.2.1.2. Canada
        10.2.2. By Flavor
        10.2.3. By Application
        10.2.4. By Flavor Type
        10.2.5. By Product type
    10.3. Market Attractiveness Analysis
        10.3.1. By Country
        10.3.2. By Flavor
        10.3.3. By Application
        10.3.4. By Flavor Type
        10.3.5. By Product type
    10.4. Key Takeaways
11. Latin America Market Analysis 2019 to 2023 and Forecast 2024 to 2034, By Country
    11.1. Historical Market Size Value (US$ Million) & Volume (Tons) Trend Analysis By Market Taxonomy, 2019 to 2023
    11.2. Market Size Value (US$ Million) & Volume (Tons) Forecast By Market Taxonomy, 2024 to 2034
        11.2.1. By Country
            11.2.1.1. Brazil
            11.2.1.2. Mexico
            11.2.1.3. Rest of Latin America
        11.2.2. By Flavor
        11.2.3. By Application
        11.2.4. By Flavor Type
        11.2.5. By Product type
    11.3. Market Attractiveness Analysis
        11.3.1. By Country
        11.3.2. By Flavor
        11.3.3. By Application
        11.3.4. By Flavor Type
        11.3.5. By Product type
    11.4. Key Takeaways
12. Western Europe Market Analysis 2019 to 2023 and Forecast 2024 to 2034, By Country
    12.1. Historical Market Size Value (US$ Million) & Volume (Tons) Trend Analysis By Market Taxonomy, 2019 to 2023
    12.2. Market Size Value (US$ Million) & Volume (Tons) Forecast By Market Taxonomy, 2024 to 2034
        12.2.1. By Country
            12.2.1.1. Germany
            12.2.1.2. UK
            12.2.1.3. France
            12.2.1.4. Spain
            12.2.1.5. Italy
            12.2.1.6. Rest of Western Europe
        12.2.2. By Flavor
        12.2.3. By Application
        12.2.4. By Flavor Type
        12.2.5. By Product type
    12.3. Market Attractiveness Analysis
        12.3.1. By Country
        12.3.2. By Flavor
        12.3.3. By Application
        12.3.4. By Flavor Type
        12.3.5. By Product type
    12.4. Key Takeaways
13. Eastern Europe Market Analysis 2019 to 2023 and Forecast 2024 to 2034, By Country
    13.1. Historical Market Size Value (US$ Million) & Volume (Tons) Trend Analysis By Market Taxonomy, 2019 to 2023
    13.2. Market Size Value (US$ Million) & Volume (Tons) Forecast By Market Taxonomy, 2024 to 2034
        13.2.1. By Country
            13.2.1.1. Poland
            13.2.1.2. Russia
            13.2.1.3. Czech Republic
            13.2.1.4. Romania
            13.2.1.5. Rest of Eastern Europe
        13.2.2. By Flavor
        13.2.3. By Application
        13.2.4. By Flavor Type
        13.2.5. By Product type
    13.3. Market Attractiveness Analysis
        13.3.1. By Country
        13.3.2. By Flavor
        13.3.3. By Application
        13.3.4. By Flavor Type
        13.3.5. By Product type
    13.4. Key Takeaways
14. South Asia and Pacific Market Analysis 2019 to 2023 and Forecast 2024 to 2034, By Country
    14.1. Historical Market Size Value (US$ Million) & Volume (Tons) Trend Analysis By Market Taxonomy, 2019 to 2023
    14.2. Market Size Value (US$ Million) & Volume (Tons) Forecast By Market Taxonomy, 2024 to 2034
        14.2.1. By Country
            14.2.1.1. India
            14.2.1.2. Bangladesh
            14.2.1.3. Australia
            14.2.1.4. New Zealand
            14.2.1.5. Rest of South Asia and Pacific
        14.2.2. By Flavor
        14.2.3. By Application
        14.2.4. By Flavor Type
        14.2.5. By Product type
    14.3. Market Attractiveness Analysis
        14.3.1. By Country
        14.3.2. By Flavor
        14.3.3. By Application
        14.3.4. By Flavor Type
        14.3.5. By Product type
    14.4. Key Takeaways
15. East Asia Market Analysis 2019 to 2023 and Forecast 2024 to 2034, By Country
    15.1. Historical Market Size Value (US$ Million) & Volume (Tons) Trend Analysis By Market Taxonomy, 2019 to 2023
    15.2. Market Size Value (US$ Million) & Volume (Tons) Forecast By Market Taxonomy, 2024 to 2034
        15.2.1. By Country
            15.2.1.1. China
            15.2.1.2. Japan
            15.2.1.3. South Korea
        15.2.2. By Flavor
        15.2.3. By Application
        15.2.4. By Flavor Type
        15.2.5. By Product type
    15.3. Market Attractiveness Analysis
        15.3.1. By Country
        15.3.2. By Flavor
        15.3.3. By Application
        15.3.4. By Flavor Type
        15.3.5. By Product type
    15.4. Key Takeaways
16. Middle East and Africa Market Analysis 2019 to 2023 and Forecast 2024 to 2034, By Country
    16.1. Historical Market Size Value (US$ Million) & Volume (Tons) Trend Analysis By Market Taxonomy, 2019 to 2023
    16.2. Market Size Value (US$ Million) & Volume (Tons) Forecast By Market Taxonomy, 2024 to 2034
        16.2.1. By Country
            16.2.1.1. GCC Countries
            16.2.1.2. South Africa
            16.2.1.3. Israel
            16.2.1.4. Rest of MEA
        16.2.2. By Flavor
        16.2.3. By Application
        16.2.4. By Flavor Type
        16.2.5. By Product type
    16.3. Market Attractiveness Analysis
        16.3.1. By Country
        16.3.2. By Flavor
        16.3.3. By Application
        16.3.4. By Flavor Type
        16.3.5. By Product type
    16.4. Key Takeaways
17. Key Countries Market Analysis
    17.1. USA
        17.1.1. Pricing Analysis
        17.1.2. Market Share Analysis, 2023
            17.1.2.1. By Flavor
            17.1.2.2. By Application
            17.1.2.3. By Flavor Type
            17.1.2.4. By Product type
    17.2. Canada
        17.2.1. Pricing Analysis
        17.2.2. Market Share Analysis, 2023
            17.2.2.1. By Flavor
            17.2.2.2. By Application
            17.2.2.3. By Flavor Type
            17.2.2.4. By Product type
    17.3. Brazil
        17.3.1. Pricing Analysis
        17.3.2. Market Share Analysis, 2023
            17.3.2.1. By Flavor
            17.3.2.2. By Application
            17.3.2.3. By Flavor Type
            17.3.2.4. By Product type
    17.4. Mexico
        17.4.1. Pricing Analysis
        17.4.2. Market Share Analysis, 2023
            17.4.2.1. By Flavor
            17.4.2.2. By Application
            17.4.2.3. By Flavor Type
            17.4.2.4. By Product type
    17.5. Germany
        17.5.1. Pricing Analysis
        17.5.2. Market Share Analysis, 2023
            17.5.2.1. By Flavor
            17.5.2.2. By Application
            17.5.2.3. By Flavor Type
            17.5.2.4. By Product type
    17.6. UK
        17.6.1. Pricing Analysis
        17.6.2. Market Share Analysis, 2023
            17.6.2.1. By Flavor
            17.6.2.2. By Application
            17.6.2.3. By Flavor Type
            17.6.2.4. By Product type
    17.7. France
        17.7.1. Pricing Analysis
        17.7.2. Market Share Analysis, 2023
            17.7.2.1. By Flavor
            17.7.2.2. By Application
            17.7.2.3. By Flavor Type
            17.7.2.4. By Product type
    17.8. Spain
        17.8.1. Pricing Analysis
        17.8.2. Market Share Analysis, 2023
            17.8.2.1. By Flavor
            17.8.2.2. By Application
            17.8.2.3. By Flavor Type
            17.8.2.4. By Product type
    17.9. Italy
        17.9.1. Pricing Analysis
        17.9.2. Market Share Analysis, 2023
            17.9.2.1. By Flavor
            17.9.2.2. By Application
            17.9.2.3. By Flavor Type
            17.9.2.4. By Product type
    17.10. Poland
        17.10.1. Pricing Analysis
        17.10.2. Market Share Analysis, 2023
            17.10.2.1. By Flavor
            17.10.2.2. By Application
            17.10.2.3. By Flavor Type
            17.10.2.4. By Product type
    17.11. Russia
        17.11.1. Pricing Analysis
        17.11.2. Market Share Analysis, 2023
            17.11.2.1. By Flavor
            17.11.2.2. By Application
            17.11.2.3. By Flavor Type
            17.11.2.4. By Product type
    17.12. Czech Republic
        17.12.1. Pricing Analysis
        17.12.2. Market Share Analysis, 2023
            17.12.2.1. By Flavor
            17.12.2.2. By Application
            17.12.2.3. By Flavor Type
            17.12.2.4. By Product type
    17.13. Romania
        17.13.1. Pricing Analysis
        17.13.2. Market Share Analysis, 2023
            17.13.2.1. By Flavor
            17.13.2.2. By Application
            17.13.2.3. By Flavor Type
            17.13.2.4. By Product type
    17.14. India
        17.14.1. Pricing Analysis
        17.14.2. Market Share Analysis, 2023
            17.14.2.1. By Flavor
            17.14.2.2. By Application
            17.14.2.3. By Flavor Type
            17.14.2.4. By Product type
    17.15. Bangladesh
        17.15.1. Pricing Analysis
        17.15.2. Market Share Analysis, 2023
            17.15.2.1. By Flavor
            17.15.2.2. By Application
            17.15.2.3. By Flavor Type
            17.15.2.4. By Product type
    17.16. Australia
        17.16.1. Pricing Analysis
        17.16.2. Market Share Analysis, 2023
            17.16.2.1. By Flavor
            17.16.2.2. By Application
            17.16.2.3. By Flavor Type
            17.16.2.4. By Product type
    17.17. New Zealand
        17.17.1. Pricing Analysis
        17.17.2. Market Share Analysis, 2023
            17.17.2.1. By Flavor
            17.17.2.2. By Application
            17.17.2.3. By Flavor Type
            17.17.2.4. By Product type
    17.18. China
        17.18.1. Pricing Analysis
        17.18.2. Market Share Analysis, 2023
            17.18.2.1. By Flavor
            17.18.2.2. By Application
            17.18.2.3. By Flavor Type
            17.18.2.4. By Product type
    17.19. Japan
        17.19.1. Pricing Analysis
        17.19.2. Market Share Analysis, 2023
            17.19.2.1. By Flavor
            17.19.2.2. By Application
            17.19.2.3. By Flavor Type
            17.19.2.4. By Product type
    17.20. South Korea
        17.20.1. Pricing Analysis
        17.20.2. Market Share Analysis, 2023
            17.20.2.1. By Flavor
            17.20.2.2. By Application
            17.20.2.3. By Flavor Type
            17.20.2.4. By Product type
    17.21. GCC Countries
        17.21.1. Pricing Analysis
        17.21.2. Market Share Analysis, 2023
            17.21.2.1. By Flavor
            17.21.2.2. By Application
            17.21.2.3. By Flavor Type
            17.21.2.4. By Product type
    17.22. South Africa
        17.22.1. Pricing Analysis
        17.22.2. Market Share Analysis, 2023
            17.22.2.1. By Flavor
            17.22.2.2. By Application
            17.22.2.3. By Flavor Type
            17.22.2.4. By Product type
    17.23. Israel
        17.23.1. Pricing Analysis
        17.23.2. Market Share Analysis, 2023
            17.23.2.1. By Flavor
            17.23.2.2. By Application
            17.23.2.3. By Flavor Type
            17.23.2.4. By Product type
18. Market Structure Analysis
    18.1. Competition Dashboard
    18.2. Competition Benchmarking
    18.3. Market Share Analysis of Top Players
        18.3.1. By Regional
        18.3.2. By Flavor
        18.3.3. By Application
        18.3.4. By Flavor Type
        18.3.5. By Product type
19. Competition Analysis
    19.1. Competition Deep Dive
        19.1.1. Monin Inc.
            19.1.1.1. Overview
            19.1.1.2. Product Portfolio
            19.1.1.3. Profitability by Market Segments
            19.1.1.4. Sales Footprint
            19.1.1.5. Strategy Overview
                19.1.1.5.1. Marketing Strategy
                19.1.1.5.2. Product Strategy
                19.1.1.5.3. Channel Strategy
        19.1.2. Sensient Technologies
            19.1.2.1. Overview
            19.1.2.2. Product Portfolio
            19.1.2.3. Profitability by Market Segments
            19.1.2.4. Sales Footprint
            19.1.2.5. Strategy Overview
                19.1.2.5.1. Marketing Strategy
                19.1.2.5.2. Product Strategy
                19.1.2.5.3. Channel Strategy
        19.1.3. The Hershey Company
            19.1.3.1. Overview
            19.1.3.2. Product Portfolio
            19.1.3.3. Profitability by Market Segments
            19.1.3.4. Sales Footprint
            19.1.3.5. Strategy Overview
                19.1.3.5.1. Marketing Strategy
                19.1.3.5.2. Product Strategy
                19.1.3.5.3. Channel Strategy
        19.1.4. Tate & Lyle
            19.1.4.1. Overview
            19.1.4.2. Product Portfolio
            19.1.4.3. Profitability by Market Segments
            19.1.4.4. Sales Footprint
            19.1.4.5. Strategy Overview
                19.1.4.5.1. Marketing Strategy
                19.1.4.5.2. Product Strategy
                19.1.4.5.3. Channel Strategy
        19.1.5. Kerry Group
            19.1.5.1. Overview
            19.1.5.2. Product Portfolio
            19.1.5.3. Profitability by Market Segments
            19.1.5.4. Sales Footprint
            19.1.5.5. Strategy Overview
                19.1.5.5.1. Marketing Strategy
                19.1.5.5.2. Product Strategy
                19.1.5.5.3. Channel Strategy
        19.1.6. Fuerst Day Lawson
            19.1.6.1. Overview
            19.1.6.2. Product Portfolio
            19.1.6.3. Profitability by Market Segments
            19.1.6.4. Sales Footprint
            19.1.6.5. Strategy Overview
                19.1.6.5.1. Marketing Strategy
                19.1.6.5.2. Product Strategy
                19.1.6.5.3. Channel Strategy
        19.1.7. Toschi Vignola
            19.1.7.1. Overview
            19.1.7.2. Product Portfolio
            19.1.7.3. Profitability by Market Segments
            19.1.7.4. Sales Footprint
            19.1.7.5. Strategy Overview
                19.1.7.5.1. Marketing Strategy
                19.1.7.5.2. Product Strategy
                19.1.7.5.3. Channel Strategy
        19.1.8. R. Torre & Company
            19.1.8.1. Overview
            19.1.8.2. Product Portfolio
            19.1.8.3. Profitability by Market Segments
            19.1.8.4. Sales Footprint
            19.1.8.5. Strategy Overview
                19.1.8.5.1. Marketing Strategy
                19.1.8.5.2. Product Strategy
                19.1.8.5.3. Channel Strategy
        19.1.9. Concord Foods
            19.1.9.1. Overview
            19.1.9.2. Product Portfolio
            19.1.9.3. Profitability by Market Segments
            19.1.9.4. Sales Footprint
            19.1.9.5. Strategy Overview
                19.1.9.5.1. Marketing Strategy
                19.1.9.5.2. Product Strategy
                19.1.9.5.3. Channel Strategy
        19.1.10. Sensory Effects
            19.1.10.1. Overview
            19.1.10.2. Product Portfolio
            19.1.10.3. Profitability by Market Segments
            19.1.10.4. Sales Footprint
            19.1.10.5. Strategy Overview
                19.1.10.5.1. Marketing Strategy
                19.1.10.5.2. Product Strategy
                19.1.10.5.3. Channel Strategy
20. Assumptions & Acronyms Used
21. Research Methodology

Explore Food and Beverage Insights

View Reports
Future Market Insights

Flavored Syrup Market

Schedule a Call