Flavored Butter and Oils Market Forecast and Outlook 2025 to 2035

The flavored butter and oils market is valued at USD 564.1 million in 2025 and is poised to reach USD 1,049.0 million by 2035, reflecting a compound annual growth rate (CAGR) of 6.4% over the forecast period.
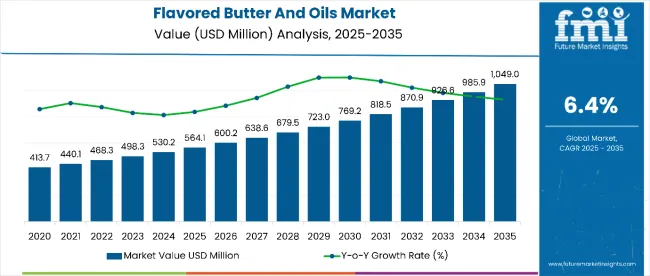
Quick Stats for Flavored Butter and Oils Market

  • Flavored Butter and Oils Market Value (2025): USD 564.1 million
  • Flavored Butter and Oils Market Forecast Value (2035): USD 1,049.0 million
  • Flavored Butter and Oils Market Forecast CAGR: 6.4%
  • Leading Segment in Flavored Butter and Oils Market 2025: Store-Based Retailing (75%)
  • Key Growth Regions in Flavored Butter and Oils Market: United Kingdom, North America, and Europe
  • Top Key Players in Flavored Butter and Oils Market: Kerrygold, Land O’ Lakes, Lurpak, Amul, Carrington Farms, Golden Barrel

Flavored Butter And Oils Market

Metric Value
Market Estimated Value in (2025E) USD 564.1 million
Market Forecast Value in (2035F) USD 1,049.0 million
Forecast CAGR (2025 to 2035) 6.4%

The market is projected to add an absolute dollar opportunity of USD 484.9 million, representing a 1.86-times growth during this time. This growth is driven by increasing consumer interest in gourmet cooking, premium ingredients, and natural flavor infusions. Rising culinary experimentation, health-oriented eating trends, and the influence of global cuisines are key factors fueling demand. Additionally, herb-flavored products, expected to hold a 35% market share, along with store-based retailing capturing 75% of sales in 2025, will play a significant role in shaping the market’s expansion.

By 2030, the market is likely to hit USD 769.2 million, generating USD 205.1 million in growth during the first half of the period. The second half is expected to add USD 279.8 million, signaling a faster expansion rate. Premiumization trends, greater awareness of herb-infused health benefits, and wider availability in retail will boost demand. Store-based channels will dominate, supported by product innovation, brand storytelling, and marketing strategies targeting flavor-conscious consumers.

Companies such as Kerrygold, Land O’ Lakes, and Lurpak are advancing their competitive positions through investments in herb-flavored product innovation, premium artisanal butter formulations, and expanded store-based retail presence. Growing consumer interest in gourmet cooking, health-conscious eating, and natural flavor infusions is driving demand for both traditional and plant-based options. Market performance remains anchored in responsible sourcing, clean-label production, and high-quality ingredients. Leading brands are focusing on product diversification, innovative flavor pairings, and strategic marketing campaigns to enhance visibility.

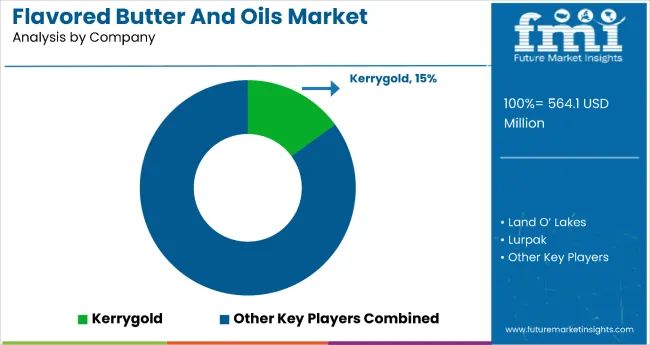
The market commands approximately 35% of the herb-flavored condiments segment, driven by consumer demand for culinary versatility and the health benefits of natural herbs. It accounts for around 75% of the store-based retail gourmet spreads category, supported by its strong placement in supermarkets, hypermarkets, and specialty stores. The market contributes nearly 15% to the global premium butter and oil brand segment through Kerrygold’s share, reflecting its leadership in artisanal, high-quality products.

The market is undergoing structural change as gourmet cooking, premiumization, and natural flavor infusions become mainstream trends. Advances in flavor formulation, sustainable sourcing, and premium packaging are enhancing consumer appeal while extending shelf life. Manufacturers are innovating with herb-infused, low-sodium, and plant-based varieties, catering to both traditional and health-conscious consumers. These products are expanding beyond core culinary uses into applications in hospitality, premium dining, and artisanal packaged foods, reinforcing their role as value-added, high-demand offerings in both mature and emerging markets.

Why is the Flavored Butter and Oils Market Growing?

The market is benefiting from rising consumer interest in gourmet cooking, artisanal flavors, and health-oriented eating. Herb-infused varieties, which combine rich taste with potential health benefits, are particularly appealing to consumers seeking premium and natural culinary products. Salted and herb-flavored options are gaining traction for their versatility in enhancing both home-cooked meals and professional recipes.

Growing awareness of clean-label, sustainably sourced ingredients is further boosting demand, especially through store-based retail channels, which account for the majority of sales. Lifestyle trends favoring home cooking, global flavor exploration, and premium dining experiences are driving adoption across multiple demographics.

As consumers seek high-quality, authentic flavors, manufacturers are innovating with plant-based, low-sodium, and functional varieties to meet evolving tastes. The market outlook remains favorable, supported by expanding retail distribution, premium packaging, and culinary partnerships. With strong growth in key markets such as the United Kingdom, United States, and Germany, flavored butter and oils are well-positioned to capture increasing demand in both traditional and emerging food categories.

Flavored Butter and Oils Market Analysis by Top Investment Segments

The market is segmented by product type, flavoring type, application, distribution channel, and region. By product type, the market is bifurcated into salted and unsalted. Based on flavoring type, the market is classified into herb, spices, roots, citrus, vegetable, and others (fruit-based flavors, floral infusions, nut-based flavors, and fusion blends). In terms of application, the market is divided into milk and dairy, bakery products, value-added food and beverages, dips and sauces, and blends and seasonings. By distribution channel, the market is segmented into store-based retailing, hypermarkets and supermarkets, convenience stores, specialty stores, discounters, forecourt retailers, and online-based retailing. Regionally, the market is classified into North America, Latin America, Western Europe, Eastern Europe, South Asia and Pacific, East Asia, and the Middle East and Africa.
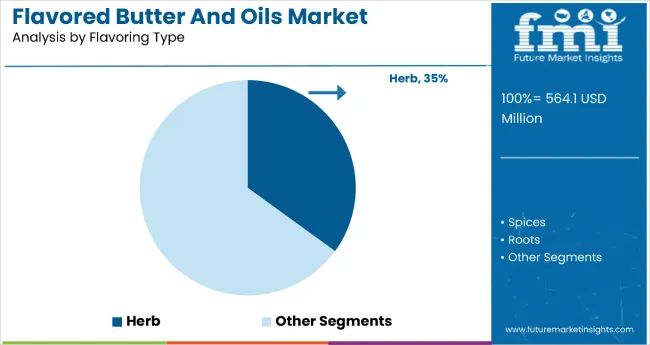
By Flavoring Type, Herb Segment Accounts for 35.0% of the Market Share in 2025

Flavored Butter And Oils Market By Flavouring

The herb-flavored segment, holding 35% of the flavored butter and oils market, stands out as the most lucrative due to its strong alignment with current consumer preferences for natural, clean-label, and health-oriented products. Popular herbs such as rosemary, basil, thyme, parsley, dill, and garlic offer versatile culinary applications, enhancing everything from bakery products to gourmet sauces and grilled dishes. This versatility drives consistent demand across both home cooking and foodservice sectors. Herb-infused products also benefit from the perception of added health value, as many herbs contain antioxidants and anti-inflammatory compounds, which resonates with health-conscious buyers seeking flavor without artificial additives.

Retail performance is particularly strong in store-based channels, which account for 75% of sales, where herb-flavored SKUs enjoy prime shelf placement and premium positioning. Manufacturers are leveraging this by introducing artisanal small-batch herb butters, chef-collaboration lines, and plant-based herb spreads to tap into vegan and flexitarian markets. Technological advances in infusion methods help maintain fresh herb aroma and taste while extending shelf life, making these products both indulgent and practical. With sustained innovation and strong cross-market appeal, the herb-flavored segment is poised to maintain its leadership position over the forecast period.
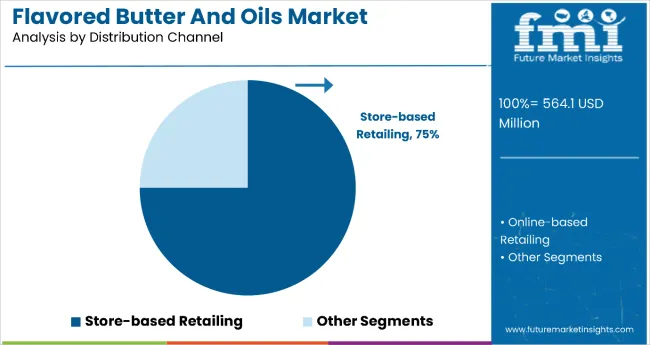
By Distribution Channel, Store-based Retailing Segment Accounts for 75.0% of the Market Share

Flavored Butter And Oils Market By Distribution

The store-based retailing segment is the largest distribution channel for flavored butter and oils, commanding 75% of total market sales in 2025. Its dominance stems from the sensory advantage of in-store shopping, where consumers can visually assess packaging, read ingredient labels, and, in some cases, participate in tasting or sampling events. Hypermarkets and supermarkets form the backbone of this channel. They provide broad product assortments, competitive pricing, and high product visibility through strategic shelf placement. Specialty stores add value by catering to gourmet and artisanal preferences, often featuring premium herb-infused or limited-edition variants.

Convenience stores further extend accessibility, offering smaller pack sizes suited for quick purchases. Store-based retailing benefits from established supply chains, robust brand promotions, and seasonal merchandising, making it particularly effective for driving impulse buys and trial of new flavors. Its ability to create immediate, tangible product experiences gives it a significant edge over online sales, ensuring its continued leadership position in the flavored butter and oils market throughout the forecast period.

What are the Drivers, Restraints, and Key Trends of the Flavored Butter and Oils Market?

From 2025 to 2035, food manufacturers are expected to introduce premium, chef-inspired flavored butter and oil products to cater to evolving consumer palates and demand for gourmet experiences at home. This shift positions producers offering herb-infused, spice-blended, and artisanal flavor profiles as key players in enhancing taste diversity across multiple food categories.

Growth Inhibitors in the Flavored Butter and Oils Sector

The market faces notable restraints, particularly the high production costs associated with sourcing premium, natural herbs and spices, which can limit penetration among price-sensitive consumers. Seasonal variability in raw material availability especially fresh herbs can disrupt supply chains and impact consistent production. Additionally, regulatory restrictions on labeling and claims for natural or organic products may slow market entry for new formulations. Competition from lower-priced synthetic flavor alternatives can also challenge premium positioning.

Emerging Trends Driving the Flavored Butter and Oils Market

The market includes the rapid rise of clean-label, organic, and minimally processed formulations to meet growing health-conscious consumer demand. Herb-flavored variants, holding 35% of the market in 2025, are gaining popularity due to their perceived wellness benefits and culinary versatility. Brands are expanding beyond traditional spreads into bakery, dairy, dips, sauces, and gourmet ready-to-eat products. Innovative flavor infusion methods are improving shelf life while preserving natural taste and aroma. Responsible production is emerging as a differentiator, with eco-friendly packaging and ethically sourced ingredients appealing to conscious buyers.
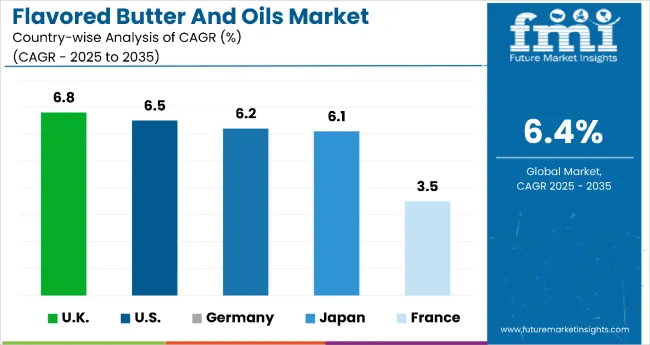
Analysis of Flavored Butter and Oils Market by Key Countries

Flavored Butter And Oils Market By Country

Countries CAGR
UK 6.8%
USA 6.5%
Germany 6.2%
Japan 6.1%
France 3.5%

The UK leads the market with the highest CAGR of 6.8%, driven by strong consumer demand for premium herb-infused products and expanding bakery and dairy applications. The US follows closely with a 6.5% CAGR, supported by large-scale production, clean-label trends, and extensive distribution through hypermarkets and e-commerce. Germany’s market grows steadily at 6.2%, reflecting strong adoption of organic and sustainable practices alongside expanding bakery uses. Japan, with a 6.1% CAGR, benefits from culinary innovation and a robust presence in convenience and specialty stores, emphasizing artisanal and natural ingredients. France exhibits a more moderate growth rate of 3.5%, consistent with its mature gourmet market, focusing on niche artisanal products and steady demand for organic and natural flavors.

The report covers an in-depth analysis of 40+ countries; five top-performing OECD countries are highlighted below.

Production Capacity Trends in Flavored Butter and Oils Market in the UK

The UK flavored butter and oils market is expanding rapidly with a CAGR of 6.8%, fueled by increasing consumer demand for premium, herb-infused products. The production capacity is growing as manufacturers invest in advanced processing to meet the rising health-conscious consumer base. The bakery and dairy sectors lead product adoption, supported by expanding store-based retailing channels. Organic and natural flavor variants gain popularity, driving innovation in production techniques. Local brands focus on sustainable sourcing and clean-label offerings to maintain competitiveness. Retailers are enhancing shelf presence to cater to growing demand. The market shows strong potential for value-added flavored butter products.
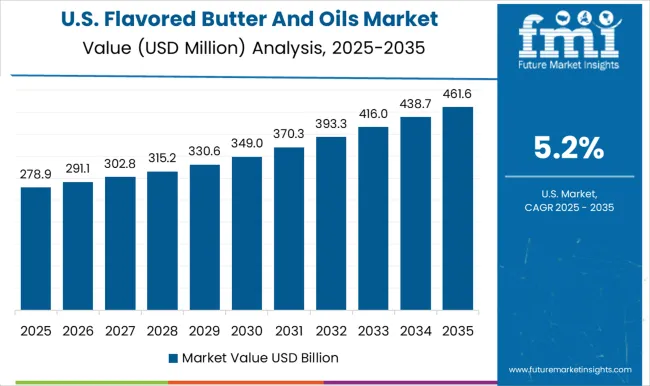
  • Increasing demand in bakery and value-added food applications.
  • Consumers opting for organic and natural flavorings.
  • Major local brands innovating in herb-infused butter products.

Output Expansion in Flavored Butter and Oils Market in the United States

The USA flavored butter and oils revenue is witnessing robust output expansion with a CAGR of 6.5%. High consumer preference for clean-label, herb-flavored variants propels production growth. Large-scale manufacturers are scaling operations to meet rising demand across bakery, dairy, and functional food sectors. E-commerce and hypermarket distribution channels are significantly improving product accessibility. Innovation in flavor profiles and organic certifications strengthens market positioning. Producers focus on sustainability and health trends, contributing to market resilience. The US market is expected to see continual growth through product diversification and wider retail penetration.
  • Increasing use in dips, sauces, and bakery products.
  • Growing demand for clean-label and organic products.
  • Large-scale distribution through hypermarkets and supermarkets.

Structural Adoption in Flavored Butter and Oils Market in Germany

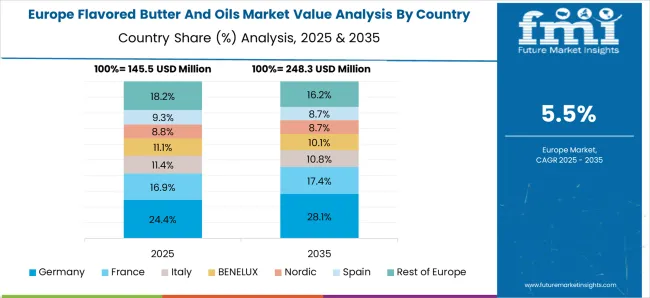
Revenue from flavored butter and oils in Germany is growing steadily at a CAGR of 6.2%, driven by structural adoption of natural and organic products. Production capacity is increasing to cater to consumer demand for herb and spice-flavored butter, especially in bakery and value-added food applications. Sustainable farming and eco-friendly manufacturing practices are being widely embraced. Retailers, especially specialty and convenience stores, play a crucial role in market expansion. Consumers show strong preference for products with clean labels and functional benefits. This structural shift is prompting manufacturers to upgrade facilities and innovate product lines. The market reflects a mature yet dynamic growth pattern.
  • High consumer preference for organic and herb-flavored oils.
  • Growing penetration of flavored butter in bakery applications.
  • Government support for sustainable agricultural practices.

Manufacturing Capacity Growth in Flavored Butter and Oils Market in Japan

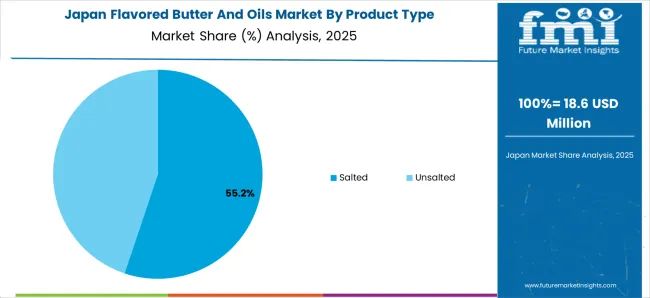
Sales of flavored butter and oils in Japan are expanding production capacity at a CAGR of 6.1%, supported by rising consumer interest in unique herb and spice blends. Culinary experimentation and demand for premium, value-added products encourage manufacturers to increase output. Convenience stores and specialty outlets dominate the distribution landscape, facilitating easy product access. There is growing emphasis on artisanal and high-quality products with natural ingredients. Producers are investing in innovative processing techniques to enhance flavor retention and shelf life. Consumer trends toward health and wellness continue to shape production strategies. The market shows strong prospects for innovation-led growth.

  • Rising culinary trends driving new flavor innovations.
  • Strong retail presence in convenience and specialty stores.
  • Growing consumer interest in functional and natural ingredients.

Production Scale Trends in Flavored Butter and Oils Market in France

Demand for flavored butter and oils in France demonstrates moderate output growth with a CAGR of 3.5%, aligned with its mature gourmet food culture. Production focuses on premium herb-flavored butters and oils catering to niche artisanal and specialty segments. Though growth is slower, demand for organic and clean-label products remains steady. Farmers’ markets and specialty stores serve as key distribution channels, emphasizing local and sustainable production. Manufacturers maintain focus on quality, flavor authenticity, and traditional methods. Market trends indicate gradual expansion supported by consumer preference for natural, health-oriented products. Output growth is steady, reflecting a well-established market base.
  • Established gourmet and artisanal butter market.
  • Preference for natural herb and spice flavors.
  • Specialty stores and farmer’s markets as key channels.

Competitive Landscape of Flavored Butter and Oils Market

Flavored Butter And Oils Market By Company

The market is moderately consolidated, dominated by key players specializing in flavor innovation, quality, and sustainable sourcing. Kerrygold leads with a 15% market share, leveraging its strong brand reputation and focus on premium, herb-infused products. Major manufacturers invest heavily in advanced processing technologies to ensure consistent flavor profiles and extended shelf life. Regional players emphasize local ingredient sourcing and cater to niche consumer preferences for organic and natural flavor variants.

Retail giants and specialty food producers are expanding product portfolios to include innovative blends, targeting bakery, dairy, and value-added food sectors. Sustainability and clean-label trends are driving product development and differentiation. Entry barriers include maintaining high-quality flavor extraction, meeting stringent food safety regulations, and responding swiftly to evolving consumer tastes. Competitiveness is shaped by innovation in flavor formulations, adherence to organic certifications, and strong distribution networks across store-based and online retail channels.

Scope of the Report - Flavored Butter and Oils Market

Item Value
Quantitative Units USD 564.1 Million
Product Type Salted and Unsalted
Flavoring Type Herb, Spices, Roots, Citrus, Vegetable, and Others (Floral, Nutty, Smoky, and Exotic Fruit Flavors)
Application Bakery Products, Milk and Dairy, Value-added Food and Beverages, Dips and Sauces, Blends and Seasonings
Regions Covered North America, Europe, Asia-Pacific, Latin America, Middle East and Africa
Country Covered United States, Canada, Germany, France, United Kingdom, China, Japan, India, Brazil, South Africa, Australia and 40+ countries
Key Companies Profiled Land O’ Lakes, Lurpak, Kerrygold, Amul, Carrington Farms, Golden Barrel, Butter Buds Inc, Mainland, Arla Foods amba
Additional Attributes Market share by source and application, growing demand for natural and organic flavors, store-based retail share, rising bakery and dairy usage, flavor infusion innovations, sustainable sourcing, expanding online sales, and focus on clean-label premium herb products.

Key Segments

By Product Type:

  • Salted
  • Unsalted

By Flavoring Type:

  • Herb
  • Spices
  • Roots
  • Citrus
  • Vegetable
  • Others

By Application:

  • Milk and Dairy
  • Bakery Products
  • Value-added Food & Beverages
  • Dips & Sauces
  • Blends & Seasonings

By Distribution Channel:

  • Store-based Retailing
  • Hypermarkets and Supermarkets
  • Convenience Stores
  • Specialty Stores
  • Discounters
  • Forecourt Retailers
  • Online-based Retailing

Table of Content

  1. Executive Summary
    • Global Market Outlook
    • Demand-side Trends
    • Supply-side Trends
    • Technology Roadmap Analysis
    • Analysis and Recommendations
  2. Market Overview
    • Market Coverage / Taxonomy
    • Market Definition / Scope / Limitations
  3. Market Background
    • Market Dynamics
      • Drivers
      • Restraints
      • Opportunity
      • Trends
    • Scenario Forecast
      • Demand in Optimistic Scenario
      • Demand in Likely Scenario
      • Demand in Conservative Scenario
    • Opportunity Map Analysis
    • Product Life Cycle Analysis
    • Supply Chain Analysis
      • Supply Side Participants and their Roles
        • Producers
        • Mid-Level Participants (Traders/ Agents/ Brokers)
        • Wholesalers and Distributors
      • Value Added and Value Created at Node in the Supply Chain
      • List of Raw Material Suppliers
      • List of Existing and Potential Buyer’s
    • Investment Feasibility Matrix
    • Value Chain Analysis
      • Profit Margin Analysis
      • Wholesalers and Distributors
      • Retailers
    • PESTLE and Porter’s Analysis
    • Regulatory Landscape
      • By Key Regions
      • By Key Countries
    • Regional Parent Market Outlook
    • Production and Consumption Statistics
    • Import and Export Statistics
  4. Global Market Analysis 2020 to 2024 and Forecast, 2025 to 2035
    • Historical Market Size Value (USD Million) & Volume (Kilotons) Analysis, 2020 to 2024
    • Current and Future Market Size Value (USD Million) & Volume (Kilotons) Projections, 2025 to 2035
      • Y-o-Y Growth Trend Analysis
      • Absolute $ Opportunity Analysis
  5. Global Market Pricing Analysis 2020 to 2024 and Forecast 2025 to 2035
  6. Global Market Analysis 2020 to 2024 and Forecast 2025 to 2035, By Product Type
    • Introduction / Key Findings
    • Historical Market Size Value (USD Million) & Volume (Kilotons) Analysis By Product Type, 2020 to 2024
    • Current and Future Market Size Value (USD Million) & Volume (Kilotons) Analysis and Forecast By Product Type, 2025 to 2035
      • Salted
      • Unsalted
    • Y-o-Y Growth Trend Analysis By Product Type, 2020 to 2024
    • Absolute $ Opportunity Analysis By Product Type, 2025 to 2035
  7. Global Market Analysis 2020 to 2024 and Forecast 2025 to 2035, By Flavoring Type
    • Introduction / Key Findings
    • Historical Market Size Value (USD Million) & Volume (Kilotons) Analysis By Flavoring Type, 2020 to 2024
    • Current and Future Market Size Value (USD Million) & Volume (Kilotons) Analysis and Forecast By Flavoring Type, 2025 to 2035
      • Herb
      • Spices
      • Roots
      • Citrus
      • Vegetable
      • Others (Floral, Nutty, Smoky, and Exotic Fruit Flavors)
    • Y-o-Y Growth Trend Analysis By Flavoring Type, 2020 to 2024
    • Absolute $ Opportunity Analysis By Flavoring Type, 2025 to 2035
  8. Global Market Analysis 2020 to 2024 and Forecast 2025 to 2035, By Application
    • Introduction / Key Findings
    • Historical Market Size Value (USD Million) & Volume (Kilotons) Analysis By Application, 2020 to 2024
    • Current and Future Market Size Value (USD Million) & Volume (Kilotons) Analysis and Forecast By Application, 2025 to 2035
      • Milk and Dairy
      • Bakery Products
      • Value-added Food & Beverages
      • Dips & Sauces
      • Blends & Seasonings
    • Y-o-Y Growth Trend Analysis By Application, 2020 to 2024
    • Absolute $ Opportunity Analysis By Application, 2025 to 2035
  9. Global Market Analysis 2020 to 2024 and Forecast 2025 to 2035, By Distribution Channel
    • Introduction / Key Findings
    • Historical Market Size Value (USD Million) & Volume (Kilotons) Analysis By Distribution Channel, 2020 to 2024
    • Current and Future Market Size Value (USD Million) & Volume (Kilotons) Analysis and Forecast By Distribution Channel, 2025 to 2035
      • Store-based Retailing
      • Hypermarkets and Supermarkets
      • Convenience Stores
      • Specialty Stores
      • Discounters
      • Forecourt Retailers
      • Online-based Retailing
    • Y-o-Y Growth Trend Analysis By Distribution Channel, 2020 to 2024
    • Absolute $ Opportunity Analysis By Distribution Channel, 2025 to 2035
  10. Global Market Analysis 2020 to 2024 and Forecast 2025 to 2035, By Region
    • Introduction
    • Historical Market Size Value (USD Million) & Volume (Kilotons) Analysis By Region, 2020 to 2024
    • Current Market Size Value (USD Million) & Volume (Kilotons) Analysis and Forecast By Region, 2025 to 2035
      • North America
      • Latin America
      • Western Europe
      • Eastern Europe
      • East Asia
      • South Asia & Pacific
      • Middle East and Africa
    • Market Attractiveness Analysis By Region
  11. North America Market Analysis 2020 to 2024 and Forecast 2025 to 2035, By Country
    • Historical Market Size Value (USD Million) & Volume (Kilotons) Trend Analysis By Market Taxonomy, 2020 to 2024
    • Market Size Value (USD Million) & Volume (Kilotons) Forecast By Market Taxonomy, 2025 to 2035
      • By Country
        • USA
        • Canada
        • Mexico
      • By Product Type
      • By Flavoring Type
      • By Application
      • By Distribution Channel
    • Market Attractiveness Analysis
      • By Country
      • By Product Type
      • By Flavoring Type
      • By Application
      • By Distribution Channel
    • Key Takeaways
  12. Latin America Market Analysis 2020 to 2024 and Forecast 2025 to 2035, By Country
    • Historical Market Size Value (USD Million) & Volume (Kilotons) Trend Analysis By Market Taxonomy, 2020 to 2024
    • Market Size Value (USD Million) & Volume (Kilotons) Forecast By Market Taxonomy, 2025 to 2035
      • By Country
        • Brazil
        • Argentina
        • Rest of LATAM
      • By Product Type
      • By Flavoring Type
      • By Application
      • By Distribution Channel
    • Market Attractiveness Analysis
      • By Country
      • By Product Type
      • By Flavoring Type
      • By Application
      • By Distribution Channel
    • Key Takeaways
  13. Western Europe Market Analysis 2020 to 2024 and Forecast 2025 to 2035, By Country
    • Historical Market Size Value (USD Million) & Volume (Kilotons) Trend Analysis By Market Taxonomy, 2020 to 2024
    • Market Size Value (USD Million) & Volume (Kilotons) Forecast By Market Taxonomy, 2025 to 2035
      • By Country
        • Germany
        • Italy
        • France
        • UK
        • Spain
        • BENELUX
        • Nordic
        • Rest of W.Europe
      • By Product Type
      • By Flavoring Type
      • By Application
      • By Distribution Channel
    • Market Attractiveness Analysis
      • By Country
      • By Product Type
      • By Flavoring Type
      • By Application
      • By Distribution Channel
    • Key Takeaways
  14. Eastern Europe Market Analysis 2020 to 2024 and Forecast 2025 to 2035, By Country
    • Historical Market Size Value (USD Million) & Volume (Kilotons) Trend Analysis By Market Taxonomy, 2020 to 2024
    • Market Size Value (USD Million) & Volume (Kilotons) Forecast By Market Taxonomy, 2025 to 2035
      • By Country
        • Russia
        • Hungary
        • Poland
        • Balkan & Baltics
        • Rest of E. Europe
      • By Product Type
      • By Flavoring Type
      • By Application
      • By Distribution Channel
    • Market Attractiveness Analysis
      • By Country
      • By Product Type
      • By Flavoring Type
      • By Application
      • By Distribution Channel
    • Key Takeaways
  15. East Asia Market Analysis 2020 to 2024 and Forecast 2025 to 2035, By Country
    • Historical Market Size Value (USD Million) & Volume (Kilotons) Trend Analysis By Market Taxonomy, 2020 to 2024
    • Market Size Value (USD Million) & Volume (Kilotons) Forecast By Market Taxonomy, 2025 to 2035
      • By Country
        • China
        • Japan
        • South Korea
      • By Product Type
      • By Flavoring Type
      • By Application
      • By Distribution Channel
    • Market Attractiveness Analysis
      • By Country
      • By Product Type
      • By Flavoring Type
      • By Application
      • By Distribution Channel
    • Key Takeaways
  16. South Asia & Pacific Market Analysis 2020 to 2024 and Forecast 2025 to 2035, By Country
    • Historical Market Size Value (USD Million) & Volume (Kilotons) Trend Analysis By Market Taxonomy, 2020 to 2024
    • Market Size Value (USD Million) & Volume (Kilotons) Forecast By Market Taxonomy, 2025 to 2035
      • By Country
        • India
        • Australia & New Zealand
        • ASEAN
        • Rest of SAP
      • By Product Type
      • By Flavoring Type
      • By Application
      • By Distribution Channel
    • Market Attractiveness Analysis
      • By Country
      • By Product Type
      • By Flavoring Type
      • By Application
      • By Distribution Channel
    • Key Takeaways
  17. Middle East and Africa Market Analysis 2020 to 2024 and Forecast 2025 to 2035, By Country
    • Historical Market Size Value (USD Million) & Volume (Kilotons) Trend Analysis By Market Taxonomy, 2020 to 2024
    • Market Size Value (USD Million) & Volume (Kilotons) Forecast By Market Taxonomy, 2025 to 2035
      • By Country
        • GCC Countries
        • Northern Africa
        • South Africa
        • Turkiye
        • Rest of MEA
      • By Product Type
      • By Flavoring Type
      • By Application
      • By Distribution Channel
    • Market Attractiveness Analysis
      • By Country
      • By Product Type
      • By Flavoring Type
      • By Application
      • By Distribution Channel
    • Key Takeaways
  18. Key Countries Market Analysis
    • USA
      • Pricing Analysis
      • Market Share Analysis, 2024
        • By Product Type
        • By Flavoring Type
        • By Application
        • By Distribution Channel
    • Canada
      • Pricing Analysis
      • Market Share Analysis, 2024
        • By Product Type
        • By Flavoring Type
        • By Application
        • By Distribution Channel
    • Brazil
      • Pricing Analysis
      • Market Share Analysis, 2024
        • By Product Type
        • By Flavoring Type
        • By Application
        • By Distribution Channel
    • Mexico
      • Pricing Analysis
      • Market Share Analysis, 2024
        • By Product Type
        • By Flavoring Type
        • By Application
        • By Distribution Channel
    • Argentina
      • Pricing Analysis
      • Market Share Analysis, 2024
        • By Product Type
        • By Flavoring Type
        • By Application
        • By Distribution Channel
  19. Market Structure Analysis
    • Competition Dashboard
    • Competition Benchmarking
    • Market Share Analysis of Top Players
      • By Regional
      • By Product Type
      • By Flavoring Type
      • By Application
      • By Distribution Channel
  20. Competition Analysis
    • Competition Deep Dive
      • Land O’ Lakes
        • Overview
        • Product Portfolio
        • Profitability by Market Segments (Product/Age /Sales Channel/Region)
        • Sales Footprint
        • Strategy Overview
          • Marketing Strategy
          • Product Strategy
          • Channel Strategy
      • Lurpak
        • Overview
        • Product Portfolio
        • Profitability by Market Segments (Product/Age /Sales Channel/Region)
        • Sales Footprint
        • Strategy Overview
          • Marketing Strategy
          • Product Strategy
          • Channel Strategy
      • Kerrygold
        • Overview
        • Product Portfolio
        • Profitability by Market Segments (Product/Age /Sales Channel/Region)
        • Sales Footprint
        • Strategy Overview
          • Marketing Strategy
          • Product Strategy
          • Channel Strategy
      • Amul
        • Overview
        • Product Portfolio
        • Profitability by Market Segments (Product/Age /Sales Channel/Region)
        • Sales Footprint
        • Strategy Overview
          • Marketing Strategy
          • Product Strategy
          • Channel Strategy
      • Carrington Farms
        • Overview
        • Product Portfolio
        • Profitability by Market Segments (Product/Age /Sales Channel/Region)
        • Sales Footprint
        • Strategy Overview
          • Marketing Strategy
          • Product Strategy
          • Channel Strategy
      • Golden Barrel
        • Overview
        • Product Portfolio
        • Profitability by Market Segments (Product/Age /Sales Channel/Region)
        • Sales Footprint
        • Strategy Overview
          • Marketing Strategy
          • Product Strategy
          • Channel Strategy
      • Butter Buds Inc
        • Overview
        • Product Portfolio
        • Profitability by Market Segments (Product/Age /Sales Channel/Region)
        • Sales Footprint
        • Strategy Overview
          • Marketing Strategy
          • Product Strategy
          • Channel Strategy
      • Mainland
        • Overview
        • Product Portfolio
        • Profitability by Market Segments (Product/Age /Sales Channel/Region)
        • Sales Footprint
        • Strategy Overview
          • Marketing Strategy
          • Product Strategy
          • Channel Strategy
      • Arla Foods amba
        • Overview
        • Product Portfolio
        • Profitability by Market Segments (Product/Age /Sales Channel/Region)
        • Sales Footprint
        • Strategy Overview
          • Marketing Strategy
          • Product Strategy
          • Channel Strategy
      • Tatua
        • Overview
        • Product Portfolio
        • Profitability by Market Segments (Product/Age /Sales Channel/Region)
        • Sales Footprint
        • Strategy Overview
          • Marketing Strategy
          • Product Strategy
          • Channel Strategy
  21. Assumptions & Acronyms Used
  22. Research Methodology

List of Tables

  • Table 1: Global Market Value (USD Million) Forecast by Region, 2020-2035
  • Table 2: Global Market Volume (Kilotons) Forecast by Region, 2020-2035
  • Table 3: Global Market Value (USD Million) Forecast by Product Type, 2020-2035
  • Table 4: Global Market Volume (Kilotons) Forecast by Product Type, 2020-2035
  • Table 5: Global Market Value (USD Million) Forecast by Flavoring Type, 2020-2035
  • Table 6: Global Market Volume (Kilotons) Forecast by Flavoring Type, 2020-2035
  • Table 7: Global Market Value (USD Million) Forecast by Application, 2020-2035
  • Table 8: Global Market Volume (Kilotons) Forecast by Application, 2020-2035
  • Table 9: Global Market Value (USD Million) Forecast by Distribution Channel, 2020-2035
  • Table 10: Global Market Volume (Kilotons) Forecast by Distribution Channel, 2020-2035
  • Table 11: North America Market Value (USD Million) Forecast by Country, 2020-2035
  • Table 12: North America Market Volume (Kilotons) Forecast by Country, 2020-2035
  • Table 13: North America Market Value (USD Million) Forecast by Product Type, 2020-2035
  • Table 14: North America Market Volume (Kilotons) Forecast by Product Type, 2020-2035
  • Table 15: North America Market Value (USD Million) Forecast by Flavoring Type, 2020-2035
  • Table 16: North America Market Volume (Kilotons) Forecast by Flavoring Type, 2020-2035
  • Table 17: North America Market Value (USD Million) Forecast by Application, 2020-2035
  • Table 18: North America Market Volume (Kilotons) Forecast by Application, 2020-2035
  • Table 19: North America Market Value (USD Million) Forecast by Distribution Channel, 2020-2035
  • Table 20: North America Market Volume (Kilotons) Forecast by Distribution Channel, 2020-2035
  • Table 21: Latin America Market Value (USD Million) Forecast by Country, 2020-2035
  • Table 22: Latin America Market Volume (Kilotons) Forecast by Country, 2020-2035
  • Table 23: Latin America Market Value (USD Million) Forecast by Product Type, 2020-2035
  • Table 24: Latin America Market Volume (Kilotons) Forecast by Product Type, 2020-2035
  • Table 25: Latin America Market Value (USD Million) Forecast by Flavoring Type, 2020-2035
  • Table 26: Latin America Market Volume (Kilotons) Forecast by Flavoring Type, 2020-2035
  • Table 27: Latin America Market Value (USD Million) Forecast by Application, 2020-2035
  • Table 28: Latin America Market Volume (Kilotons) Forecast by Application, 2020-2035
  • Table 29: Latin America Market Value (USD Million) Forecast by Distribution Channel, 2020-2035
  • Table 30: Latin America Market Volume (Kilotons) Forecast by Distribution Channel, 2020-2035
  • Table 31: Western Europe Market Value (USD Million) Forecast by Country, 2020-2035
  • Table 32: Western Europe Market Volume (Kilotons) Forecast by Country, 2020-2035
  • Table 33: Western Europe Market Value (USD Million) Forecast by Product Type, 2020-2035
  • Table 34: Western Europe Market Volume (Kilotons) Forecast by Product Type, 2020-2035
  • Table 35: Western Europe Market Value (USD Million) Forecast by Flavoring Type, 2020-2035
  • Table 36: Western Europe Market Volume (Kilotons) Forecast by Flavoring Type, 2020-2035
  • Table 37: Western Europe Market Value (USD Million) Forecast by Application, 2020-2035
  • Table 38: Western Europe Market Volume (Kilotons) Forecast by Application, 2020-2035
  • Table 39: Western Europe Market Value (USD Million) Forecast by Distribution Channel, 2020-2035
  • Table 40: Western Europe Market Volume (Kilotons) Forecast by Distribution Channel, 2020-2035
  • Table 41: Eastern Europe Market Value (USD Million) Forecast by Country, 2020-2035
  • Table 42: Eastern Europe Market Volume (Kilotons) Forecast by Country, 2020-2035
  • Table 43: Eastern Europe Market Value (USD Million) Forecast by Product Type, 2020-2035
  • Table 44: Eastern Europe Market Volume (Kilotons) Forecast by Product Type, 2020-2035
  • Table 45: Eastern Europe Market Value (USD Million) Forecast by Flavoring Type, 2020-2035
  • Table 46: Eastern Europe Market Volume (Kilotons) Forecast by Flavoring Type, 2020-2035
  • Table 47: Eastern Europe Market Value (USD Million) Forecast by Application, 2020-2035
  • Table 48: Eastern Europe Market Volume (Kilotons) Forecast by Application, 2020-2035
  • Table 49: Eastern Europe Market Value (USD Million) Forecast by Distribution Channel, 2020-2035
  • Table 50: Eastern Europe Market Volume (Kilotons) Forecast by Distribution Channel, 2020-2035
  • Table 51: East Asia Market Value (USD Million) Forecast by Country, 2020-2035
  • Table 52: East Asia Market Volume (Kilotons) Forecast by Country, 2020-2035
  • Table 53: East Asia Market Value (USD Million) Forecast by Product Type, 2020-2035
  • Table 54: East Asia Market Volume (Kilotons) Forecast by Product Type, 2020-2035
  • Table 55: East Asia Market Value (USD Million) Forecast by Flavoring Type, 2020-2035
  • Table 56: East Asia Market Volume (Kilotons) Forecast by Flavoring Type, 2020-2035
  • Table 57: East Asia Market Value (USD Million) Forecast by Application, 2020-2035
  • Table 58: East Asia Market Volume (Kilotons) Forecast by Application, 2020-2035
  • Table 59: East Asia Market Value (USD Million) Forecast by Distribution Channel, 2020-2035
  • Table 60: East Asia Market Volume (Kilotons) Forecast by Distribution Channel, 2020-2035
  • Table 61: South Asia & Pacific Market Value (USD Million) Forecast by Country, 2020-2035
  • Table 62: South Asia & Pacific Market Volume (Kilotons) Forecast by Country, 2020-2035
  • Table 63: South Asia & Pacific Market Value (USD Million) Forecast by Product Type, 2020-2035
  • Table 64: South Asia & Pacific Market Volume (Kilotons) Forecast by Product Type, 2020-2035
  • Table 65: South Asia & Pacific Market Value (USD Million) Forecast by Flavoring Type, 2020-2035
  • Table 66: South Asia & Pacific Market Volume (Kilotons) Forecast by Flavoring Type, 2020-2035
  • Table 67: South Asia & Pacific Market Value (USD Million) Forecast by Application, 2020-2035
  • Table 68: South Asia & Pacific Market Volume (Kilotons) Forecast by Application, 2020-2035
  • Table 69: South Asia & Pacific Market Value (USD Million) Forecast by Distribution Channel, 2020-2035
  • Table 70: South Asia & Pacific Market Volume (Kilotons) Forecast by Distribution Channel, 2020-2035
  • Table 71: Middle East and Africa Market Value (USD Million) Forecast by Country, 2020-2035
  • Table 72: Middle East and Africa Market Volume (Kilotons) Forecast by Country, 2020-2035
  • Table 73: Middle East and Africa Market Value (USD Million) Forecast by Product Type, 2020-2035
  • Table 74: Middle East and Africa Market Volume (Kilotons) Forecast by Product Type, 2020-2035
  • Table 75: Middle East and Africa Market Value (USD Million) Forecast by Flavoring Type, 2020-2035
  • Table 76: Middle East and Africa Market Volume (Kilotons) Forecast by Flavoring Type, 2020-2035
  • Table 77: Middle East and Africa Market Value (USD Million) Forecast by Application, 2020-2035
  • Table 78: Middle East and Africa Market Volume (Kilotons) Forecast by Application, 2020-2035
  • Table 79: Middle East and Africa Market Value (USD Million) Forecast by Distribution Channel, 2020-2035
  • Table 80: Middle East and Africa Market Volume (Kilotons) Forecast by Distribution Channel, 2020-2035

List of Figures

  • Figure 1: Global Market Volume (Kilotons) Forecast 2020-2035
  • Figure 2: Global Market Pricing Analysis
  • Figure 3: Global Market Value (USD Million) Forecast 2020-2035
  • Figure 4: Global Market Value Share and BPS Analysis by Product Type, 2025 and 2035
  • Figure 5: Global Market Y-o-Y Growth Comparison by Product Type, 2025-2035
  • Figure 6: Global Market Attractiveness Analysis by Product Type
  • Figure 7: Global Market Value Share and BPS Analysis by Flavoring Type, 2025 and 2035
  • Figure 8: Global Market Y-o-Y Growth Comparison by Flavoring Type, 2025-2035
  • Figure 9: Global Market Attractiveness Analysis by Flavoring Type
  • Figure 10: Global Market Value Share and BPS Analysis by Application, 2025 and 2035
  • Figure 11: Global Market Y-o-Y Growth Comparison by Application, 2025-2035
  • Figure 12: Global Market Attractiveness Analysis by Application
  • Figure 13: Global Market Value Share and BPS Analysis by Distribution Channel, 2025 and 2035
  • Figure 14: Global Market Y-o-Y Growth Comparison by Distribution Channel, 2025-2035
  • Figure 15: Global Market Attractiveness Analysis by Distribution Channel
  • Figure 16: Global Market Value (USD Million) Share and BPS Analysis by Region, 2025 and 2035
  • Figure 17: Global Market Y-o-Y Growth Comparison by Region, 2025-2035
  • Figure 18: Global Market Attractiveness Analysis by Region
  • Figure 19: North America Market Incremental $ Opportunity, 2025-2035
  • Figure 20: Latin America Market Incremental $ Opportunity, 2025-2035
  • Figure 21: Western Europe Market Incremental $ Opportunity, 2025-2035
  • Figure 22: Eastern Europe Market Incremental $ Opportunity, 2025-2035
  • Figure 23: East Asia Market Incremental $ Opportunity, 2025-2035
  • Figure 24: South Asia & Pacific Market Incremental $ Opportunity, 2025-2035
  • Figure 25: Middle East and Africa Market Incremental $ Opportunity, 2025-2035
  • Figure 26: North America Market Value Share and BPS Analysis by Country, 2025 and 2035
  • Figure 27: North America Market Value Share and BPS Analysis by Product Type, 2025 and 2035
  • Figure 28: North America Market Y-o-Y Growth Comparison by Product Type, 2025-2035
  • Figure 29: North America Market Attractiveness Analysis by Product Type
  • Figure 30: North America Market Value Share and BPS Analysis by Flavoring Type, 2025 and 2035
  • Figure 31: North America Market Y-o-Y Growth Comparison by Flavoring Type, 2025-2035
  • Figure 32: North America Market Attractiveness Analysis by Flavoring Type
  • Figure 33: North America Market Value Share and BPS Analysis by Application, 2025 and 2035
  • Figure 34: North America Market Y-o-Y Growth Comparison by Application, 2025-2035
  • Figure 35: North America Market Attractiveness Analysis by Application
  • Figure 36: North America Market Value Share and BPS Analysis by Distribution Channel, 2025 and 2035
  • Figure 37: North America Market Y-o-Y Growth Comparison by Distribution Channel, 2025-2035
  • Figure 38: North America Market Attractiveness Analysis by Distribution Channel
  • Figure 39: Latin America Market Value Share and BPS Analysis by Country, 2025 and 2035
  • Figure 40: Latin America Market Value Share and BPS Analysis by Product Type, 2025 and 2035
  • Figure 41: Latin America Market Y-o-Y Growth Comparison by Product Type, 2025-2035
  • Figure 42: Latin America Market Attractiveness Analysis by Product Type
  • Figure 43: Latin America Market Value Share and BPS Analysis by Flavoring Type, 2025 and 2035
  • Figure 44: Latin America Market Y-o-Y Growth Comparison by Flavoring Type, 2025-2035
  • Figure 45: Latin America Market Attractiveness Analysis by Flavoring Type
  • Figure 46: Latin America Market Value Share and BPS Analysis by Application, 2025 and 2035
  • Figure 47: Latin America Market Y-o-Y Growth Comparison by Application, 2025-2035
  • Figure 48: Latin America Market Attractiveness Analysis by Application
  • Figure 49: Latin America Market Value Share and BPS Analysis by Distribution Channel, 2025 and 2035
  • Figure 50: Latin America Market Y-o-Y Growth Comparison by Distribution Channel, 2025-2035
  • Figure 51: Latin America Market Attractiveness Analysis by Distribution Channel
  • Figure 52: Western Europe Market Value Share and BPS Analysis by Country, 2025 and 2035
  • Figure 53: Western Europe Market Value Share and BPS Analysis by Product Type, 2025 and 2035
  • Figure 54: Western Europe Market Y-o-Y Growth Comparison by Product Type, 2025-2035
  • Figure 55: Western Europe Market Attractiveness Analysis by Product Type
  • Figure 56: Western Europe Market Value Share and BPS Analysis by Flavoring Type, 2025 and 2035
  • Figure 57: Western Europe Market Y-o-Y Growth Comparison by Flavoring Type, 2025-2035
  • Figure 58: Western Europe Market Attractiveness Analysis by Flavoring Type
  • Figure 59: Western Europe Market Value Share and BPS Analysis by Application, 2025 and 2035
  • Figure 60: Western Europe Market Y-o-Y Growth Comparison by Application, 2025-2035
  • Figure 61: Western Europe Market Attractiveness Analysis by Application
  • Figure 62: Western Europe Market Value Share and BPS Analysis by Distribution Channel, 2025 and 2035
  • Figure 63: Western Europe Market Y-o-Y Growth Comparison by Distribution Channel, 2025-2035
  • Figure 64: Western Europe Market Attractiveness Analysis by Distribution Channel
  • Figure 65: Eastern Europe Market Value Share and BPS Analysis by Country, 2025 and 2035
  • Figure 66: Eastern Europe Market Value Share and BPS Analysis by Product Type, 2025 and 2035
  • Figure 67: Eastern Europe Market Y-o-Y Growth Comparison by Product Type, 2025-2035
  • Figure 68: Eastern Europe Market Attractiveness Analysis by Product Type
  • Figure 69: Eastern Europe Market Value Share and BPS Analysis by Flavoring Type, 2025 and 2035
  • Figure 70: Eastern Europe Market Y-o-Y Growth Comparison by Flavoring Type, 2025-2035
  • Figure 71: Eastern Europe Market Attractiveness Analysis by Flavoring Type
  • Figure 72: Eastern Europe Market Value Share and BPS Analysis by Application, 2025 and 2035
  • Figure 73: Eastern Europe Market Y-o-Y Growth Comparison by Application, 2025-2035
  • Figure 74: Eastern Europe Market Attractiveness Analysis by Application
  • Figure 75: Eastern Europe Market Value Share and BPS Analysis by Distribution Channel, 2025 and 2035
  • Figure 76: Eastern Europe Market Y-o-Y Growth Comparison by Distribution Channel, 2025-2035
  • Figure 77: Eastern Europe Market Attractiveness Analysis by Distribution Channel
  • Figure 78: East Asia Market Value Share and BPS Analysis by Country, 2025 and 2035
  • Figure 79: East Asia Market Value Share and BPS Analysis by Product Type, 2025 and 2035
  • Figure 80: East Asia Market Y-o-Y Growth Comparison by Product Type, 2025-2035
  • Figure 81: East Asia Market Attractiveness Analysis by Product Type
  • Figure 82: East Asia Market Value Share and BPS Analysis by Flavoring Type, 2025 and 2035
  • Figure 83: East Asia Market Y-o-Y Growth Comparison by Flavoring Type, 2025-2035
  • Figure 84: East Asia Market Attractiveness Analysis by Flavoring Type
  • Figure 85: East Asia Market Value Share and BPS Analysis by Application, 2025 and 2035
  • Figure 86: East Asia Market Y-o-Y Growth Comparison by Application, 2025-2035
  • Figure 87: East Asia Market Attractiveness Analysis by Application
  • Figure 88: East Asia Market Value Share and BPS Analysis by Distribution Channel, 2025 and 2035
  • Figure 89: East Asia Market Y-o-Y Growth Comparison by Distribution Channel, 2025-2035
  • Figure 90: East Asia Market Attractiveness Analysis by Distribution Channel
  • Figure 91: South Asia & Pacific Market Value Share and BPS Analysis by Country, 2025 and 2035
  • Figure 92: South Asia & Pacific Market Value Share and BPS Analysis by Product Type, 2025 and 2035
  • Figure 93: South Asia & Pacific Market Y-o-Y Growth Comparison by Product Type, 2025-2035
  • Figure 94: South Asia & Pacific Market Attractiveness Analysis by Product Type
  • Figure 95: South Asia & Pacific Market Value Share and BPS Analysis by Flavoring Type, 2025 and 2035
  • Figure 96: South Asia & Pacific Market Y-o-Y Growth Comparison by Flavoring Type, 2025-2035
  • Figure 97: South Asia & Pacific Market Attractiveness Analysis by Flavoring Type
  • Figure 98: South Asia & Pacific Market Value Share and BPS Analysis by Application, 2025 and 2035
  • Figure 99: South Asia & Pacific Market Y-o-Y Growth Comparison by Application, 2025-2035
  • Figure 100: South Asia & Pacific Market Attractiveness Analysis by Application
  • Figure 101: South Asia & Pacific Market Value Share and BPS Analysis by Distribution Channel, 2025 and 2035
  • Figure 102: South Asia & Pacific Market Y-o-Y Growth Comparison by Distribution Channel, 2025-2035
  • Figure 103: South Asia & Pacific Market Attractiveness Analysis by Distribution Channel
  • Figure 104: Middle East and Africa Market Value Share and BPS Analysis by Country, 2025 and 2035
  • Figure 105: Middle East and Africa Market Value Share and BPS Analysis by Product Type, 2025 and 2035
  • Figure 106: Middle East and Africa Market Y-o-Y Growth Comparison by Product Type, 2025-2035
  • Figure 107: Middle East and Africa Market Attractiveness Analysis by Product Type
  • Figure 108: Middle East and Africa Market Value Share and BPS Analysis by Flavoring Type, 2025 and 2035
  • Figure 109: Middle East and Africa Market Y-o-Y Growth Comparison by Flavoring Type, 2025-2035
  • Figure 110: Middle East and Africa Market Attractiveness Analysis by Flavoring Type
  • Figure 111: Middle East and Africa Market Value Share and BPS Analysis by Application, 2025 and 2035
  • Figure 112: Middle East and Africa Market Y-o-Y Growth Comparison by Application, 2025-2035
  • Figure 113: Middle East and Africa Market Attractiveness Analysis by Application
  • Figure 114: Middle East and Africa Market Value Share and BPS Analysis by Distribution Channel, 2025 and 2035
  • Figure 115: Middle East and Africa Market Y-o-Y Growth Comparison by Distribution Channel, 2025-2035
  • Figure 116: Middle East and Africa Market Attractiveness Analysis by Distribution Channel
  • Figure 117: Global Market - Tier Structure Analysis
  • Figure 118: Global Market - Company Share Analysis

Frequently Asked Questions

How big is the flavored butter and oils market in 2025?

The global flavored butter and oils market is estimated to be valued at USD 564.1 million in 2025.

What will be the size of the flavored butter and oils market in 2035?

The market size for the flavored butter and oils market is projected to reach USD 1,049.0 million by 2035.

How much will be the flavored butter and oils market growth between 2025 and 2035?

The flavored butter and oils market is expected to grow at a 6.4% CAGR between 2025 and 2035.

Which flavoring type segment is projected to lead in the flavored butter and oils market in 2025?

The herb flavoring segment is projected to lead in the flavored butter and oils market with 35% market share in 2025.

Which distribution channel is set to contribute significant share in the flavored butter and oils market in 2025?

In terms of distribution channel, the store-based retailing segment is expected to command 75% share in the flavored butter and oils market in 2025.

Explore Similar Insights

Future Market Insights

Flavored Butter And Oils Market

Chat With

MaRIA

Hi There, I am MaRIA, Your Market Research Intelligence Assistant. How may I help you?