Liquor Flavored Ice Cream Market Overview (2022-2032)

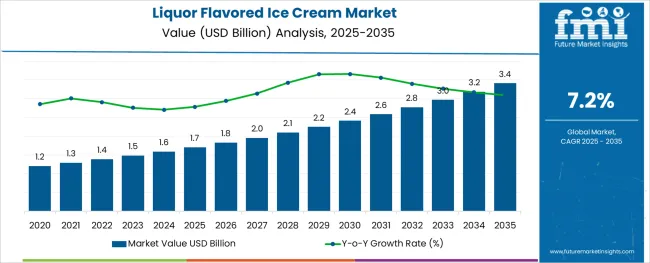
[250 Pages Report] The liquor flavored ice cream market is likely to register a CAGR of 7.2% during the forecast period, and is anticipated to reach a market share of US$ 2.77 Bn in 2032, from US$ 1.29 Bn in 2021, as consumer interest increases and higher the sales of the liquor flavored ice cream.

Attributes Details
 Liquor Flavored Ice Cream Market CAGR 7.2%
 Liquor Flavored Ice Cream Market Size (2021) US$ 1.29 Bn
 Liquor Flavored Ice Cream Market Size (2032) US$ 2.77 Bn

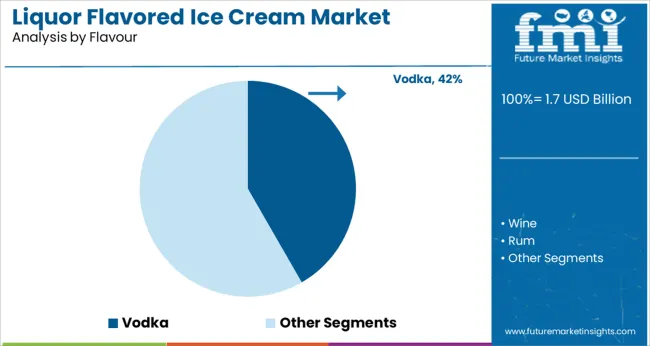
As liquor flavored ice cream contains 0.5 percent or less infused alcohol, demand for liquor flavored ice cream is growing, which is causing a stir in the dairy business. There are a variety of ice cream flavors that have been infused with liquors such as vodka, rum, wine, whiskey, martini, and bourbon, which boost the sales of liquor flavored ice cream.

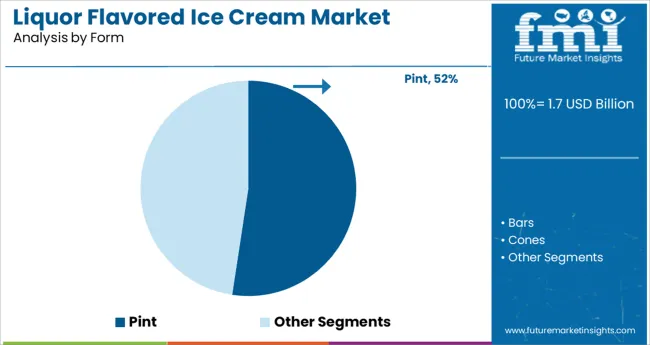
Along with the liquor-flavored ice cream scoops, liquor-flavored ice cream biscuits are also in high demand. The demand for vegan liquor flavored ice creams on the market that are produced with non-dairy ice cream.

As the percentage of vegans in industrialized countries is quickly increasing, vegan liquor flavored ice cream has a greater market opportunity, which affects the sales of liquor flavored ice cream.

Don't pay for what you don't need

Customize your report by selecting specific countries or regions and save 30%!

What Factors Lead to the Growth of the Liquor Flavored Ice Cream Market?

Strong and stable consumer spending in industrialized countries, as well as rising consumer expenditure in developing countries, are expected to boost demand for liquor flavored ice cream.

The availability of many tastes of liquor, as well as varied flavors of ice cream, is expected to provide customers with a wide range of options and expand their decision profiles, hence boost the liquor flavored ice cream market share. This is likely to pique consumer interest and boost sales of liquor-flavored ice cream around the world.

What are the Opportunities Prevailing in the Liquor Flavored Ice Cream Market?

The global liquor flavored ice cream market share is expected to grow as the food and beverage industry thrives and expands. The food and beverage business is being driven by a shift in consumer perceptions and a growing desire to test new and creative products, setting a positive sales of liquor flavored ice cream market.

Demand for liquor-flavored ice cream is relatively recent in the global market, with many new markets still to embrace it. The global liquor flavored ice cream market is being driven by millennial demand, and it is expected to grow in the coming years due to increased demand from generation Z.
Nandini Roy Choudhury

Principal Consultant

Talk to Analyst

Find your sweet spots for generating winning opportunities in this market.

What is the Regional Outlook of the Liquor Flavored Ice Cream Market?

At the moment, the worldwide liquor flavored ice cream market is dominated by the North American and European markets. In comparison to other locations, North America and Europe have a significant amount of popularity and awareness of the product, which thrives the demand for liquor flavored ice cream

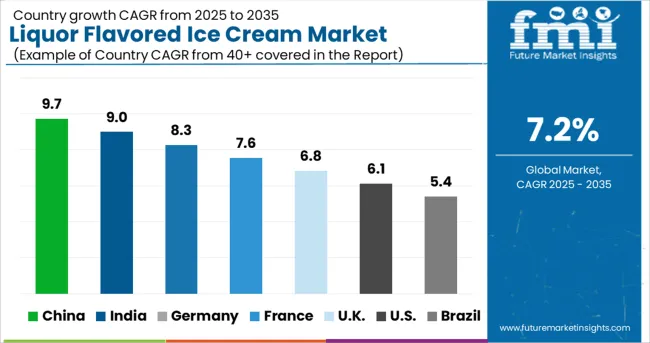
Over the projected period, these regions are expected to hold a significant worldwide liquor flavored ice cream market share. The global liquor flavored ice cream market has increased opportunity and is likely to witness the highest growth over the forecast period due to increasing consumer spending, increasing population, and improving economic conditions and higher sales of liquor flavored ice cream in countries such as China, India, Brazil, Japan, South Korea, Turkey, and others.
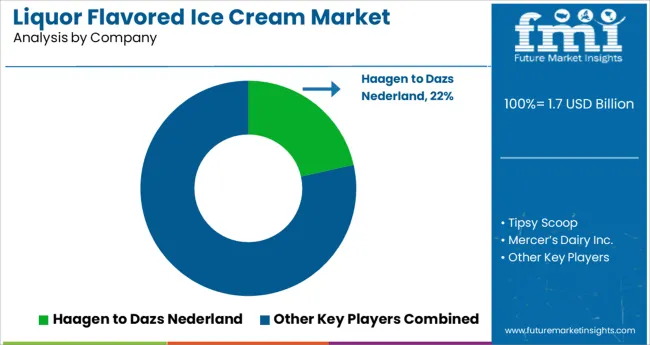
What is the Competitive Landscape for the Liquor Flavored Ice Cream Market?

Haagen-Dazs Nederland N.V, Tipsy Scoop, Mercer’s Dairy Inc, Bailey’s, Ben & Jerry’s, Viennetta in the liquor flavored ice cream market, holding a substantial liquor flavored ice cream market share.

  • Due to increased consumer demand for liquor flavored ice cream over a short period of time, a few big ice cream firms have included liquor flavored ice cream to their product portfolios. The liquor flavored ice cream contains only 0.5 percent alcohol/spirit, allowing you to enjoy the flavor of the liquor without getting drunk.
  • In addition, the manufacturers are developing a non-dairy liquor flavored ice cream that is acceptable for lactose-intolerant and vegan customers. These features are expected to appeal to a huge consumer base and expand the sales of liquor-flavored ice cream globally.

Get the data you need at a Fraction of the cost

Personalize your report by choosing insights you need
and save 40%!

Report Scope

Report Attribute Details
Growth rate CAGR of 7.2% from 2022 to 2032
Base year for estimation 2021
Historical data 2015 - 2020
Forecast period 2022 - 2032
Quantitative units Revenue in USD Million and CAGR from 2022 to 2032
Report coverage Revenue forecast, volume forecast, company ranking, competitive landscape, growth factors, and trends, Pricing Analysis,
Segments covered Flavors, product type, distribution channel, region
Regional scope North America; Western Europe, Eastern Europe, Middle East, Africa, ASEAN, South Asia, Rest of Asia, Australia and New Zealand
Country scope U.S.; Canada; Mexico; Germany; U.K.; France; Italy; Spain; Russia; Belgium; Poland; Czech Republic; China; India; Japan; Australia; Brazil; Argentina; Colombia; Saudi Arabia; UAE; Iran; South Africa
Key companies profiled Haagen-Dazs Nederland N.V., Tipsy Scoop, Mercer’s Dairy Inc., Bailey’s, Ben & Jerry’s, Viennetta
Customization scope Free report customization (equivalent to up to 8 analysts working days) with purchase. Addition or alteration to country, regional & segment scope.
Pricing and purchase options Avail customized purchase options to meet your exact research needs.

Frequently Asked Questions

What is the Growth Outlook for the Liquor Flavored Ice Cream Market?

The liquor flavored ice cream market is anticipated to register a CAGR of 7.2% during the forecast period.

What is the Share of the Liquor Flavored Ice Cream Market?

The liquor flavored ice cream market share is anticipated to reach US$ 2.77 Bn in 2032.

Which is the Key Driver in the Liquor Flavored Ice Cream Market?

Demand for liquor flavored ice cream is likely to rise, as consumer interest increases and trying new & innovative products is driving the food and beverages industry.

Table of Content
1. Executive Summary

    1.1. Global Market Outlook

    1.2. Demand-side Trends

    1.3. Supply-side Trends

    1.4. Technology Roadmap Analysis

    1.5. Analysis and Recommendations

2. Market Overview

    2.1. Market Coverage / Taxonomy

    2.2. Market Definition / Scope / Limitations

3. Market Background

    3.1. Market Dynamics

        3.1.1. Drivers

        3.1.2. Restraints

        3.1.3. Opportunity

        3.1.4. Trends

    3.2. Scenario Forecast

        3.2.1. Demand in Optimistic Scenario

        3.2.2. Demand in Likely Scenario

        3.2.3. Demand in Conservative Scenario

    3.3. Opportunity Map Analysis

    3.4. Product Life Cycle Analysis

    3.5. Supply Chain Analysis

        3.5.1. Supply Side Participants and their Roles

            3.5.1.1. Producers

            3.5.1.2. Mid-Level Participants (Traders/ Agents/ Brokers)

            3.5.1.3. Wholesalers and Distributors

        3.5.2. Value Added and Value Created at Node in the Supply Chain

        3.5.3. List of Raw Material Suppliers

        3.5.4. List of Existing and Potential Buyer’s

    3.6. Investment Feasibility Matrix

    3.7. Value Chain Analysis

        3.7.1. Profit Margin Analysis

        3.7.2. Wholesalers and Distributors

        3.7.3. Retailers

    3.8. PESTLE and Porter’s Analysis

    3.9. Regulatory Landscape

        3.9.1. By Key Regions

        3.9.2. By Key Countries

    3.10. Regional Parent Market Outlook

    3.11. Production and Consumption Statistics

    3.12. Import and Export Statistics

4. Global Liquor Flavored Ice Cream Market Analysis 2017-2021 and Forecast, 2022-2032

    4.1. Historical Market Size Value (US$ Mn) & Volume (MT) Analysis, 2017-2021

    4.2. Current and Future Market Size Value (US$ Mn) & Volume (MT) Projections, 2022-2032

        4.2.1. Y-o-Y Growth Trend Analysis

        4.2.2. Absolute $ Opportunity Analysis

5. Global Liquor Flavored Ice Cream Market Analysis 2017-2021 and Forecast 2022-2032, By Product Type

    5.1. Introduction / Key Findings

    5.2. Historical Market Size Value (US$ Mn) & Volume (MT) Analysis By Product Type, 2017-2021

    5.3. Current and Future Market Size Value (US$ Mn) & Volume (MT) Analysis and Forecast By Product Type, 2022-2032

        5.3.1. Dairy

        5.3.2. Non-Dairy

    5.4. Y-o-Y Growth Trend Analysis By Product Type, 2017-2021

    5.5. Absolute $ Opportunity Analysis By Product Type, 2022-2032

Deep-dive segmentation will be available in the sample on request

6. Global Liquor Flavored Ice Cream Market Analysis 2017-2021 and Forecast 2022-2032, By Flavour

    6.1. Introduction / Key Findings

    6.2. Historical Market Size Value (US$ Mn) & Volume (MT) Analysis By Flavour, 2017-2021

    6.3. Current and Future Market Size Value (US$ Mn) & Volume (MT) Analysis and Forecast By Flavour, 2022-2032

        6.3.1. Wine

        6.3.2. Vodka

        6.3.3. Rum

        6.3.4. Other (Whiskey, etc.)

    6.4. Y-o-Y Growth Trend Analysis By Flavour, 2017-2021

    6.5. Absolute $ Opportunity Analysis By Flavour, 2022-2032

Deep-dive segmentation will be available in the sample on request

7. Global Liquor Flavored Ice Cream Market Analysis 2017-2021 and Forecast 2022-2032, By Sales Channel

    7.1. Introduction / Key Findings

    7.2. Historical Market Size Value (US$ Mn) & Volume (MT) Analysis By Sales Channel, 2017-2021

    7.3. Current and Future Market Size Value (US$ Mn) & Volume (MT) Analysis and Forecast By Sales Channel, 2022-2032

        7.3.1. Direct Sales Channel/B2B

        7.3.2. Indirect Sales Channel/B2C

    7.4. Y-o-Y Growth Trend Analysis By Sales Channel, 2017-2021

    7.5. Absolute $ Opportunity Analysis By Sales Channel, 2022-2032

Deep-dive segmentation will be available in the sample on request

8. Global Liquor Flavored Ice Cream Market Analysis 2017-2021 and Forecast 2022-2032, By Packaging Format

    8.1. Introduction / Key Findings

    8.2. Historical Market Size Value (US$ Mn) & Volume (MT) Analysis By Packaging Format, 2017-2021

    8.3. Current and Future Market Size Value (US$ Mn) & Volume (MT) Analysis and Forecast By Packaging Format, 2022-2032

        8.3.1. Unpackaged/Made-to-Order

        8.3.2. Cartons

        8.3.3. Tubs

        8.3.4. Mini-Cups (100 – 180 mL)

        8.3.5. Regular Cups (250 – 500 mL)

        8.3.6. Other Formats

    8.4. Y-o-Y Growth Trend Analysis By Packaging Format, 2017-2021

    8.5. Absolute $ Opportunity Analysis By Packaging Format, 2022-2032

Deep-dive segmentation will be available in the sample on request

9. Global Liquor Flavored Ice Cream Market Analysis 2017-2021 and Forecast 2022-2032, By Form

    9.1. Introduction / Key Findings

    9.2. Historical Market Size Value (US$ Mn) & Volume (MT) Analysis By Form, 2017-2021

    9.3. Current and Future Market Size Value (US$ Mn) & Volume (MT) Analysis and Forecast By Form, 2022-2032

        9.3.1. Pint

        9.3.2. Bars

        9.3.3. Cones

        9.3.4. Sandwich

    9.4. Y-o-Y Growth Trend Analysis By Form, 2017-2021

    9.5. Absolute $ Opportunity Analysis By Form, 2022-2032

Deep-dive segmentation will be available in the sample on request

10. Global Liquor Flavored Ice Cream Market Analysis 2017-2021 and Forecast 2022-2032, By Pack Size

    10.1. Introduction / Key Findings

    10.2. Historical Market Size Value (US$ Mn) & Volume (MT) Analysis By Pack Size, 2017-2021

    10.3. Current and Future Market Size Value (US$ Mn) & Volume (MT) Analysis and Forecast By Pack Size, 2022-2032

        10.3.1. Single-serve

        10.3.2. Family Pack/Jumbo

    10.4. Y-o-Y Growth Trend Analysis By Pack Size, 2017-2021

    10.5. Absolute $ Opportunity Analysis By Pack Size, 2022-2032

Deep-dive segmentation will be available in the sample on request

11. Global Liquor Flavored Ice Cream Market Analysis 2017-2021 and Forecast 2022-2032, By Region

    11.1. Introduction

    11.2. Historical Market Size Value (US$ Mn) & Volume (MT) Analysis By Region, 2017-2021

    11.3. Current Market Size Value (US$ Mn) & Volume (MT) Analysis and Forecast By Region, 2022-2032

        11.3.1. North America

        11.3.2. Latin America

        11.3.3. Europe

        11.3.4. East Asia

        11.3.5. South Asia & Pacific

        11.3.6. MEA

    11.4. Market Attractiveness Analysis By Region

12. North America Liquor Flavored Ice Cream Market Analysis 2017-2021 and Forecast 2022-2032, By Country

    12.1. Historical Market Size Value (US$ Mn) & Volume (MT) Trend Analysis By Market Taxonomy, 2017-2021

    12.2. Market Size Value (US$ Mn) & Volume (MT) Forecast By Market Taxonomy, 2022-2032

        12.2.1. By Country

            12.2.1.1. U.S.

            12.2.1.2. Canada

        12.2.2. By Product Type

        12.2.3. By Flavour

        12.2.4. By Sales Channel

        12.2.5. By Packaging Format

        12.2.6. By Form

        12.2.7. By Pack Size

    12.3. Market Attractiveness Analysis

        12.3.1. By Country

        12.3.2. By Product Type

        12.3.3. By Flavour

        12.3.4. By Sales Channel

        12.3.5. By Packaging Format

        12.3.6. By Form

        12.3.7. By Pack Size

    12.4. Key Takeaways

13. Latin America Liquor Flavored Ice Cream Market Analysis 2017-2021 and Forecast 2022-2032, By Country

    13.1. Historical Market Size Value (US$ Mn) & Volume (MT) Trend Analysis By Market Taxonomy, 2017-2021

    13.2. Market Size Value (US$ Mn) & Volume (MT) Forecast By Market Taxonomy, 2022-2032

        13.2.1. By Country

            13.2.1.1. Mexico

            13.2.1.2. Brazil

            13.2.1.3. Rest of Latin America

        13.2.2. By Product Type

        13.2.3. By Flavour

        13.2.4. By Sales Channel

        13.2.5. By Packaging Format

        13.2.6. By Form

        13.2.7. By Pack Size

    13.3. Market Attractiveness Analysis

        13.3.1. By Country

        13.3.2. By Product Type

        13.3.3. By Flavour

        13.3.4. By Sales Channel

        13.3.5. By Packaging Format

        13.3.6. By Form

        13.3.7. By Pack Size

    13.4. Key Takeaways

14. Europe Liquor Flavored Ice Cream Market Analysis 2017-2021 and Forecast 2022-2032, By Country

    14.1. Historical Market Size Value (US$ Mn) & Volume (MT) Trend Analysis By Market Taxonomy, 2017-2021

    14.2. Market Size Value (US$ Mn) & Volume (MT) Forecast By Market Taxonomy, 2022-2032

        14.2.1. By Country

            14.2.1.1. Germany

            14.2.1.2. Italy

            14.2.1.3. France

            14.2.1.4. U.K.

            14.2.1.5. Spain

            14.2.1.6. BENELUX

            14.2.1.7. Russia

            14.2.1.8. Rest of Europe

        14.2.2. By Product Type

        14.2.3. By Flavour

        14.2.4. By Sales Channel

        14.2.5. By Packaging Format

        14.2.6. By Form

        14.2.7. By Pack Size

    14.3. Market Attractiveness Analysis

        14.3.1. By Country

        14.3.2. By Product Type

        14.3.3. By Flavour

        14.3.4. By Sales Channel

        14.3.5. By Packaging Format

        14.3.6. By Form

        14.3.7. By Pack Size

    14.4. Key Takeaways

15. East Asia Liquor Flavored Ice Cream Market Analysis 2017-2021 and Forecast 2022-2032, By Country

    15.1. Historical Market Size Value (US$ Mn) & Volume (MT) Trend Analysis By Market Taxonomy, 2017-2021

    15.2. Market Size Value (US$ Mn) & Volume (MT) Forecast By Market Taxonomy, 2022-2032

        15.2.1. By Country

            15.2.1.1. China

            15.2.1.2. Japan

            15.2.1.3. South Korea

        15.2.2. By Product Type

        15.2.3. By Flavour

        15.2.4. By Sales Channel

        15.2.5. By Packaging Format

        15.2.6. By Form

        15.2.7. By Pack Size

    15.3. Market Attractiveness Analysis

        15.3.1. By Country

        15.3.2. By Product Type

        15.3.3. By Flavour

        15.3.4. By Sales Channel

        15.3.5. By Packaging Format

        15.3.6. By Form

        15.3.7. By Pack Size

    15.4. Key Takeaways

16. South Asia & Pacific Liquor Flavored Ice Cream Market Analysis 2017-2021 and Forecast 2022-2032, By Country

    16.1. Historical Market Size Value (US$ Mn) & Volume (MT) Trend Analysis By Market Taxonomy, 2017-2021

    16.2. Market Size Value (US$ Mn) & Volume (MT) Forecast By Market Taxonomy, 2022-2032

        16.2.1. By Country

            16.2.1.1. India

            16.2.1.2. ASEAN

            16.2.1.3. Australia and New Zealand

            16.2.1.4. Rest of South Asia & Pacific

        16.2.2. By Product Type

        16.2.3. By Flavour

        16.2.4. By Sales Channel

        16.2.5. By Packaging Format

        16.2.6. By Form

        16.2.7. By Pack Size

    16.3. Market Attractiveness Analysis

        16.3.1. By Country

        16.3.2. By Product Type

        16.3.3. By Flavour

        16.3.4. By Sales Channel

        16.3.5. By Packaging Format

        16.3.6. By Form

        16.3.7. By Pack Size

    16.4. Key Takeaways

17. MEA Liquor Flavored Ice Cream Market Analysis 2017-2021 and Forecast 2022-2032, By Country

    17.1. Historical Market Size Value (US$ Mn) & Volume (MT) Trend Analysis By Market Taxonomy, 2017-2021

    17.2. Market Size Value (US$ Mn) & Volume (MT) Forecast By Market Taxonomy, 2022-2032

        17.2.1. By Country

            17.2.1.1. GCC Countries

            17.2.1.2. Turkey

            17.2.1.3. South Africa

            17.2.1.4. Rest of MEA

        17.2.2. By Product Type

        17.2.3. By Flavour

        17.2.4. By Sales Channel

        17.2.5. By Packaging Format

        17.2.6. By Form

        17.2.7. By Pack Size

    17.3. Market Attractiveness Analysis

        17.3.1. By Country

        17.3.2. By Product Type

        17.3.3. By Flavour

        17.3.4. By Sales Channel

        17.3.5. By Packaging Format

        17.3.6. By Form

        17.3.7. By Pack Size

    17.4. Key Takeaways

18. Key Countries Liquor Flavored Ice Cream Market Analysis

    18.1. U.S.

        18.1.1. Pricing Analysis

        18.1.2. Market Share Analysis, 2021

            18.1.2.1. By Product Type

            18.1.2.2. By Flavour

            18.1.2.3. By Sales Channel

            18.1.2.4. By Packaging Format

            18.1.2.5. By Form

            18.1.2.6. By Pack Size

    18.2. Canada

        18.2.1. Pricing Analysis

        18.2.2. Market Share Analysis, 2021

            18.2.2.1. By Product Type

            18.2.2.2. By Flavour

            18.2.2.3. By Sales Channel

            18.2.2.4. By Packaging Format

            18.2.2.5. By Form

            18.2.2.6. By Pack Size

    18.3. Mexico

        18.3.1. Pricing Analysis

        18.3.2. Market Share Analysis, 2021

            18.3.2.1. By Product Type

            18.3.2.2. By Flavour

            18.3.2.3. By Sales Channel

            18.3.2.4. By Packaging Format

            18.3.2.5. By Form

            18.3.2.6. By Pack Size

    18.4. Brazil

        18.4.1. Pricing Analysis

        18.4.2. Market Share Analysis, 2021

            18.4.2.1. By Product Type

            18.4.2.2. By Flavour

            18.4.2.3. By Sales Channel

            18.4.2.4. By Packaging Format

            18.4.2.5. By Form

            18.4.2.6. By Pack Size

    18.5. Germany

        18.5.1. Pricing Analysis

        18.5.2. Market Share Analysis, 2021

            18.5.2.1. By Product Type

            18.5.2.2. By Flavour

            18.5.2.3. By Sales Channel

            18.5.2.4. By Packaging Format

            18.5.2.5. By Form

            18.5.2.6. By Pack Size

    18.6. Italy

        18.6.1. Pricing Analysis

        18.6.2. Market Share Analysis, 2021

            18.6.2.1. By Product Type

            18.6.2.2. By Flavour

            18.6.2.3. By Sales Channel

            18.6.2.4. By Packaging Format

            18.6.2.5. By Form

            18.6.2.6. By Pack Size

    18.7. France

        18.7.1. Pricing Analysis

        18.7.2. Market Share Analysis, 2021

            18.7.2.1. By Product Type

            18.7.2.2. By Flavour

            18.7.2.3. By Sales Channel

            18.7.2.4. By Packaging Format

            18.7.2.5. By Form

            18.7.2.6. By Pack Size

    18.8. U.K.

        18.8.1. Pricing Analysis

        18.8.2. Market Share Analysis, 2021

            18.8.2.1. By Product Type

            18.8.2.2. By Flavour

            18.8.2.3. By Sales Channel

            18.8.2.4. By Packaging Format

            18.8.2.5. By Form

            18.8.2.6. By Pack Size

    18.9. Spain

        18.9.1. Pricing Analysis

        18.9.2. Market Share Analysis, 2021

            18.9.2.1. By Product Type

            18.9.2.2. By Flavour

            18.9.2.3. By Sales Channel

            18.9.2.4. By Packaging Format

            18.9.2.5. By Form

            18.9.2.6. By Pack Size

    18.10. BENELUX

        18.10.1. Pricing Analysis

        18.10.2. Market Share Analysis, 2021

            18.10.2.1. By Product Type

            18.10.2.2. By Flavour

            18.10.2.3. By Sales Channel

            18.10.2.4. By Packaging Format

            18.10.2.5. By Form

            18.10.2.6. By Pack Size

    18.11. Russia

        18.11.1. Pricing Analysis

        18.11.2. Market Share Analysis, 2021

            18.11.2.1. By Product Type

            18.11.2.2. By Flavour

            18.11.2.3. By Sales Channel

            18.11.2.4. By Packaging Format

            18.11.2.5. By Form

            18.11.2.6. By Pack Size

    18.12. China

        18.12.1. Pricing Analysis

        18.12.2. Market Share Analysis, 2021

            18.12.2.1. By Product Type

            18.12.2.2. By Flavour

            18.12.2.3. By Sales Channel

            18.12.2.4. By Packaging Format

            18.12.2.5. By Form

            18.12.2.6. By Pack Size

    18.13. Japan

        18.13.1. Pricing Analysis

        18.13.2. Market Share Analysis, 2021

            18.13.2.1. By Product Type

            18.13.2.2. By Flavour

            18.13.2.3. By Sales Channel

            18.13.2.4. By Packaging Format

            18.13.2.5. By Form

            18.13.2.6. By Pack Size

    18.14. South Korea

        18.14.1. Pricing Analysis

        18.14.2. Market Share Analysis, 2021

            18.14.2.1. By Product Type

            18.14.2.2. By Flavour

            18.14.2.3. By Sales Channel

            18.14.2.4. By Packaging Format

            18.14.2.5. By Form

            18.14.2.6. By Pack Size

    18.15. India

        18.15.1. Pricing Analysis

        18.15.2. Market Share Analysis, 2021

            18.15.2.1. By Product Type

            18.15.2.2. By Flavour

            18.15.2.3. By Sales Channel

            18.15.2.4. By Packaging Format

            18.15.2.5. By Form

            18.15.2.6. By Pack Size

    18.16. ASEAN

        18.16.1. Pricing Analysis

        18.16.2. Market Share Analysis, 2021

            18.16.2.1. By Product Type

            18.16.2.2. By Flavour

            18.16.2.3. By Sales Channel

            18.16.2.4. By Packaging Format

            18.16.2.5. By Form

            18.16.2.6. By Pack Size

    18.17. Australia and New Zealand

        18.17.1. Pricing Analysis

        18.17.2. Market Share Analysis, 2021

            18.17.2.1. By Product Type

            18.17.2.2. By Flavour

            18.17.2.3. By Sales Channel

            18.17.2.4. By Packaging Format

            18.17.2.5. By Form

            18.17.2.6. By Pack Size

    18.18. GCC Countries

        18.18.1. Pricing Analysis

        18.18.2. Market Share Analysis, 2021

            18.18.2.1. By Product Type

            18.18.2.2. By Flavour

            18.18.2.3. By Sales Channel

            18.18.2.4. By Packaging Format

            18.18.2.5. By Form

            18.18.2.6. By Pack Size

    18.19. Turkey

        18.19.1. Pricing Analysis

        18.19.2. Market Share Analysis, 2021

            18.19.2.1. By Product Type

            18.19.2.2. By Flavour

            18.19.2.3. By Sales Channel

            18.19.2.4. By Packaging Format

            18.19.2.5. By Form

            18.19.2.6. By Pack Size

    18.20. South Africa

        18.20.1. Pricing Analysis

        18.20.2. Market Share Analysis, 2021

            18.20.2.1. By Product Type

            18.20.2.2. By Flavour

            18.20.2.3. By Sales Channel

            18.20.2.4. By Packaging Format

            18.20.2.5. By Form

            18.20.2.6. By Pack Size

19. Market Structure Analysis

    19.1. Competition Dashboard

    19.2. Competition Benchmarking

    19.3. Market Share Analysis of Top Players

        19.3.1. By Regional

        19.3.2. By Product Type

        19.3.3. By Flavour

        19.3.4. By Sales Channel

        19.3.5. By Packaging Format

        19.3.6. By Form

        19.3.7. By Pack Size

20. Competition Analysis

    20.1. Competition Deep Dive

        20.1.1. Haagen-Dazs Nederland

            20.1.1.1. Overview

            20.1.1.2. Product Portfolio

            20.1.1.3. Profitability by Market Segments

            20.1.1.4. Sales Footprint

            20.1.1.5. Strategy Overview

                20.1.1.5.1. Marketing Strategy

                20.1.1.5.2. Product Strategy

                20.1.1.5.3. Channel Strategy

        20.1.2. Tipsy Scoop

            20.1.2.1. Overview

            20.1.2.2. Product Portfolio

            20.1.2.3. Profitability by Market Segments

            20.1.2.4. Sales Footprint

            20.1.2.5. Strategy Overview

                20.1.2.5.1. Marketing Strategy

                20.1.2.5.2. Product Strategy

                20.1.2.5.3. Channel Strategy

        20.1.3. Mercer’s Dairy Inc.

            20.1.3.1. Overview

            20.1.3.2. Product Portfolio

            20.1.3.3. Profitability by Market Segments

            20.1.3.4. Sales Footprint

            20.1.3.5. Strategy Overview

                20.1.3.5.1. Marketing Strategy

                20.1.3.5.2. Product Strategy

                20.1.3.5.3. Channel Strategy

        20.1.4. Bailey’s

            20.1.4.1. Overview

            20.1.4.2. Product Portfolio

            20.1.4.3. Profitability by Market Segments

            20.1.4.4. Sales Footprint

            20.1.4.5. Strategy Overview

                20.1.4.5.1. Marketing Strategy

                20.1.4.5.2. Product Strategy

                20.1.4.5.3. Channel Strategy

        20.1.5. Ben & Jerry’s

            20.1.5.1. Overview

            20.1.5.2. Product Portfolio

            20.1.5.3. Profitability by Market Segments

            20.1.5.4. Sales Footprint

            20.1.5.5. Strategy Overview

                20.1.5.5.1. Marketing Strategy

                20.1.5.5.2. Product Strategy

                20.1.5.5.3. Channel Strategy

        20.1.6. Viennetta

            20.1.6.1. Overview

            20.1.6.2. Product Portfolio

            20.1.6.3. Profitability by Market Segments

            20.1.6.4. Sales Footprint

            20.1.6.5. Strategy Overview

                20.1.6.5.1. Marketing Strategy

                20.1.6.5.2. Product Strategy

                20.1.6.5.3. Channel Strategy

        20.1.7. Buzz Bar

            20.1.7.1. Overview

            20.1.7.2. Product Portfolio

            20.1.7.3. Profitability by Market Segments

            20.1.7.4. Sales Footprint

            20.1.7.5. Strategy Overview

                20.1.7.5.1. Marketing Strategy

                20.1.7.5.2. Product Strategy

                20.1.7.5.3. Channel Strategy

        20.1.8. Frozen Pints

            20.1.8.1. Overview

            20.1.8.2. Product Portfolio

            20.1.8.3. Profitability by Market Segments

            20.1.8.4. Sales Footprint

            20.1.8.5. Strategy Overview

                20.1.8.5.1. Marketing Strategy

                20.1.8.5.2. Product Strategy

                20.1.8.5.3. Channel Strategy

        20.1.9. Snobar Cocktails

            20.1.9.1. Overview

            20.1.9.2. Product Portfolio

            20.1.9.3. Profitability by Market Segments

            20.1.9.4. Sales Footprint

            20.1.9.5. Strategy Overview

                20.1.9.5.1. Marketing Strategy

                20.1.9.5.2. Product Strategy

                20.1.9.5.3. Channel Strategy

        20.1.10. Smitten Ice Cream

            20.1.10.1. Overview

            20.1.10.2. Product Portfolio

            20.1.10.3. Profitability by Market Segments

            20.1.10.4. Sales Footprint

            20.1.10.5. Strategy Overview

                20.1.10.5.1. Marketing Strategy

                20.1.10.5.2. Product Strategy

                20.1.10.5.3. Channel Strategy

        20.1.11. King of Pops

            20.1.11.1. Overview

            20.1.11.2. Product Portfolio

            20.1.11.3. Profitability by Market Segments

            20.1.11.4. Sales Footprint

            20.1.11.5. Strategy Overview

                20.1.11.5.1. Marketing Strategy

                20.1.11.5.2. Product Strategy

                20.1.11.5.3. Channel Strategy

        20.1.12. Kraft Foods Inc.

            20.1.12.1. Overview

            20.1.12.2. Product Portfolio

            20.1.12.3. Profitability by Market Segments

            20.1.12.4. Sales Footprint

            20.1.12.5. Strategy Overview

                20.1.12.5.1. Marketing Strategy

                20.1.12.5.2. Product Strategy

                20.1.12.5.3. Channel Strategy

        20.1.13. Baskin Robbins

            20.1.13.1. Overview

            20.1.13.2. Product Portfolio

            20.1.13.3. Profitability by Market Segments

            20.1.13.4. Sales Footprint

            20.1.13.5. Strategy Overview

                20.1.13.5.1. Marketing Strategy

                20.1.13.5.2. Product Strategy

                20.1.13.5.3. Channel Strategy

        20.1.14. Perry’s Ice Cream Company, Inc.

            20.1.14.1. Overview

            20.1.14.2. Product Portfolio

            20.1.14.3. Profitability by Market Segments

            20.1.14.4. Sales Footprint

            20.1.14.5. Strategy Overview

                20.1.14.5.1. Marketing Strategy

                20.1.14.5.2. Product Strategy

                20.1.14.5.3. Channel Strategy

        20.1.15. CREAM Inc.

            20.1.15.1. Overview

            20.1.15.2. Product Portfolio

            20.1.15.3. Profitability by Market Segments

            20.1.15.4. Sales Footprint

            20.1.15.5. Strategy Overview

                20.1.15.5.1. Marketing Strategy

                20.1.15.5.2. Product Strategy

                20.1.15.5.3. Channel Strategy

        20.1.16. Nestle SA

            20.1.16.1. Overview

            20.1.16.2. Product Portfolio

            20.1.16.3. Profitability by Market Segments

            20.1.16.4. Sales Footprint

            20.1.16.5. Strategy Overview

                20.1.16.5.1. Marketing Strategy

                20.1.16.5.2. Product Strategy

                20.1.16.5.3. Channel Strategy

        20.1.17. Dreyer’s Grand Ice Cream Inc.

            20.1.17.1. Overview

            20.1.17.2. Product Portfolio

            20.1.17.3. Profitability by Market Segments

            20.1.17.4. Sales Footprint

            20.1.17.5. Strategy Overview

                20.1.17.5.1. Marketing Strategy

                20.1.17.5.2. Product Strategy

                20.1.17.5.3. Channel Strategy

        20.1.18. Willy’s Ice Cream Ltd.

            20.1.18.1. Overview

            20.1.18.2. Product Portfolio

            20.1.18.3. Profitability by Market Segments

            20.1.18.4. Sales Footprint

            20.1.18.5. Strategy Overview

                20.1.18.5.1. Marketing Strategy

                20.1.18.5.2. Product Strategy

                20.1.18.5.3. Channel Strategy

        20.1.19. Trade FBS GmbH

            20.1.19.1. Overview

            20.1.19.2. Product Portfolio

            20.1.19.3. Profitability by Market Segments

            20.1.19.4. Sales Footprint

            20.1.19.5. Strategy Overview

                20.1.19.5.1. Marketing Strategy

                20.1.19.5.2. Product Strategy

                20.1.19.5.3. Channel Strategy

        20.1.20. Glaces Des Alpes

            20.1.20.1. Overview

            20.1.20.2. Product Portfolio

            20.1.20.3. Profitability by Market Segments

            20.1.20.4. Sales Footprint

            20.1.20.5. Strategy Overview

                20.1.20.5.1. Marketing Strategy

                20.1.20.5.2. Product Strategy

                20.1.20.5.3. Channel Strategy

21. Assumptions & Acronyms Used

22. Research Methodology

Explore Food and Beverage Insights

View Reports
Future Market Insights

Liquor Flavored Ice Cream Market