Reports
- Global Locations -
Headquarters
Future Market Insights, Inc.
Christiana Corporate, 200
Continental Drive, Suite 401,
Newark, Delaware - 19713,
United States
Americas
Future Market Insights, Inc.
616 Corporate Way, Suite 2-9018,
Valley Cottage, NY 10989, United States
MEA
Future Market Insights
1602-6 Jumeirah Bay X2 Tower, Plot No: JLT-PH2-X2A,
Jumeirah Lakes Towers, Dubai,
United Arab Emirates
Europe
Future Market Insights
3rd Floor, 207 Regent Street,
W1B 3HH London
United Kingdom
Asia Pacific
Future Market Insights
Office No. 401-A, 4th Floor,
VANTAGE 9, S.No. 36/1/1,
Baner, Pune 411045, India
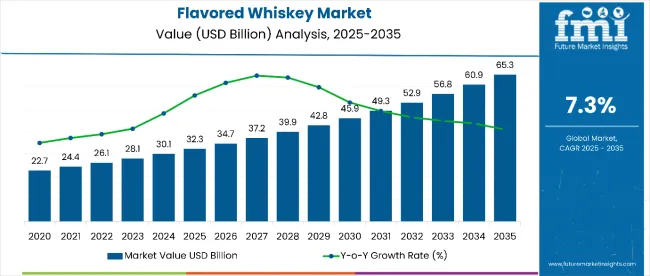
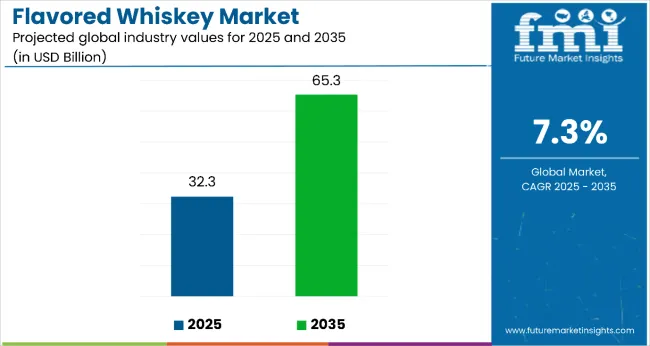
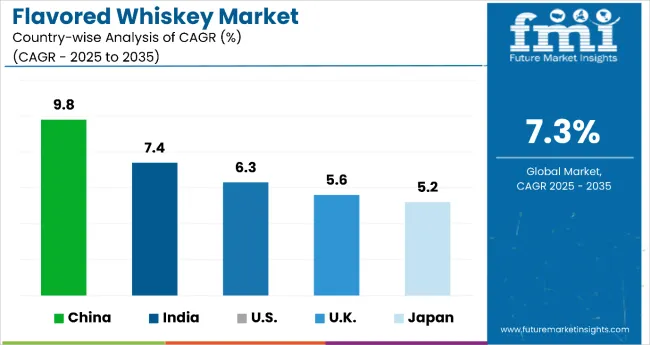
The global flavored whiskey market is expected to garner a market value of US$ 28,080 million in 2023. Owing to the rising popularity, especially among Generation Z and the millennial populace, the demand for flavored whiskey is projected to upsurge throughout the forecast period. From 2023 to 2033, sales of flavored whiskey are anticipated to take a turn for the better, registering a CAGR of 7.3% to reach US$ 57,052.3 million. During the historical period 2018 to 2022, a CAGR worth 2.2% was projected for the market.
ldquo Upward trend of consumption of low-alcohol-based drinks and increasing preference for unique flavored drinks among millennials and Generation Z has augmented the demand for flavored whiskey
Attributes | Key Statistics |
---|---|
Flavored Whiskey Market Size (2022) | 27,000 million |
Flavored Whiskey Estimated Market Size (2023) | 28,080 million |
Market Projected Size (2033) | 57,052.3 million |
Value CAGR (2023 to 2033) | 7.3% |
Flavored whiskey is a whiskey-based liqueur offering designed for the younger female consumer base who has a preference for a smoother and unique accent in their drink. With other spirit offering such as beer, vodka, and rum, whiskey manufacturers have also invested in the flavored whiskey market by expanding their product portfolio with flavored offerings.
The flavored whiskey is largely welcomed due to its ability to carve out off-tastes from the finished product to give the consumer a relaxing and sherbety finish. The flavored whiskey market is expected to be dominated by the North American region owing to its early entry into the region and rising flavored spirit in the region. The honey-flavored segment is expected to dominate the global flavored whiskey market resulting from its welcoming taste.
Don't pay for what you don't need
Customize your report by selecting specific countries or regions and save 30%!
The global flavored whiskey market is expected to be driven by youth-centric product trends. The increasing younger population is expected to create demand for flavored whiskey over the forecast period. Also, a spike in the female drinking population is anticipated which requires a different taste profile to target which is why flavored spirits are expected to witness high CAGR growth in the developing regions, globally.
The introduction of a competitive segment in the mature spirit market is expected to drive the demand for flavored whiskey over the forecast period owing to the introduction of attractive drinks against old ones. A growing number of restaurants and bars in a variety of regions is expected to boost the market in the future.
A growing social media trend and a demand for social gatherings will propel the growth of flavored whiskey. Increasing interest in parties and events is expected to result in an increase in demand for flavored whiskey over the next few years.
The competitive flavored spirit and lower price point of craft beers over flavored whiskey are expected to restrain the global flavored whiskey market over the forecast period. Over time, excessive alcohol consumption can increase the consumer’s risk of chronic disease and other health issues. Whiskey's heart benefits come in small doses. High consumption of alcohol can result in high blood pressure, high cholesterol, and heart disease.
North America is the second-largest region, accounting for nearly 26% of the global flavored whiskey market, and is expected to maintain its market growth over the forecast period, states Future Market Insights. The fact that the regional manufacturers are the initiator of the flavored whiskey market means flavored whiskey is already a known product in the region.
Burgeoning demand for vodka and whiskey-based beverages is fuelling the regional market. The USA accounts for the largest revenue share in the regional market in 2022, backed by the soaring consumer demand for different flavors and shifting preferences towards on-the-go products. The small alcohol content and lower price of these cocktails are driving their demand among the consumers in the region.
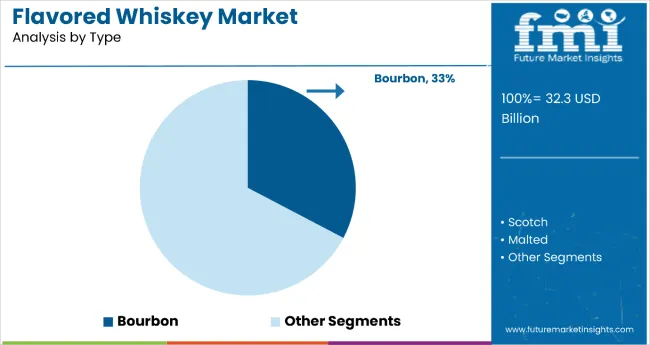
The prominent alcohol brands are launching new products and adding distinctive flavors to offer a different taste to their favorite drinks, which is likely to increase the consumption rate of Bourbon flavor whiskey in the region. For instance, In March 2022, Pernod Ricard launched a canned ready-to-drink cocktail named Jameson Ginger & Lime, which is 6% ABV, is made with Jameson’s Irish whiskey brand which has rolled out across the US and became available stateside in time for St Patrick’s Day celebrations.
Europe dominates the market for Flavored Whiskey in terms of revenue, owing to the large consumer base for flavored spirits in the region. The region accounts for nearly 30% and is estimated to maintain its lead during the forecast period, reveals the Future Market Insights report. Europe’s alcohol market is the largest in the world. There has been a dynamic shift in consumer behavior, with the upward trend to focus on the use of natural botanical ingredients added to spirits, growth in demand for natural wines, and increased use of fruit flavors in cider and ready-to-drink products.
With the changing requirements across Europe, alcohol brands are adapting to this change for good. Besides, the increasing awareness regarding the health benefits related to whiskey has caught the eye of teenagers and health enthusiasts. Consumers have shifted towards low alcohol-based drinks such as beer and wines in countries like Spain & Sweden. In June 2022, Summerhall Distillery expanded its range of spirits with the launch of a new blended whisky. This is likely to offer a new sweet and smooth flavor to consumers looking to taste a distinct flavor.
Additionally, In June 2022, Screwball Whiskey, the original peanut butter whiskey, introduced an innovative 100ml can to its product lineup, which comprises 750ml, 375ml, 200 ml, 50ml, and 1L glass bottles. Unlike RTD canned cocktails, this convenient and fun option offers two servings of sweet and savory flavored whiskey with no mixers, perfect for sipping straight.
The Asia Pacific is projected to record the fastest growth rate throughout the forecast i.e., from 2023 to 2033. The market growth is attributed to the rising demand for premium, convenient, and quality cocktails owing to the increasing influence of Western culture. Shifting lifestyles and increasing alcohol consumption in the region are other foremost factors piloting the product demand.
The convenience presented by the RTD drinks, along with the little alcohol level and cheaper price in contrast to cocktails served at bars, makes them the most preferred choice for young consumers. Prominent manufacturers are catering to sustained consumer interest in the whiskey sector and rising trends surrounding ready-to-drink consumption are estimated to propel the market growth. For instance, In April 2022, Alcohol giant Kirin launched its first hard seltzers in Japan as well as new whiskey in response to increasing demand.
The growing trend for RTD whiskey consumption trend is picking between the 20- to 30-year-old group coupled with the increasing consumption by the female population is likely to significantly boost the demand in the countries like Singapore, Thailand, Japan, and others.
A growing number of consumers are seeking out artisanal and craft spirits, and bourbon is a significant player in this market. The emergence of craft distilleries, producing flavorsome and unique bourbon varieties, has gained traction in recent years.
Drinks like Old Fashioned and Manhattan, which often contain bourbon, are gaining popularity. With the rise of cocktail culture, bourbon has become an integral part of many drinks. Market analysts forecasted a 24.50% growth rate in 2022.
The spirits industry has been impacted by consumer willingness to spend more on premium and high-quality products. As a result of its premium positioning, bourbon, particularly older and rarer variants, has become synonymous with top-of-the-line flavors and experiences, and is attracting a premium audience.
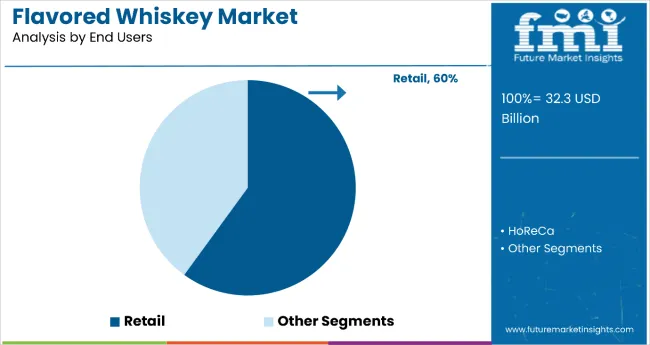
Growing demand for appealing to new tastes and cost-effective prices the market is expected to grow in demand for flavored whiskey in the retail market. According to estimates, the market accounted for 78.60% of the total revenue share in 2022.
With the introduction of different flavors, whiskey producers can attract an even broader audience, including whiskey newbies and people who have never tried whiskey. Increased consumer demand could increase retail sales as a result of the expansion of the consumer base.
Whiskeys with flavors can be used in cocktails more effectively than those without flavors. In addition to adding new dimensions to classic cocktails, they can also be used to inspire new ones. Consequently, bars and restaurants will be more willing to stock flavored whiskey, which will increase retail sales in the market.
The market for citrus flavors is expected to grow in the coming years. In 2022, the market accounted for 21.40% of the total market. The popularity of whiskey has skyrocketed in recent years, especially among younger consumers. With a growing number of people exploring the world of whiskey, there is an increasing demand for new and novel flavors beyond those offered by traditional brands.
Generally, citrus flavors evoke a feeling of freshness and serve as a reminder that summer is coming. As consumers seek out refreshing beverages during spring and summer, citrus-flavored whiskey may see an increase in demand.
The strong, robust taste of traditional whiskey can be quite off-putting for some individuals. Individuals who enjoy citrus flavors might be attracted to this type of whiskey in the market. With citrus flavors, a wider range of consumers might find it more approachable and palatable.
In addition to classic whiskey cocktails, citrus-flavored whiskey can add a refreshing and versatile twist to new creations, such as Old Fashioneds, Whiskey Sours, and even new whiskey cocktails. Adding citrus-flavored whiskey to a cocktail can make it more versatile. Mixologists and home bartenders alike appreciate its citrus notes, which blend well with other ingredients. As a result demand for flavored whiskey is expected to grow demand for citrus flavors in the coming years.
Get the data you need at a Fraction of the cost
Personalize your report by choosing insights you need
and save 40%!
Market players are focusing on the development of the products. New products are being introduced, strategic relationships are being formed with existing companies, and small-scale producers are being purchased in promising locations to expand sales. In addition, manufacturers have experimented with various application procedures to create products flavored with whiskey.
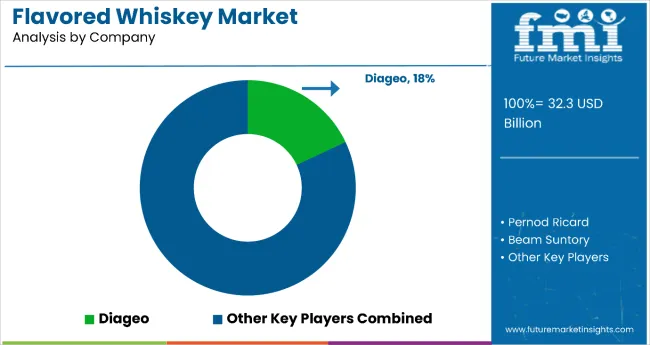
The global player in the flavored Whiskey market is Brown-Forman Corporation, Bacardi Limited, Beam Inc., The Crown Royal Company, The Old Bushmills Distillery Co., Pernod Ricard SA., and Diageo Plc. Currently, the market for flavored whiskey has the presence of many regional players who are manufacturing the flavored whiskey, and tubes.
Attribute | Details |
---|---|
Market Size Value in 2023 | US$ 28,080 million |
Market Forecast Value in 2033 | US$ 57,052.3 million |
Global Growth Rate | 7.3% CAGR |
Forecast Period | 2023 to 2033 |
Historical Data Available for | 2018 to 2022 |
Market Analysis | MT for Volume and US$ million for Value |
Key Regions Covered |
|
Key Countries Covered |
|
Kay Segments Covered |
|
Key Companies Profiles |
|
Customization & Pricing | Available Upon Request |
1. Executive Summary 1.1. Global Market Outlook 1.2. Demand-side Trends 1.3. Supply-side Trends 1.4. Technology Roadmap Analysis 1.5. Analysis and Recommendations 2. Market Overview 2.1. Market Coverage / Taxonomy 2.2. Market Definition / Scope / Limitations 3. Market Background 3.1. Market Dynamics 3.1.1. Drivers 3.1.2. Restraints 3.1.3. Opportunity 3.1.4. Trends 3.2. Scenario Forecast 3.2.1. Demand in Optimistic Scenario 3.2.2. Demand in Likely Scenario 3.2.3. Demand in Conservative Scenario 3.3. Opportunity Map Analysis 3.4. Product Life Cycle Analysis 3.5. Supply Chain Analysis 3.5.1. Supply Side Participants and their Roles 3.5.1.1. Producers 3.5.1.2. Mid-Level Participants (Traders/ Agents/ Brokers) 3.5.1.3. Wholesalers and Distributors 3.5.2. Value Added and Value Created at Node in the Supply Chain 3.5.3. List of Raw Material Suppliers 3.5.4. List of Existing and Potential Buyer’s 3.6. Investment Feasibility Matrix 3.7. Value Chain Analysis 3.7.1. Profit Margin Analysis 3.7.2. Wholesalers and Distributors 3.7.3. Retailers 3.8. PESTLE and Porter’s Analysis 3.9. Regulatory Landscape 3.9.1. By Key Regions 3.9.2. By Key Countries 3.10. Regional Parent Market Outlook 3.11. Production and Consumption Statistics 3.12. Import and Export Statistics 4. Global Market Analysis 2018 to 2022 and Forecast, 2023 to 2033 4.1. Historical Market Size Value (US$ Million) & Volume (Litres) Analysis, 2018 to 2022 4.2. Current and Future Market Size Value (US$ Million) & Volume (Litres) Projections, 2023 to 2033 4.2.1. Y-o-Y Growth Trend Analysis 4.2.2. Absolute $ Opportunity Analysis 5. Global Market Analysis 2018 to 2022 and Forecast 2023 to 2033, By Type 5.1. Introduction / Key Findings 5.2. Historical Market Size Value (US$ Million) & Volume (Litres) Analysis By Type, 2018 to 2022 5.3. Current and Future Market Size Value (US$ Million) & Volume (Litres) Analysis and Forecast By Type, 2023 to 2033 5.3.1. Bourbon 5.3.2. Scotch 5.3.3. Malted 5.3.4. Blended 5.3.5. Other Types 5.4. Y-o-Y Growth Trend Analysis By Type, 2018 to 2022 5.5. Absolute $ Opportunity Analysis By Type, 2023 to 2033 6. Global Market Analysis 2018 to 2022 and Forecast 2023 to 2033, By End Users 6.1. Introduction / Key Findings 6.2. Historical Market Size Value (US$ Million) & Volume (Litres) Analysis By End Users, 2018 to 2022 6.3. Current and Future Market Size Value (US$ Million) & Volume (Litres) Analysis and Forecast By End Users, 2023 to 2033 6.3.1. Retail 6.3.2. HoReCa 6.4. Y-o-Y Growth Trend Analysis By End Users, 2018 to 2022 6.5. Absolute $ Opportunity Analysis By End Users, 2023 to 2033 7. Global Market Analysis 2018 to 2022 and Forecast 2023 to 2033, By Flavor Type 7.1. Introduction / Key Findings 7.2. Historical Market Size Value (US$ Million) & Volume (Litres) Analysis By Flavor Type, 2018 to 2022 7.3. Current and Future Market Size Value (US$ Million) & Volume (Litres) Analysis and Forecast By Flavor Type, 2023 to 2033 7.3.1. Citrus 7.3.2. Honey 7.3.3. Caramel 7.3.4. Cider 7.3.5. Apple 7.4. Y-o-Y Growth Trend Analysis By Flavor Type, 2018 to 2022 7.5. Absolute $ Opportunity Analysis By Flavor Type, 2023 to 2033 8. Global Market Analysis 2018 to 2022 and Forecast 2023 to 2033, By Distribution Channel 8.1. Introduction / Key Findings 8.2. Historical Market Size Value (US$ Million) & Volume (Litres) Analysis By Distribution Channel, 2018 to 2022 8.3. Current and Future Market Size Value (US$ Million) & Volume (Litres) Analysis and Forecast By Distribution Channel, 2023 to 2033 8.3.1. Modern Store Formats 8.3.1.1. Hypermarket/Supermarket 8.3.1.2. Departmental Stores 8.3.1.3. Liquor Stores 8.3.2. Traditional Store Formats 8.3.2.1. Food & Drink Specialty Stores 8.3.2.2. Independent Liquor Stores 8.3.2.3. Others 8.3.3. E-commerce 8.4. Y-o-Y Growth Trend Analysis By Distribution Channel, 2018 to 2022 8.5. Absolute $ Opportunity Analysis By Distribution Channel, 2023 to 2033 9. Global Market Analysis 2018 to 2022 and Forecast 2023 to 2033, By Region 9.1. Introduction 9.2. Historical Market Size Value (US$ Million) & Volume (Litres) Analysis By Region, 2018 to 2022 9.3. Current Market Size Value (US$ Million) & Volume (Litres) Analysis and Forecast By Region, 2023 to 2033 9.3.1. North America 9.3.2. Latin America 9.3.3. Western Europe 9.3.4. Eastern Europe 9.3.5. South Asia and Pacific 9.3.6. East Asia 9.3.7. Middle East and Africa 9.4. Market Attractiveness Analysis By Region 10. North America Market Analysis 2018 to 2022 and Forecast 2023 to 2033, By Country 10.1. Historical Market Size Value (US$ Million) & Volume (Litres) Trend Analysis By Market Taxonomy, 2018 to 2022 10.2. Market Size Value (US$ Million) & Volume (Litres) Forecast By Market Taxonomy, 2023 to 2033 10.2.1. By Country 10.2.1.1. USA 10.2.1.2. Canada 10.2.2. By Type 10.2.3. By End Users 10.2.4. By Flavor Type 10.2.5. By Distribution Channel 10.3. Market Attractiveness Analysis 10.3.1. By Country 10.3.2. By Type 10.3.3. By End Users 10.3.4. By Flavor Type 10.3.5. By Distribution Channel 10.4. Key Takeaways 11. Latin America Market Analysis 2018 to 2022 and Forecast 2023 to 2033, By Country 11.1. Historical Market Size Value (US$ Million) & Volume (Litres) Trend Analysis By Market Taxonomy, 2018 to 2022 11.2. Market Size Value (US$ Million) & Volume (Litres) Forecast By Market Taxonomy, 2023 to 2033 11.2.1. By Country 11.2.1.1. Brazil 11.2.1.2. Mexico 11.2.1.3. Rest of Latin America 11.2.2. By Type 11.2.3. By End Users 11.2.4. By Flavor Type 11.2.5. By Distribution Channel 11.3. Market Attractiveness Analysis 11.3.1. By Country 11.3.2. By Type 11.3.3. By End Users 11.3.4. By Flavor Type 11.3.5. By Distribution Channel 11.4. Key Takeaways 12. Western Europe Market Analysis 2018 to 2022 and Forecast 2023 to 2033, By Country 12.1. Historical Market Size Value (US$ Million) & Volume (Litres) Trend Analysis By Market Taxonomy, 2018 to 2022 12.2. Market Size Value (US$ Million) & Volume (Litres) Forecast By Market Taxonomy, 2023 to 2033 12.2.1. By Country 12.2.1.1. Germany 12.2.1.2. UK 12.2.1.3. France 12.2.1.4. Spain 12.2.1.5. Italy 12.2.1.6. Rest of Western Europe 12.2.2. By Type 12.2.3. By End Users 12.2.4. By Flavor Type 12.2.5. By Distribution Channel 12.3. Market Attractiveness Analysis 12.3.1. By Country 12.3.2. By Type 12.3.3. By End Users 12.3.4. By Flavor Type 12.3.5. By Distribution Channel 12.4. Key Takeaways 13. Eastern Europe Market Analysis 2018 to 2022 and Forecast 2023 to 2033, By Country 13.1. Historical Market Size Value (US$ Million) & Volume (Litres) Trend Analysis By Market Taxonomy, 2018 to 2022 13.2. Market Size Value (US$ Million) & Volume (Litres) Forecast By Market Taxonomy, 2023 to 2033 13.2.1. By Country 13.2.1.1. Poland 13.2.1.2. Russia 13.2.1.3. Czech Republic 13.2.1.4. Romania 13.2.1.5. Rest of Eastern Europe 13.2.2. By Type 13.2.3. By End Users 13.2.4. By Flavor Type 13.2.5. By Distribution Channel 13.3. Market Attractiveness Analysis 13.3.1. By Country 13.3.2. By Type 13.3.3. By End Users 13.3.4. By Flavor Type 13.3.5. By Distribution Channel 13.4. Key Takeaways 14. South Asia and Pacific Market Analysis 2018 to 2022 and Forecast 2023 to 2033, By Country 14.1. Historical Market Size Value (US$ Million) & Volume (Litres) Trend Analysis By Market Taxonomy, 2018 to 2022 14.2. Market Size Value (US$ Million) & Volume (Litres) Forecast By Market Taxonomy, 2023 to 2033 14.2.1. By Country 14.2.1.1. India 14.2.1.2. Bangladesh 14.2.1.3. Australia 14.2.1.4. New Zealand 14.2.1.5. Rest of South Asia and Pacific 14.2.2. By Type 14.2.3. By End Users 14.2.4. By Flavor Type 14.2.5. By Distribution Channel 14.3. Market Attractiveness Analysis 14.3.1. By Country 14.3.2. By Type 14.3.3. By End Users 14.3.4. By Flavor Type 14.3.5. By Distribution Channel 14.4. Key Takeaways 15. East Asia Market Analysis 2018 to 2022 and Forecast 2023 to 2033, By Country 15.1. Historical Market Size Value (US$ Million) & Volume (Litres) Trend Analysis By Market Taxonomy, 2018 to 2022 15.2. Market Size Value (US$ Million) & Volume (Litres) Forecast By Market Taxonomy, 2023 to 2033 15.2.1. By Country 15.2.1.1. China 15.2.1.2. Japan 15.2.1.3. South Korea 15.2.2. By Type 15.2.3. By End Users 15.2.4. By Flavor Type 15.2.5. By Distribution Channel 15.3. Market Attractiveness Analysis 15.3.1. By Country 15.3.2. By Type 15.3.3. By End Users 15.3.4. By Flavor Type 15.3.5. By Distribution Channel 15.4. Key Takeaways 16. Middle East and Africa Market Analysis 2018 to 2022 and Forecast 2023 to 2033, By Country 16.1. Historical Market Size Value (US$ Million) & Volume (Litres) Trend Analysis By Market Taxonomy, 2018 to 2022 16.2. Market Size Value (US$ Million) & Volume (Litres) Forecast By Market Taxonomy, 2023 to 2033 16.2.1. By Country 16.2.1.1. GCC Countries 16.2.1.2. South Africa 16.2.1.3. Israel 16.2.1.4. Rest of MEA 16.2.2. By Type 16.2.3. By End Users 16.2.4. By Flavor Type 16.2.5. By Distribution Channel 16.3. Market Attractiveness Analysis 16.3.1. By Country 16.3.2. By Type 16.3.3. By End Users 16.3.4. By Flavor Type 16.3.5. By Distribution Channel 16.4. Key Takeaways 17. Key Countries Market Analysis 17.1. USA 17.1.1. Pricing Analysis 17.1.2. Market Share Analysis, 2022 17.1.2.1. By Type 17.1.2.2. By End Users 17.1.2.3. By Flavor Type 17.1.2.4. By Distribution Channel 17.2. Canada 17.2.1. Pricing Analysis 17.2.2. Market Share Analysis, 2022 17.2.2.1. By Type 17.2.2.2. By End Users 17.2.2.3. By Flavor Type 17.2.2.4. By Distribution Channel 17.3. Brazil 17.3.1. Pricing Analysis 17.3.2. Market Share Analysis, 2022 17.3.2.1. By Type 17.3.2.2. By End Users 17.3.2.3. By Flavor Type 17.3.2.4. By Distribution Channel 17.4. Mexico 17.4.1. Pricing Analysis 17.4.2. Market Share Analysis, 2022 17.4.2.1. By Type 17.4.2.2. By End Users 17.4.2.3. By Flavor Type 17.4.2.4. By Distribution Channel 17.5. Germany 17.5.1. Pricing Analysis 17.5.2. Market Share Analysis, 2022 17.5.2.1. By Type 17.5.2.2. By End Users 17.5.2.3. By Flavor Type 17.5.2.4. By Distribution Channel 17.6. UK 17.6.1. Pricing Analysis 17.6.2. Market Share Analysis, 2022 17.6.2.1. By Type 17.6.2.2. By End Users 17.6.2.3. By Flavor Type 17.6.2.4. By Distribution Channel 17.7. France 17.7.1. Pricing Analysis 17.7.2. Market Share Analysis, 2022 17.7.2.1. By Type 17.7.2.2. By End Users 17.7.2.3. By Flavor Type 17.7.2.4. By Distribution Channel 17.8. Spain 17.8.1. Pricing Analysis 17.8.2. Market Share Analysis, 2022 17.8.2.1. By Type 17.8.2.2. By End Users 17.8.2.3. By Flavor Type 17.8.2.4. By Distribution Channel 17.9. Italy 17.9.1. Pricing Analysis 17.9.2. Market Share Analysis, 2022 17.9.2.1. By Type 17.9.2.2. By End Users 17.9.2.3. By Flavor Type 17.9.2.4. By Distribution Channel 17.10. Poland 17.10.1. Pricing Analysis 17.10.2. Market Share Analysis, 2022 17.10.2.1. By Type 17.10.2.2. By End Users 17.10.2.3. By Flavor Type 17.10.2.4. By Distribution Channel 17.11. Russia 17.11.1. Pricing Analysis 17.11.2. Market Share Analysis, 2022 17.11.2.1. By Type 17.11.2.2. By End Users 17.11.2.3. By Flavor Type 17.11.2.4. By Distribution Channel 17.12. Czech Republic 17.12.1. Pricing Analysis 17.12.2. Market Share Analysis, 2022 17.12.2.1. By Type 17.12.2.2. By End Users 17.12.2.3. By Flavor Type 17.12.2.4. By Distribution Channel 17.13. Romania 17.13.1. Pricing Analysis 17.13.2. Market Share Analysis, 2022 17.13.2.1. By Type 17.13.2.2. By End Users 17.13.2.3. By Flavor Type 17.13.2.4. By Distribution Channel 17.14. India 17.14.1. Pricing Analysis 17.14.2. Market Share Analysis, 2022 17.14.2.1. By Type 17.14.2.2. By End Users 17.14.2.3. By Flavor Type 17.14.2.4. By Distribution Channel 17.15. Bangladesh 17.15.1. Pricing Analysis 17.15.2. Market Share Analysis, 2022 17.15.2.1. By Type 17.15.2.2. By End Users 17.15.2.3. By Flavor Type 17.15.2.4. By Distribution Channel 17.16. Australia 17.16.1. Pricing Analysis 17.16.2. Market Share Analysis, 2022 17.16.2.1. By Type 17.16.2.2. By End Users 17.16.2.3. By Flavor Type 17.16.2.4. By Distribution Channel 17.17. New Zealand 17.17.1. Pricing Analysis 17.17.2. Market Share Analysis, 2022 17.17.2.1. By Type 17.17.2.2. By End Users 17.17.2.3. By Flavor Type 17.17.2.4. By Distribution Channel 17.18. China 17.18.1. Pricing Analysis 17.18.2. Market Share Analysis, 2022 17.18.2.1. By Type 17.18.2.2. By End Users 17.18.2.3. By Flavor Type 17.18.2.4. By Distribution Channel 17.19. Japan 17.19.1. Pricing Analysis 17.19.2. Market Share Analysis, 2022 17.19.2.1. By Type 17.19.2.2. By End Users 17.19.2.3. By Flavor Type 17.19.2.4. By Distribution Channel 17.20. South Korea 17.20.1. Pricing Analysis 17.20.2. Market Share Analysis, 2022 17.20.2.1. By Type 17.20.2.2. By End Users 17.20.2.3. By Flavor Type 17.20.2.4. By Distribution Channel 17.21. GCC Countries 17.21.1. Pricing Analysis 17.21.2. Market Share Analysis, 2022 17.21.2.1. By Type 17.21.2.2. By End Users 17.21.2.3. By Flavor Type 17.21.2.4. By Distribution Channel 17.22. South Africa 17.22.1. Pricing Analysis 17.22.2. Market Share Analysis, 2022 17.22.2.1. By Type 17.22.2.2. By End Users 17.22.2.3. By Flavor Type 17.22.2.4. By Distribution Channel 17.23. Israel 17.23.1. Pricing Analysis 17.23.2. Market Share Analysis, 2022 17.23.2.1. By Type 17.23.2.2. By End Users 17.23.2.3. By Flavor Type 17.23.2.4. By Distribution Channel 18. Market Structure Analysis 18.1. Competition Dashboard 18.2. Competition Benchmarking 18.3. Market Share Analysis of Top Players 18.3.1. By Regional 18.3.2. By Type 18.3.3. By End Users 18.3.4. By Flavor Type 18.3.5. By Distribution Channel 19. Competition Analysis 19.1. Competition Deep Dive 19.1.1. Brown-Forman Corporation, 19.1.1.1. Overview 19.1.1.2. Product Portfolio 19.1.1.3. Profitability by Market Segments 19.1.1.4. Sales Footprint 19.1.1.5. Strategy Overview 19.1.1.5.1. Marketing Strategy 19.1.1.5.2. Product Strategy 19.1.1.5.3. Channel Strategy 19.1.2. Bacardi Limited 19.1.2.1. Overview 19.1.2.2. Product Portfolio 19.1.2.3. Profitability by Market Segments 19.1.2.4. Sales Footprint 19.1.2.5. Strategy Overview 19.1.2.5.1. Marketing Strategy 19.1.2.5.2. Product Strategy 19.1.2.5.3. Channel Strategy 19.1.3. Beam Inc. 19.1.3.1. Overview 19.1.3.2. Product Portfolio 19.1.3.3. Profitability by Market Segments 19.1.3.4. Sales Footprint 19.1.3.5. Strategy Overview 19.1.3.5.1. Marketing Strategy 19.1.3.5.2. Product Strategy 19.1.3.5.3. Channel Strategy 19.1.4. The Crown Royal Company 19.1.4.1. Overview 19.1.4.2. Product Portfolio 19.1.4.3. Profitability by Market Segments 19.1.4.4. Sales Footprint 19.1.4.5. Strategy Overview 19.1.4.5.1. Marketing Strategy 19.1.4.5.2. Product Strategy 19.1.4.5.3. Channel Strategy 19.1.5. The Old Bushmills Distillery Co. 19.1.5.1. Overview 19.1.5.2. Product Portfolio 19.1.5.3. Profitability by Market Segments 19.1.5.4. Sales Footprint 19.1.5.5. Strategy Overview 19.1.5.5.1. Marketing Strategy 19.1.5.5.2. Product Strategy 19.1.5.5.3. Channel Strategy 19.1.6. Pernod Ricard SA. 19.1.6.1. Overview 19.1.6.2. Product Portfolio 19.1.6.3. Profitability by Market Segments 19.1.6.4. Sales Footprint 19.1.6.5. Strategy Overview 19.1.6.5.1. Marketing Strategy 19.1.6.5.2. Product Strategy 19.1.6.5.3. Channel Strategy 19.1.7. Diageo Plc. 19.1.7.1. Overview 19.1.7.2. Product Portfolio 19.1.7.3. Profitability by Market Segments 19.1.7.4. Sales Footprint 19.1.7.5. Strategy Overview 19.1.7.5.1. Marketing Strategy 19.1.7.5.2. Product Strategy 19.1.7.5.3. Channel Strategy 19.1.8. Allied Blenders & Distillers Pvt Ltd 19.1.8.1. Overview 19.1.8.2. Product Portfolio 19.1.8.3. Profitability by Market Segments 19.1.8.4. Sales Footprint 19.1.8.5. Strategy Overview 19.1.8.5.1. Marketing Strategy 19.1.8.5.2. Product Strategy 19.1.8.5.3. Channel Strategy 19.1.9. Constellation Brands, Inc. 19.1.9.1. Overview 19.1.9.2. Product Portfolio 19.1.9.3. Profitability by Market Segments 19.1.9.4. Sales Footprint 19.1.9.5. Strategy Overview 19.1.9.5.1. Marketing Strategy 19.1.9.5.2. Product Strategy 19.1.9.5.3. Channel Strategy 19.1.10. La Martiniquaise 19.1.10.1. Overview 19.1.10.2. Product Portfolio 19.1.10.3. Profitability by Market Segments 19.1.10.4. Sales Footprint 19.1.10.5. Strategy Overview 19.1.10.5.1. Marketing Strategy 19.1.10.5.2. Product Strategy 19.1.10.5.3. Channel Strategy 20. Assumptions & Acronyms Used 21. Research Methodology
Don't pay for what you don't need
Customize your report by selecting specific countries or regions and save 30%!
Table 01: Global Market Value (US$ Million) Forecast by Region, 2018 to 2033 Table 02: Global Market Volume (Litres) Forecast by Region, 2018 to 2033 Table 03: Global Market Value (US$ Million) Forecast by Type, 2018 to 2033 Table 04: Global Market Volume (Litres) Forecast by Type, 2018 to 2033 Table 05: Global Market Value (US$ Million) Forecast by End Users, 2018 to 2033 Table 06: Global Market Volume (Litres) Forecast by End Users, 2018 to 2033 Table 07: Global Market Value (US$ Million) Forecast by Flavor Type, 2018 to 2033 Table 08: Global Market Volume (Litres) Forecast by Flavor Type, 2018 to 2033 Table 09: Global Market Value (US$ Million) Forecast by Distribution Channel, 2018 to 2033 Table 10: Global Market Volume (Litres) Forecast by Distribution Channel, 2018 to 2033 Table 11: North America Market Value (US$ Million) Forecast by Country, 2018 to 2033 Table 12: North America Market Volume (Litres) Forecast by Country, 2018 to 2033 Table 13: North America Market Value (US$ Million) Forecast by Type, 2018 to 2033 Table 14: North America Market Volume (Litres) Forecast by Type, 2018 to 2033 Table 15: North America Market Value (US$ Million) Forecast by End Users, 2018 to 2033 Table 16: North America Market Volume (Litres) Forecast by End Users, 2018 to 2033 Table 17: North America Market Value (US$ Million) Forecast by Flavor Type, 2018 to 2033 Table 18: North America Market Volume (Litres) Forecast by Flavor Type, 2018 to 2033 Table 19: North America Market Value (US$ Million) Forecast by Distribution Channel, 2018 to 2033 Table 20: North America Market Volume (Litres) Forecast by Distribution Channel, 2018 to 2033 Table 21: Latin America Market Value (US$ Million) Forecast by Country, 2018 to 2033 Table 22: Latin America Market Volume (Litres) Forecast by Country, 2018 to 2033 Table 23: Latin America Market Value (US$ Million) Forecast by Type, 2018 to 2033 Table 24: Latin America Market Volume (Litres) Forecast by Type, 2018 to 2033 Table 25: Latin America Market Value (US$ Million) Forecast by End Users, 2018 to 2033 Table 26: Latin America Market Volume (Litres) Forecast by End Users, 2018 to 2033 Table 27: Latin America Market Value (US$ Million) Forecast by Flavor Type, 2018 to 2033 Table 28: Latin America Market Volume (Litres) Forecast by Flavor Type, 2018 to 2033 Table 29: Latin America Market Value (US$ Million) Forecast by Distribution Channel, 2018 to 2033 Table 30: Latin America Market Volume (Litres) Forecast by Distribution Channel, 2018 to 2033 Table 31: Western Europe Market Value (US$ Million) Forecast by Country, 2018 to 2033 Table 32: Western Europe Market Volume (Litres) Forecast by Country, 2018 to 2033 Table 33: Western Europe Market Value (US$ Million) Forecast by Type, 2018 to 2033 Table 34: Western Europe Market Volume (Litres) Forecast by Type, 2018 to 2033 Table 35: Western Europe Market Value (US$ Million) Forecast by End Users, 2018 to 2033 Table 36: Western Europe Market Volume (Litres) Forecast by End Users, 2018 to 2033 Table 37: Western Europe Market Value (US$ Million) Forecast by Flavor Type, 2018 to 2033 Table 38: Western Europe Market Volume (Litres) Forecast by Flavor Type, 2018 to 2033 Table 39: Western Europe Market Value (US$ Million) Forecast by Distribution Channel, 2018 to 2033 Table 40: Western Europe Market Volume (Litres) Forecast by Distribution Channel, 2018 to 2033 Table 41: Eastern Europe Market Value (US$ Million) Forecast by Country, 2018 to 2033 Table 42: Eastern Europe Market Volume (Litres) Forecast by Country, 2018 to 2033 Table 43: Eastern Europe Market Value (US$ Million) Forecast by Type, 2018 to 2033 Table 44: Eastern Europe Market Volume (Litres) Forecast by Type, 2018 to 2033 Table 45: Eastern Europe Market Value (US$ Million) Forecast by End Users, 2018 to 2033 Table 46: Eastern Europe Market Volume (Litres) Forecast by End Users, 2018 to 2033 Table 47: Eastern Europe Market Value (US$ Million) Forecast by Flavor Type, 2018 to 2033 Table 48: Eastern Europe Market Volume (Litres) Forecast by Flavor Type, 2018 to 2033 Table 49: Eastern Europe Market Value (US$ Million) Forecast by Distribution Channel, 2018 to 2033 Table 50: Eastern Europe Market Volume (Litres) Forecast by Distribution Channel, 2018 to 2033 Table 51: South Asia and Pacific Market Value (US$ Million) Forecast by Country, 2018 to 2033 Table 52: South Asia and Pacific Market Volume (Litres) Forecast by Country, 2018 to 2033 Table 53: South Asia and Pacific Market Value (US$ Million) Forecast by Type, 2018 to 2033 Table 54: South Asia and Pacific Market Volume (Litres) Forecast by Type, 2018 to 2033 Table 55: South Asia and Pacific Market Value (US$ Million) Forecast by End Users, 2018 to 2033 Table 56: South Asia and Pacific Market Volume (Litres) Forecast by End Users, 2018 to 2033 Table 57: South Asia and Pacific Market Value (US$ Million) Forecast by Flavor Type, 2018 to 2033 Table 58: South Asia and Pacific Market Volume (Litres) Forecast by Flavor Type, 2018 to 2033 Table 59: South Asia and Pacific Market Value (US$ Million) Forecast by Distribution Channel, 2018 to 2033 Table 60: South Asia and Pacific Market Volume (Litres) Forecast by Distribution Channel, 2018 to 2033 Table 61: East Asia Market Value (US$ Million) Forecast by Country, 2018 to 2033 Table 62: East Asia Market Volume (Litres) Forecast by Country, 2018 to 2033 Table 63: East Asia Market Value (US$ Million) Forecast by Type, 2018 to 2033 Table 64: East Asia Market Volume (Litres) Forecast by Type, 2018 to 2033 Table 65: East Asia Market Value (US$ Million) Forecast by End Users, 2018 to 2033 Table 66: East Asia Market Volume (Litres) Forecast by End Users, 2018 to 2033 Table 67: East Asia Market Value (US$ Million) Forecast by Flavor Type, 2018 to 2033 Table 68: East Asia Market Volume (Litres) Forecast by Flavor Type, 2018 to 2033 Table 69: East Asia Market Value (US$ Million) Forecast by Distribution Channel, 2018 to 2033 Table 70: East Asia Market Volume (Litres) Forecast by Distribution Channel, 2018 to 2033 Table 71: Middle East and Africa Market Value (US$ Million) Forecast by Country, 2018 to 2033 Table 72: Middle East and Africa Market Volume (Litres) Forecast by Country, 2018 to 2033 Table 73: Middle East and Africa Market Value (US$ Million) Forecast by Type, 2018 to 2033 Table 74: Middle East and Africa Market Volume (Litres) Forecast by Type, 2018 to 2033 Table 75: Middle East and Africa Market Value (US$ Million) Forecast by End Users, 2018 to 2033 Table 76: Middle East and Africa Market Volume (Litres) Forecast by End Users, 2018 to 2033 Table 77: Middle East and Africa Market Value (US$ Million) Forecast by Flavor Type, 2018 to 2033 Table 78: Middle East and Africa Market Volume (Litres) Forecast by Flavor Type, 2018 to 2033 Table 79: Middle East and Africa Market Value (US$ Million) Forecast by Distribution Channel, 2018 to 2033 Table 80: Middle East and Africa Market Volume (Litres) Forecast by Distribution Channel, 2018 to 2033
Figure 01: Global Market Value (US$ Million) by Type, 2023 to 2033 Figure 02: Global Market Value (US$ Million) by End Users, 2023 to 2033 Figure 03: Global Market Value (US$ Million) by Flavor Type, 2023 to 2033 Figure 04: Global Market Value (US$ Million) by Distribution Channel, 2023 to 2033 Figure 05: Global Market Value (US$ Million) by Region, 2023 to 2033 Figure 06: Global Market Value (US$ Million) Analysis by Region, 2018 to 2033 Figure 07: Global Market Volume (Litres) Analysis by Region, 2018 to 2033 Figure 08: Global Market Value Share (%) and BPS Analysis by Region, 2023 to 2033 Figure 09: Global Market Y-o-Y Growth (%) Projections by Region, 2023 to 2033 Figure 10: Global Market Value (US$ Million) Analysis by Type, 2018 to 2033 Figure 11: Global Market Volume (Litres) Analysis by Type, 2018 to 2033 Figure 12: Global Market Value Share (%) and BPS Analysis by Type, 2023 to 2033 Figure 13: Global Market Y-o-Y Growth (%) Projections by Type, 2023 to 2033 Figure 14: Global Market Value (US$ Million) Analysis by End Users, 2018 to 2033 Figure 15: Global Market Volume (Litres) Analysis by End Users, 2018 to 2033 Figure 16: Global Market Value Share (%) and BPS Analysis by End Users, 2023 to 2033 Figure 17: Global Market Y-o-Y Growth (%) Projections by End Users, 2023 to 2033 Figure 18: Global Market Value (US$ Million) Analysis by Flavor Type, 2018 to 2033 Figure 19: Global Market Volume (Litres) Analysis by Flavor Type, 2018 to 2033 Figure 20: Global Market Value Share (%) and BPS Analysis by Flavor Type, 2023 to 2033 Figure 21: Global Market Y-o-Y Growth (%) Projections by Flavor Type, 2023 to 2033 Figure 22: Global Market Value (US$ Million) Analysis by Distribution Channel, 2018 to 2033 Figure 23: Global Market Volume (Litres) Analysis by Distribution Channel, 2018 to 2033 Figure 24: Global Market Value Share (%) and BPS Analysis by Distribution Channel, 2023 to 2033 Figure 25: Global Market Y-o-Y Growth (%) Projections by Distribution Channel, 2023 to 2033 Figure 26: Global Market Attractiveness by Type, 2023 to 2033 Figure 27: Global Market Attractiveness by End Users, 2023 to 2033 Figure 28: Global Market Attractiveness by Flavor Type, 2023 to 2033 Figure 29: Global Market Attractiveness by Distribution Channel, 2023 to 2033 Figure 30: Global Market Attractiveness by Region, 2023 to 2033 Figure 31: North America Market Value (US$ Million) by Type, 2023 to 2033 Figure 32: North America Market Value (US$ Million) by End Users, 2023 to 2033 Figure 33: North America Market Value (US$ Million) by Flavor Type, 2023 to 2033 Figure 34: North America Market Value (US$ Million) by Distribution Channel, 2023 to 2033 Figure 35: North America Market Value (US$ Million) by Country, 2023 to 2033 Figure 36: North America Market Value (US$ Million) Analysis by Country, 2018 to 2033 Figure 37: North America Market Volume (Litres) Analysis by Country, 2018 to 2033 Figure 38: North America Market Value Share (%) and BPS Analysis by Country, 2023 to 2033 Figure 39: North America Market Y-o-Y Growth (%) Projections by Country, 2023 to 2033 Figure 40: North America Market Value (US$ Million) Analysis by Type, 2018 to 2033 Figure 41: North America Market Volume (Litres) Analysis by Type, 2018 to 2033 Figure 42: North America Market Value Share (%) and BPS Analysis by Type, 2023 to 2033 Figure 43: North America Market Y-o-Y Growth (%) Projections by Type, 2023 to 2033 Figure 44: North America Market Value (US$ Million) Analysis by End Users, 2018 to 2033 Figure 45: North America Market Volume (Litres) Analysis by End Users, 2018 to 2033 Figure 46: North America Market Value Share (%) and BPS Analysis by End Users, 2023 to 2033 Figure 47: North America Market Y-o-Y Growth (%) Projections by End Users, 2023 to 2033 Figure 48: North America Market Value (US$ Million) Analysis by Flavor Type, 2018 to 2033 Figure 49: North America Market Volume (Litres) Analysis by Flavor Type, 2018 to 2033 Figure 50: North America Market Value Share (%) and BPS Analysis by Flavor Type, 2023 to 2033 Figure 51: North America Market Y-o-Y Growth (%) Projections by Flavor Type, 2023 to 2033 Figure 52: North America Market Value (US$ Million) Analysis by Distribution Channel, 2018 to 2033 Figure 53: North America Market Volume (Litres) Analysis by Distribution Channel, 2018 to 2033 Figure 54: North America Market Value Share (%) and BPS Analysis by Distribution Channel, 2023 to 2033 Figure 55: North America Market Y-o-Y Growth (%) Projections by Distribution Channel, 2023 to 2033 Figure 56: North America Market Attractiveness by Type, 2023 to 2033 Figure 57: North America Market Attractiveness by End Users, 2023 to 2033 Figure 58: North America Market Attractiveness by Flavor Type, 2023 to 2033 Figure 59: North America Market Attractiveness by Distribution Channel, 2023 to 2033 Figure 60: North America Market Attractiveness by Country, 2023 to 2033 Figure 61: Latin America Market Value (US$ Million) by Type, 2023 to 2033 Figure 62: Latin America Market Value (US$ Million) by End Users, 2023 to 2033 Figure 63: Latin America Market Value (US$ Million) by Flavor Type, 2023 to 2033 Figure 64: Latin America Market Value (US$ Million) by Distribution Channel, 2023 to 2033 Figure 65: Latin America Market Value (US$ Million) by Country, 2023 to 2033 Figure 66: Latin America Market Value (US$ Million) Analysis by Country, 2018 to 2033 Figure 67: Latin America Market Volume (Litres) Analysis by Country, 2018 to 2033 Figure 68: Latin America Market Value Share (%) and BPS Analysis by Country, 2023 to 2033 Figure 69: Latin America Market Y-o-Y Growth (%) Projections by Country, 2023 to 2033 Figure 70: Latin America Market Value (US$ Million) Analysis by Type, 2018 to 2033 Figure 71: Latin America Market Volume (Litres) Analysis by Type, 2018 to 2033 Figure 72: Latin America Market Value Share (%) and BPS Analysis by Type, 2023 to 2033 Figure 73: Latin America Market Y-o-Y Growth (%) Projections by Type, 2023 to 2033 Figure 74: Latin America Market Value (US$ Million) Analysis by End Users, 2018 to 2033 Figure 75: Latin America Market Volume (Litres) Analysis by End Users, 2018 to 2033 Figure 76: Latin America Market Value Share (%) and BPS Analysis by End Users, 2023 to 2033 Figure 77: Latin America Market Y-o-Y Growth (%) Projections by End Users, 2023 to 2033 Figure 78: Latin America Market Value (US$ Million) Analysis by Flavor Type, 2018 to 2033 Figure 79: Latin America Market Volume (Litres) Analysis by Flavor Type, 2018 to 2033 Figure 80: Latin America Market Value Share (%) and BPS Analysis by Flavor Type, 2023 to 2033 Figure 81: Latin America Market Y-o-Y Growth (%) Projections by Flavor Type, 2023 to 2033 Figure 82: Latin America Market Value (US$ Million) Analysis by Distribution Channel, 2018 to 2033 Figure 83: Latin America Market Volume (Litres) Analysis by Distribution Channel, 2018 to 2033 Figure 84: Latin America Market Value Share (%) and BPS Analysis by Distribution Channel, 2023 to 2033 Figure 85: Latin America Market Y-o-Y Growth (%) Projections by Distribution Channel, 2023 to 2033 Figure 86: Latin America Market Attractiveness by Type, 2023 to 2033 Figure 87: Latin America Market Attractiveness by End Users, 2023 to 2033 Figure 88: Latin America Market Attractiveness by Flavor Type, 2023 to 2033 Figure 89: Latin America Market Attractiveness by Distribution Channel, 2023 to 2033 Figure 90: Latin America Market Attractiveness by Country, 2023 to 2033 Figure 91: Western Europe Market Value (US$ Million) by Type, 2023 to 2033 Figure 92: Western Europe Market Value (US$ Million) by End Users, 2023 to 2033 Figure 93: Western Europe Market Value (US$ Million) by Flavor Type, 2023 to 2033 Figure 94: Western Europe Market Value (US$ Million) by Distribution Channel, 2023 to 2033 Figure 95: Western Europe Market Value (US$ Million) by Country, 2023 to 2033 Figure 96: Western Europe Market Value (US$ Million) Analysis by Country, 2018 to 2033 Figure 97: Western Europe Market Volume (Litres) Analysis by Country, 2018 to 2033 Figure 98: Western Europe Market Value Share (%) and BPS Analysis by Country, 2023 to 2033 Figure 99: Western Europe Market Y-o-Y Growth (%) Projections by Country, 2023 to 2033 Figure 100: Western Europe Market Value (US$ Million) Analysis by Type, 2018 to 2033 Figure 101: Western Europe Market Volume (Litres) Analysis by Type, 2018 to 2033 Figure 102: Western Europe Market Value Share (%) and BPS Analysis by Type, 2023 to 2033 Figure 103: Western Europe Market Y-o-Y Growth (%) Projections by Type, 2023 to 2033 Figure 104: Western Europe Market Value (US$ Million) Analysis by End Users, 2018 to 2033 Figure 105: Western Europe Market Volume (Litres) Analysis by End Users, 2018 to 2033 Figure 106: Western Europe Market Value Share (%) and BPS Analysis by End Users, 2023 to 2033 Figure 107: Western Europe Market Y-o-Y Growth (%) Projections by End Users, 2023 to 2033 Figure 108: Western Europe Market Value (US$ Million) Analysis by Flavor Type, 2018 to 2033 Figure 109: Western Europe Market Volume (Litres) Analysis by Flavor Type, 2018 to 2033 Figure 110: Western Europe Market Value Share (%) and BPS Analysis by Flavor Type, 2023 to 2033 Figure 111: Western Europe Market Y-o-Y Growth (%) Projections by Flavor Type, 2023 to 2033 Figure 112: Western Europe Market Value (US$ Million) Analysis by Distribution Channel, 2018 to 2033 Figure 113: Western Europe Market Volume (Litres) Analysis by Distribution Channel, 2018 to 2033 Figure 114: Western Europe Market Value Share (%) and BPS Analysis by Distribution Channel, 2023 to 2033 Figure 115: Western Europe Market Y-o-Y Growth (%) Projections by Distribution Channel, 2023 to 2033 Figure 116: Western Europe Market Attractiveness by Type, 2023 to 2033 Figure 117: Western Europe Market Attractiveness by End Users, 2023 to 2033 Figure 118: Western Europe Market Attractiveness by Flavor Type, 2023 to 2033 Figure 119: Western Europe Market Attractiveness by Distribution Channel, 2023 to 2033 Figure 120: Western Europe Market Attractiveness by Country, 2023 to 2033 Figure 121: Eastern Europe Market Value (US$ Million) by Type, 2023 to 2033 Figure 122: Eastern Europe Market Value (US$ Million) by End Users, 2023 to 2033 Figure 123: Eastern Europe Market Value (US$ Million) by Flavor Type, 2023 to 2033 Figure 124: Eastern Europe Market Value (US$ Million) by Distribution Channel, 2023 to 2033 Figure 125: Eastern Europe Market Value (US$ Million) by Country, 2023 to 2033 Figure 126: Eastern Europe Market Value (US$ Million) Analysis by Country, 2018 to 2033 Figure 127: Eastern Europe Market Volume (Litres) Analysis by Country, 2018 to 2033 Figure 128: Eastern Europe Market Value Share (%) and BPS Analysis by Country, 2023 to 2033 Figure 129: Eastern Europe Market Y-o-Y Growth (%) Projections by Country, 2023 to 2033 Figure 130: Eastern Europe Market Value (US$ Million) Analysis by Type, 2018 to 2033 Figure 131: Eastern Europe Market Volume (Litres) Analysis by Type, 2018 to 2033 Figure 132: Eastern Europe Market Value Share (%) and BPS Analysis by Type, 2023 to 2033 Figure 133: Eastern Europe Market Y-o-Y Growth (%) Projections by Type, 2023 to 2033 Figure 134: Eastern Europe Market Value (US$ Million) Analysis by End Users, 2018 to 2033 Figure 135: Eastern Europe Market Volume (Litres) Analysis by End Users, 2018 to 2033 Figure 136: Eastern Europe Market Value Share (%) and BPS Analysis by End Users, 2023 to 2033 Figure 137: Eastern Europe Market Y-o-Y Growth (%) Projections by End Users, 2023 to 2033 Figure 138: Eastern Europe Market Value (US$ Million) Analysis by Flavor Type, 2018 to 2033 Figure 139: Eastern Europe Market Volume (Litres) Analysis by Flavor Type, 2018 to 2033 Figure 140: Eastern Europe Market Value Share (%) and BPS Analysis by Flavor Type, 2023 to 2033 Figure 141: Eastern Europe Market Y-o-Y Growth (%) Projections by Flavor Type, 2023 to 2033 Figure 142: Eastern Europe Market Value (US$ Million) Analysis by Distribution Channel, 2018 to 2033 Figure 143: Eastern Europe Market Volume (Litres) Analysis by Distribution Channel, 2018 to 2033 Figure 144: Eastern Europe Market Value Share (%) and BPS Analysis by Distribution Channel, 2023 to 2033 Figure 145: Eastern Europe Market Y-o-Y Growth (%) Projections by Distribution Channel, 2023 to 2033 Figure 146: Eastern Europe Market Attractiveness by Type, 2023 to 2033 Figure 147: Eastern Europe Market Attractiveness by End Users, 2023 to 2033 Figure 148: Eastern Europe Market Attractiveness by Flavor Type, 2023 to 2033 Figure 149: Eastern Europe Market Attractiveness by Distribution Channel, 2023 to 2033 Figure 150: Eastern Europe Market Attractiveness by Country, 2023 to 2033 Figure 151: South Asia and Pacific Market Value (US$ Million) by Type, 2023 to 2033 Figure 152: South Asia and Pacific Market Value (US$ Million) by End Users, 2023 to 2033 Figure 153: South Asia and Pacific Market Value (US$ Million) by Flavor Type, 2023 to 2033 Figure 154: South Asia and Pacific Market Value (US$ Million) by Distribution Channel, 2023 to 2033 Figure 155: South Asia and Pacific Market Value (US$ Million) by Country, 2023 to 2033 Figure 156: South Asia and Pacific Market Value (US$ Million) Analysis by Country, 2018 to 2033 Figure 157: South Asia and Pacific Market Volume (Litres) Analysis by Country, 2018 to 2033 Figure 158: South Asia and Pacific Market Value Share (%) and BPS Analysis by Country, 2023 to 2033 Figure 159: South Asia and Pacific Market Y-o-Y Growth (%) Projections by Country, 2023 to 2033 Figure 160: South Asia and Pacific Market Value (US$ Million) Analysis by Type, 2018 to 2033 Figure 161: South Asia and Pacific Market Volume (Litres) Analysis by Type, 2018 to 2033 Figure 162: South Asia and Pacific Market Value Share (%) and BPS Analysis by Type, 2023 to 2033 Figure 163: South Asia and Pacific Market Y-o-Y Growth (%) Projections by Type, 2023 to 2033 Figure 164: South Asia and Pacific Market Value (US$ Million) Analysis by End Users, 2018 to 2033 Figure 165: South Asia and Pacific Market Volume (Litres) Analysis by End Users, 2018 to 2033 Figure 166: South Asia and Pacific Market Value Share (%) and BPS Analysis by End Users, 2023 to 2033 Figure 167: South Asia and Pacific Market Y-o-Y Growth (%) Projections by End Users, 2023 to 2033 Figure 168: South Asia and Pacific Market Value (US$ Million) Analysis by Flavor Type, 2018 to 2033 Figure 169: South Asia and Pacific Market Volume (Litres) Analysis by Flavor Type, 2018 to 2033 Figure 170: South Asia and Pacific Market Value Share (%) and BPS Analysis by Flavor Type, 2023 to 2033 Figure 171: South Asia and Pacific Market Y-o-Y Growth (%) Projections by Flavor Type, 2023 to 2033 Figure 172: South Asia and Pacific Market Value (US$ Million) Analysis by Distribution Channel, 2018 to 2033 Figure 173: South Asia and Pacific Market Volume (Litres) Analysis by Distribution Channel, 2018 to 2033 Figure 174: South Asia and Pacific Market Value Share (%) and BPS Analysis by Distribution Channel, 2023 to 2033 Figure 175: South Asia and Pacific Market Y-o-Y Growth (%) Projections by Distribution Channel, 2023 to 2033 Figure 176: South Asia and Pacific Market Attractiveness by Type, 2023 to 2033 Figure 177: South Asia and Pacific Market Attractiveness by End Users, 2023 to 2033 Figure 178: South Asia and Pacific Market Attractiveness by Flavor Type, 2023 to 2033 Figure 179: South Asia and Pacific Market Attractiveness by Distribution Channel, 2023 to 2033 Figure 180: South Asia and Pacific Market Attractiveness by Country, 2023 to 2033 Figure 181: East Asia Market Value (US$ Million) by Type, 2023 to 2033 Figure 182: East Asia Market Value (US$ Million) by End Users, 2023 to 2033 Figure 183: East Asia Market Value (US$ Million) by Flavor Type, 2023 to 2033 Figure 184: East Asia Market Value (US$ Million) by Distribution Channel, 2023 to 2033 Figure 185: East Asia Market Value (US$ Million) by Country, 2023 to 2033 Figure 186: East Asia Market Value (US$ Million) Analysis by Country, 2018 to 2033 Figure 187: East Asia Market Volume (Litres) Analysis by Country, 2018 to 2033 Figure 188: East Asia Market Value Share (%) and BPS Analysis by Country, 2023 to 2033 Figure 189: East Asia Market Y-o-Y Growth (%) Projections by Country, 2023 to 2033 Figure 190: East Asia Market Value (US$ Million) Analysis by Type, 2018 to 2033 Figure 191: East Asia Market Volume (Litres) Analysis by Type, 2018 to 2033 Figure 192: East Asia Market Value Share (%) and BPS Analysis by Type, 2023 to 2033 Figure 193: East Asia Market Y-o-Y Growth (%) Projections by Type, 2023 to 2033 Figure 194: East Asia Market Value (US$ Million) Analysis by End Users, 2018 to 2033 Figure 195: East Asia Market Volume (Litres) Analysis by End Users, 2018 to 2033 Figure 196: East Asia Market Value Share (%) and BPS Analysis by End Users, 2023 to 2033 Figure 197: East Asia Market Y-o-Y Growth (%) Projections by End Users, 2023 to 2033 Figure 198: East Asia Market Value (US$ Million) Analysis by Flavor Type, 2018 to 2033 Figure 199: East Asia Market Volume (Litres) Analysis by Flavor Type, 2018 to 2033 Figure 200: East Asia Market Value Share (%) and BPS Analysis by Flavor Type, 2023 to 2033 Figure 201: East Asia Market Y-o-Y Growth (%) Projections by Flavor Type, 2023 to 2033 Figure 202: East Asia Market Value (US$ Million) Analysis by Distribution Channel, 2018 to 2033 Figure 203: East Asia Market Volume (Litres) Analysis by Distribution Channel, 2018 to 2033 Figure 204: East Asia Market Value Share (%) and BPS Analysis by Distribution Channel, 2023 to 2033 Figure 205: East Asia Market Y-o-Y Growth (%) Projections by Distribution Channel, 2023 to 2033 Figure 206: East Asia Market Attractiveness by Type, 2023 to 2033 Figure 207: East Asia Market Attractiveness by End Users, 2023 to 2033 Figure 208: East Asia Market Attractiveness by Flavor Type, 2023 to 2033 Figure 209: East Asia Market Attractiveness by Distribution Channel, 2023 to 2033 Figure 210: East Asia Market Attractiveness by Country, 2023 to 2033 Figure 211: Middle East and Africa Market Value (US$ Million) by Type, 2023 to 2033 Figure 212: Middle East and Africa Market Value (US$ Million) by End Users, 2023 to 2033 Figure 213: Middle East and Africa Market Value (US$ Million) by Flavor Type, 2023 to 2033 Figure 214: Middle East and Africa Market Value (US$ Million) by Distribution Channel, 2023 to 2033 Figure 215: Middle East and Africa Market Value (US$ Million) by Country, 2023 to 2033 Figure 216: Middle East and Africa Market Value (US$ Million) Analysis by Country, 2018 to 2033 Figure 217: Middle East and Africa Market Volume (Litres) Analysis by Country, 2018 to 2033 Figure 218: Middle East and Africa Market Value Share (%) and BPS Analysis by Country, 2023 to 2033 Figure 219: Middle East and Africa Market Y-o-Y Growth (%) Projections by Country, 2023 to 2033 Figure 220: Middle East and Africa Market Value (US$ Million) Analysis by Type, 2018 to 2033 Figure 221: Middle East and Africa Market Volume (Litres) Analysis by Type, 2018 to 2033 Figure 222: Middle East and Africa Market Value Share (%) and BPS Analysis by Type, 2023 to 2033 Figure 223: Middle East and Africa Market Y-o-Y Growth (%) Projections by Type, 2023 to 2033 Figure 224: Middle East and Africa Market Value (US$ Million) Analysis by End Users, 2018 to 2033 Figure 225: Middle East and Africa Market Volume (Litres) Analysis by End Users, 2018 to 2033 Figure 226: Middle East and Africa Market Value Share (%) and BPS Analysis by End Users, 2023 to 2033 Figure 227: Middle East and Africa Market Y-o-Y Growth (%) Projections by End Users, 2023 to 2033 Figure 228: Middle East and Africa Market Value (US$ Million) Analysis by Flavor Type, 2018 to 2033 Figure 229: Middle East and Africa Market Volume (Litres) Analysis by Flavor Type, 2018 to 2033 Figure 230: Middle East and Africa Market Value Share (%) and BPS Analysis by Flavor Type, 2023 to 2033 Figure 231: Middle East and Africa Market Y-o-Y Growth (%) Projections by Flavor Type, 2023 to 2033 Figure 232: Middle East and Africa Market Value (US$ Million) Analysis by Distribution Channel, 2018 to 2033 Figure 233: Middle East and Africa Market Volume (Litres) Analysis by Distribution Channel, 2018 to 2033 Figure 234: Middle East and Africa Market Value Share (%) and BPS Analysis by Distribution Channel, 2023 to 2033 Figure 235: Middle East and Africa Market Y-o-Y Growth (%) Projections by Distribution Channel, 2023 to 2033 Figure 236: Middle East and Africa Market Attractiveness by Type, 2023 to 2033 Figure 237: Middle East and Africa Market Attractiveness by End Users, 2023 to 2033 Figure 238: Middle East and Africa Market Attractiveness by Flavor Type, 2023 to 2033 Figure 239: Middle East and Africa Market Attractiveness by Distribution Channel, 2023 to 2033 Figure 240: Middle East and Africa Market Attractiveness by Country, 2023 to 2033
Recommendations
Explore Food and Beverage Insights
View Reports