Agave Syrup Market Size and Share Forecast Outlook 2025 to 2035

The global agave syrup market is projected to grow from USD 645 million in 2025 to USD 1,233.6 million by 2035, reflecting a CAGR of 6.7%.

Quick Stats of Agave Syrup Market

  • Market Value (2025): USD 645 million
  • Forecast Value (2035): USD 1,233.6 million
  • Forecast CAGR (2025-2035): 6.7%
  • Leading Segment in 2025: Light Agave Syrup (60%)
  • Key Growth Region: South Asia
  • Top Key Players: Malt Products Corporation, The IIDEA Company, Swanson Health Products Inc., Loving Earth Pty Ltd, Domino Foods Inc.
Attributes Description
Industry Size (2025E) USD 645 million
Industry Value (2035F) USD 1,233.6 million
CAGR (2025 to 2035) 6.7%

This expansion is being driven by the increasing consumer preference for natural, low-glycemic sweeteners as a healthier alternative to refined sugars. agave sweetener, extracted from the agave plant, is being recognized for its mild sweetness, low glycemic index, and versatility, which make it an attractive option for health-conscious individuals. The industry is being further supported by the growing trend of clean-label and natural products, with agave sweetener being increasingly incorporated into a variety of food and beverage offerings.

The agave syrup industry holds a 5-7% share of the broader natural sweeteners industry, which includes honey, maple syrup, and stevia. In the organic food and beverage industry, agave sweetener captures approximately 3-4% of the segment, driven by consumer preference for organic, low-glycemic alternatives. Within the plant-based & vegan products industry, agave sweetener share is around 2-3%, as it is a favored sweetener in vegan food and beverages.

In the functional foods & beverages industry, it makes up 1-2%, mainly used in products targeting blood sugar regulation and weight management. Lastly, in the clean label ingredients industry, agave sweetener constitutes around 1-2%, where it’s valued for its simple and natural ingredient profile. Despite its position, agave sweetener aligns well with health-conscious trends.

In July 2023, Ciranda introduced three new syrups, Agave Syrup AL40, Agave Syrup IN10, and Tapioca Syrup RS18, to help brands meet consumer demand for reduced-sugar products. These syrups offer lower sugar and calorie content while maintaining taste and quality. They can be used individually or combined in various applications, including desserts, bars, ice cream, cereals, beverages, and gummies. The launch aligns with the growing trend for healthier, reduced-sugar formulations in the food and beverage sector.

Analyzing the Agave Syrup Market by Top Investment Segments

The agave sweetenerindustry is segmented by product type, function, application, and distribution channel. Light agave syrup leads the product type segment with a 60% share, while sweeteners dominate the function segment with 70%. The bakery application holds the largest share at 35%, and online retail is projected to lead the distribution channel with a 30% share.

Light Agave Syrup to Lead Demand by Product Type

Light agave syrup is projected to capture the largest share in 2025, with an estimated 60% share. This dominance is driven by its versatile use in various products, particularly in beverages, snacks, and health-conscious desserts.

Major companies such as Wholesome Sweeteners and Nature's Way are increasingly incorporating light agave sweetener into their offerings, driven by the demand for low-glycemic, plant-based sweeteners. The growing trend of clean-label and natural products is further cementing light agave sweetener role as the preferred choice for health-conscious consumers.
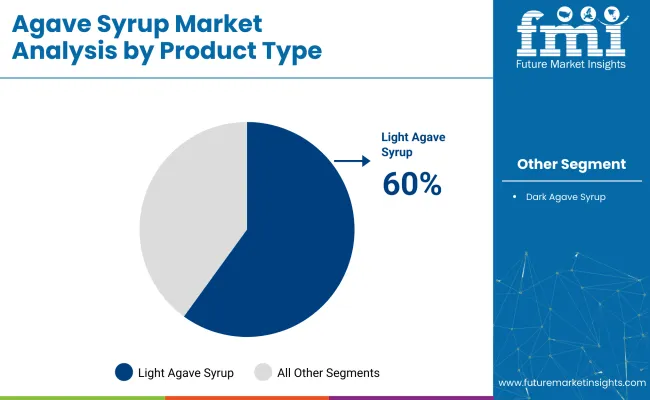
  • Light agave sweetener is preferred for its versatility in various food and beverage products.
  • Low glycemic index makes it an attractive option for blood sugar management.
  • Growing clean-label trends are driving the demand for light agave sweetener.

Agave Syrup Market By Product Type

Sweeteners Expected to Dominate by Function Segment

The sweetener segment is expected to dominate the sector in 2025, capturing around 70% of the share. This growth is driven by the increasing demand for natural, low-glycemic alternatives to refined sugars.

Companies like Pyure Brands and Maretai Organics are investing in agave sweetener to cater to health-conscious consumers seeking to reduce their sugar intake. With its natural composition and minimal processing, agave sweetener is gaining traction as a healthier sweetener option for various food and beverage formulations.
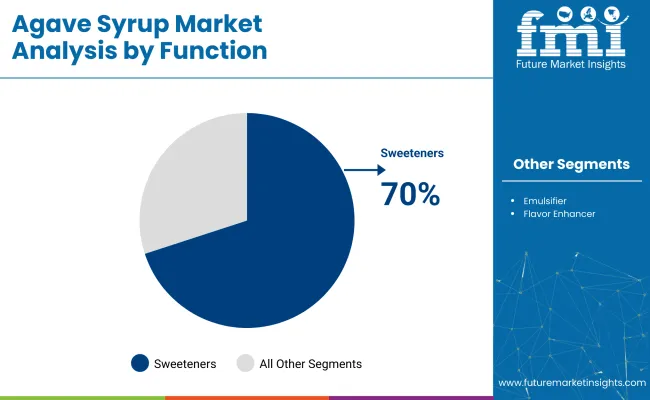
  • Sweeteners hold the largest share due to demand for low-glycemic alternatives.
  • Growing consumer preference for natural sweeteners is driving agave sweetener's adoption.
  • Health-conscious demand continues to support the dominance of the sweetener segment.

Agave Syrup Market By Function

Bakery Sector to Hold Significant Share in Agave Syrup Applications

The bakery sector is expected to hold a significant 35% share in theindustry by 2025. This segment’s growth is fueled by the increasing demand for healthier ingredients in baked goods. Agave sweetener’s versatility and its ability to replace refined sugars in cakes, cookies, and other baked goods have made it a preferred choice among manufacturers.

Companies like Wholesome Sweeteners and Nature's Way are tapping into this demand, offering agave sweetner as a clean-label alternative to conventional sweeteners, catering to the growing trend of health-focused baking.

  • Bakery is the largest application segment for agave sweetener.
  • Growing demand for healthier baking options is fueling agave sweetener's adoption in bakery products.
  • Health-focused consumers continue to drive demand for natural sweeteners in baked goods.

Online Retail to Lead Agave Syrup Distribution Channels

Online retail is expected to capture 30% of the industry share in 2025. The rise of e-commerce platforms, such as Amazon and Whole Foods, is making it easier for consumers to access agave sweetner products, especially in health-conscious communities.

The convenience of online shopping, combined with the ability to compare prices and read reviews, is contributing to the growing demand for agave sweetener. As consumers increasingly prefer shopping from home, online retail will continue to play a key role in expanding agave sweetener's industry reach.

  • Online retail provides the convenience and accessibility that is reshaping the buying process for agave sweetener.
  • E-commerce growth is playing a pivotal role in expanding agave sweetener’s reach to a broader consumer base.
  • Health-focused products are increasingly being sold online, boosting agave sweetener availability to positionthe industry.

The agave syrup market is experiencing growth driven by rising consumer demand for natural, low-glycemic sweeteners and plant-based ingredients. Manufacturers are focusing on clean-label products and innovations to cater to health-conscious consumers. The increasing popularity of organic and vegan alternatives is driving product development.

Top Agave Syrup Market Dynamics

Expanding Demand from Food and Beverage Applications

Agave sweetenersare increasingly used as a healthier alternative to refined sugars, particularly in food and beverage products. It is favoured for its low glycemic index, making it a preferred choice for blood sugar regulation. The growing demand for plant-based and organic products is further boosting its adoption.

  • Agave sweetener is used as a low-glycemic sweetener in food and beverages.
  • Increasing demand for organic and plant-based products is driving adoption.
  • The rise in health-conscious consumers supports the use of agave sweetener in functional foods.

Innovation in Product Development and Production

The agave sweetner industry is seeing innovation in product types and production processes. New variations, such as dark and light agave sweetener, are being introduced to cater to diverse consumer preferences. Advancements in production technology are improving efficiency, reducing costs, and enhancing the accessibility of agave sweetener.

  • Dark and light agave sweeteners are being developed for different taste profiles.
  • Production advancements are improving manufacturing efficiency and reducing costs.
  • New formulations are expanding the applications of agave sweetener in various food products.

Analyzing Top Countries Manufacturing, Distributing, and Generating Demand for Agave Syrup

Country CAGR (2025 to 2035)
USA 6.5%
Germany 7.0%
China 5.2%
Japan 5.4%
India 9.0%

The agave syrup industry shows varied growth across OECD and BRICS countries. Among the OECD countries, the United States and Germany show steady growth, with respective CAGRs of 6.5% and 7.0%, driven by rising demand for natural, organic sweeteners and a health-conscious population. Germany leads within the OECD, benefiting from a strong trend toward functional and organic foods.

In contrast, Japan experiences slower growth at 5.4%, as agave sweetener remains a premium product amidst already established sweetener alternatives. In the BRICS group, India stands out with a robust 9.0% CAGR, fueled by a rapidly growing health-conscious middle class and rising interest in natural sweeteners. China shows moderate growth at 5.2%, driven by a gradual shift towards healthier alternatives. India’s growth highlights the shift in global demand towards emerging markets.

The report covers a detailed analysis of 40+ countries, and the top five countries have been shared as a reference.

Analysis of Agave Syrup Market in India

Sales of agave sweetener in India are expected to grow at a 9.0% CAGR through 2035. The growth is driven by an increasing awareness of natural sweeteners, as well as the rising health-conscious population seeking sugar alternatives.

The demand is further supported by growing disposable incomes and urbanization. With the adoption of healthier dietary habits and government initiatives promoting wellness, agave sweetener is becoming a popular choice in India. Local manufacturers are increasingly diversifying their product offerings to meet this demand, while e-commerce platforms are helping to expand product accessibility.

  • Increasing preference for natural, low-glycemic sweeteners.
  • E-commerce platforms expanding product availability.
  • Growth in health-conscious consumer behavior supporting demand.

Demand Forecast for Agave Syrup Market in the United States

The USA agave sweetenerindustry is projected to grow at a 6.5% CAGR through 2035. This growth is fueled by the growing consumer demand for natural sweeteners as part of the broader trend toward healthy eating. Agave sweetener, known for its low glycemic index, is increasingly being used as a sugar substitute in food and beverages. Major brands are offering diverse products, while the spread of health and wellness awareness is accelerating industry growth. Retail expansion and the increasing availability of this syrup in retail stores and health food stores are contributing to growth.

  • Growing demand for natural and low-glycemic sweeteners.
  • Health and wellness awareness driving product adoption.
  • Retail expansion and retail store availability fueling growth.

Growth Analysis of Agave Syrup Market in Germany

Demand for agave sweetener in Germany is expected to grow at a 7.0% CAGR through 2035. The demand for natural sweeteners is being driven by consumer preference for organic and sustainable food products. German consumers are becoming more health-conscious, seeking sugar alternatives to manage blood sugar levels. The increasing popularity of plant-based diets is further supporting industry growth. Local producers are embracing this demand by offering organic Agave sweetener, and retail channels, including supermarkets and health food stores, are expanding the availability of Agave sweetener products.

  • Increased demand for organic and sustainable food products.
  • Rising health-conscious consumer base.
  • Growth of plant-based diets supporting agave sweetener adoption.

Future Outlook for the Agave Syrup Market in China

Sales of agave sweetener in China is projected to grow at a 5.2% CAGR through 2035. The industry is being fueled by a growing shift toward healthy living and an increasing awareness of the health benefits of natural sweeteners. Demand is rising as consumers look for alternatives to refined sugar. Major food and beverage companies are incorporating Agave sweetener into their products to cater to the health-conscious population. The rise in disposable income and the expanding middle class are also contributing to industry growth.

  • Growing consumer awareness about the benefits of natural sweeteners.
  • Increasing demand for healthier alternatives to refined sugar.
  • Expansion of the middle class is driving industry growth.

Agave Syrup Market Growth Outlook in Japan

Demand foragave sweetener in Japan is projected to grow at a 5.4% CAGR through 2035. Growth is being driven by the increasing health-conscious population and a shift towards natural sweeteners as part of a broader wellness trend. Agave sweetener is gaining popularity due to its low glycemic index, and demand is particularly strong among consumers with a focus on weight management and diabetes prevention. Local companies are incorporating Agave sweetener in various food and beverage products, while e-commerce and retail store channels are improving accessibility.
  • Rising consumer interest in health-conscious eating habits.
  • Increasing popularity of low glycemic index sweeteners.
  • Growing use in weight management and diabetes-prevention products.

Leading Agave Syrup Market Suppliers

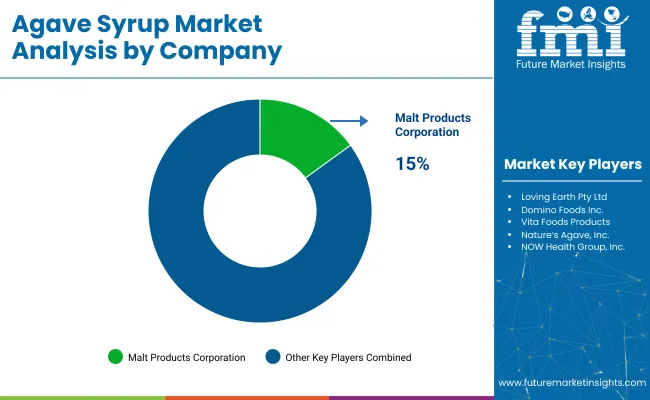
Agave Syrup Market By Company

The agave sweetenerindustry is competitive, featuring leading players, key participants, and emerging companies. Malt Products Corporation, Sisana Sweeteners, and Maretai Organics Australia are key industry leaders, with strong portfolios including light, dark, and organic agave sweeteners. Their dominance is supported by strategic investments in sustainability, innovation, and distribution networks. Emerging players like Ciranda Inc. and Dipasa USA Inc. contribute to indsutry growth by offering specialized and organic agave sweetener options, enhancing product variety, and catering to health-conscious consumers.

Recent Industry News

  • In March 2025, New Water Capital acquired Dutch Gold Honey, a top USA producer of ethically sourced honey. This acquisition may influence Dutch Gold's product offerings, including potential expansions into agave sweetener products
  • As of May 2025, Wholesome Sweeteners is actively expanding its presence in the organic agave sweetener market. The company offers products like the Organic Fair Trade Blue Agave Nectar, which is 25% sweeter than sugar and suitable for various culinary applications.

Leading Players in Agave Syrup Market

  • Malt Products Corporation
  • The IIDEA Company
  • Swanson Health Products Inc.
  • Loving Earth Pty Ltd
  • Domino Foods Inc.
  • Vita Foods Products
  • Nature’s Agave, Inc.
  • NOW Health Group, Inc.
  • Groovy Food Company Ltd
  • The Colibree Company, Inc.
  • The American Beverage Marketers
  • Madhava Natural Sweeteners
  • Global Goods Inc.
  • The Simple Syrup Co.
  • SunOpta Inc.
  • 21.1Natura BioFoods
  • Other Players (On Additional Request)

Report Scope Table

Report Attributes Details
Industry Size (2025) USD 645 million
Industry Size (2035) USD 1,233.6 million
CAGR (2025 to 2035) 6.7%
Base Year for Estimation 2024
Historical Period 2020 to 2024
Projections Period 2025 to 2035
Quantitative Units USD million for value and thousand metric tons for volume
Product Types Analyzed (Segment 1) Light, Dark
Functions Analyzed (Segment 2) Emulsifier, Sweetener, Flavor Enhancer
Applications Analyzed (Segment 3) Bakery, Beverages, Confectionery, Others (Marinades, Salads)
Sales Channels Analyzed (Segment 4) Direct, Indirect (Store-based Retailing, Online Retail)
Regions Covered North America, Latin America, Western Europe, Eastern Europe, East Asia, South Asia & Pacific, Central Asia, Russia & Belarus, Balkan & Baltic Countries, Middle East & Africa
Countries Covered United States, Canada, Mexico, Brazil, Germany, United Kingdom, France, Italy, Spain, China, India, Japan, South Korea, Australia, Russia, Saudi Arabia, UAE, South Africa
Key Players Malt Products Corporation, The IIDEA Company, Swanson Health Products Inc., Loving Earth Pty Ltd, Domino Foods Inc., Vita Foods Products, Nature’s Agave, Inc., NOW Health Group, Inc., Groovy Food Company Ltd, The Colibree Company, Inc., The American Beverage Marketers, Madhava Natural Sweeteners, Global Goods Inc., The Simple Syrup Co., SunOpta Inc., 21.1Natura BioFoods, Other Players (On Additional Request)
Additional Attributes Dollar sales, share by product type and application, increasing demand in food and beverage sectors, rise in demand for natural sweeteners, clean label trends, regional market dynamics

Key Segments

By Product Type:

The industry is segmented into light and dark agave sweetener.

By Function:

The industry includes emulsifier, sweetener, and flavor enhancer functions.

By Application:

Agave sweetener is used in bakery, beverages, confectionery, and other sectors (marinades, salads).

By Distribution Channel:

The industry is segmented into direct and indirect sales channels (store-based retailing, online retail).

By Region:

Geographically segmented into North America, Latin America, Western Europe, Eastern Europe, East Asia, South Asia & Pacific, Central Asia, Russia and Belarus, Balkan & Baltic countries, and the Middle East & Africa.

Table of Content

  1. Executive Summary
    • Global Market Outlook
    • Demand-side Trends
    • Supply-side Trends
    • Technology Roadmap Analysis
    • Analysis and Recommendations
  2. Market Overview
    • Market Coverage / Taxonomy
    • Market Definition / Scope / Limitations
  3. Market Background
    • Market Dynamics
      • Drivers
      • Restraints
      • Opportunity
      • Trends
    • Scenario Forecast
      • Demand in Optimistic Scenario
      • Demand in Likely Scenario
      • Demand in Conservative Scenario
    • Opportunity Map Analysis
    • Product Life Cycle Analysis
    • Supply Chain Analysis
      • Supply Side Participants and their Roles
        • Producers
        • Mid-Level Participants (Traders/ Agents/ Brokers)
        • Wholesalers and Distributors
      • Value Added and Value Created at Node in the Supply Chain
      • List of Raw Material Suppliers
      • List of Existing and Potential Buyer’s
    • Investment Feasibility Matrix
    • Value Chain Analysis
      • Profit Margin Analysis
      • Wholesalers and Distributors
      • Retailers
    • PESTLE and Porter’s Analysis
    • Regulatory Landscape
      • By Key Regions
      • By Key Countries
    • Regional Parent Market Outlook
    • Production and Consumption Statistics
    • Import and Export Statistics
  4. Global Market Analysis 2020-2024 and Forecast, 2025-2035
    • Historical Market Size Value (USD Million) & Volume (Thousand Metric Tons) Analysis, 2020-2024
    • Current and Future Market Size Value (USD Million) & Volume (Thousand Metric Tons) Projections, 2025-2035
      • Y-o-Y Growth Trend Analysis
      • Absolute $ Opportunity Analysis
  5. Global Market Pricing Analysis 2020-2024 and Forecast 2025-2035
  6. Global Market Analysis 2020-2024 and Forecast 2025-2035, By Product Type
    • Introduction / Key Findings
    • Historical Market Size Value (USD Million) & Volume (Thousand Metric Tons) Analysis By Product Type, 2020-2024
    • Current and Future Market Size Value (USD Million) & Volume (Thousand Metric Tons) Analysis and Forecast By Product Type, 2025-2035
      • Light
      • Dark
    • Y-o-Y Growth Trend Analysis By Product Type, 2020-2024
    • Absolute $ Opportunity Analysis By Product Type, 2025-2035
  7. Global Market Analysis 2020-2024 and Forecast 2025-2035, By Function
    • Introduction / Key Findings
    • Historical Market Size Value (USD Million) & Volume (Thousand Metric Tons) Analysis By Function, 2020-2024
    • Current and Future Market Size Value (USD Million) & Volume (Thousand Metric Tons) Analysis and Forecast By Function, 2025-2035
      • Emulsifier
      • Sweetener
      • Flavor Enhancer
    • Y-o-Y Growth Trend Analysis By Function, 2020-2024
    • Absolute $ Opportunity Analysis By Function, 2025-2035
  8. Global Market Analysis 2020-2024 and Forecast 2025-2035, By Application
    • Introduction / Key Findings
    • Historical Market Size Value (USD Million) & Volume (Thousand Metric Tons) Analysis By Application, 2020-2024
    • Current and Future Market Size Value (USD Million) & Volume (Thousand Metric Tons) Analysis and Forecast By Application, 2025-2035
      • Bakery
      • Beverages
      • Confectionery
      • Others
        • Marinades
        • Salads
    • Y-o-Y Growth Trend Analysis By Application, 2020-2024
    • Absolute $ Opportunity Analysis By Application, 2025-2035
  9. Global Market Analysis 2020-2024 and Forecast 2025-2035, By Distribution Channel
    • Introduction / Key Findings
    • Historical Market Size Value (USD Million) & Volume (Thousand Metric Tons) Analysis By Distribution Channel, 2020-2024
    • Current and Future Market Size Value (USD Million) & Volume (Thousand Metric Tons) Analysis and Forecast By Distribution Channel, 2025-2035
      • Direct
      • Indirect
        • Store-based Retailing
        • Online Retail
    • Y-o-Y Growth Trend Analysis By Distribution Channel, 2020-2024
    • Absolute $ Opportunity Analysis By Distribution Channel, 2025-2035
  10. Global Market Analysis 2020-2024 and Forecast 2025-2035, By Region
    • Introduction
    • Historical Market Size Value (USD Million) & Volume (Thousand Metric Tons) Analysis By Region, 2020-2024
    • Current Market Size Value (USD Million) & Volume (Thousand Metric Tons) Analysis and Forecast By Region, 2025-2035
      • North America
      • Latin America
      • Western Europe
      • Eastern Europe
      • East Asia
      • South Asia & Pacific
      • Middle East and Africa
    • Market Attractiveness Analysis By Region
  11. North America Market Analysis 2020-2024 and Forecast 2025-2035, By Country
    • Historical Market Size Value (USD Million) & Volume (Thousand Metric Tons) Trend Analysis By Market Taxonomy, 2020-2024
    • Market Size Value (USD Million) & Volume (Thousand Metric Tons) Forecast By Market Taxonomy, 2025-2035
      • By Country
        • USA
        • Canada
        • Mexico
      • By Product Type
      • By Function
      • By Application
      • By Distribution Channel
    • Market Attractiveness Analysis
      • By Country
      • By Product Type
      • By Function
      • By Application
      • By Distribution Channel
    • Key Takeaways
  12. Latin America Market Analysis 2020-2024 and Forecast 2025-2035, By Country
    • Historical Market Size Value (USD Million) & Volume (Thousand Metric Tons) Trend Analysis By Market Taxonomy, 2020-2024
    • Market Size Value (USD Million) & Volume (Thousand Metric Tons) Forecast By Market Taxonomy, 2025-2035
      • By Country
        • Brazil
        • Argentina
        • Rest of LATAM
      • By Product Type
      • By Function
      • By Application
      • By Distribution Channel
    • Market Attractiveness Analysis
      • By Country
      • By Product Type
      • By Function
      • By Application
      • By Distribution Channel
    • Key Takeaways
  13. Western Europe Market Analysis 2020-2024 and Forecast 2025-2035, By Country
    • Historical Market Size Value (USD Million) & Volume (Thousand Metric Tons) Trend Analysis By Market Taxonomy, 2020-2024
    • Market Size Value (USD Million) & Volume (Thousand Metric Tons) Forecast By Market Taxonomy, 2025-2035
      • By Country
        • Germany
        • Italy
        • France
        • UK
        • Spain
        • BENELUX
        • Nordic
        • Rest of W.Europe
      • By Product Type
      • By Function
      • By Application
      • By Distribution Channel
    • Market Attractiveness Analysis
      • By Country
      • By Product Type
      • By Function
      • By Application
      • By Distribution Channel
    • Key Takeaways
  14. Eastern Europe Market Analysis 2020-2024 and Forecast 2025-2035, By Country
    • Historical Market Size Value (USD Million) & Volume (Thousand Metric Tons) Trend Analysis By Market Taxonomy, 2020-2024
    • Market Size Value (USD Million) & Volume (Thousand Metric Tons) Forecast By Market Taxonomy, 2025-2035
      • By Country
        • Russia
        • Hungary
        • Poland
        • Balkan & Baltics
        • Rest of E. Europe
      • By Product Type
      • By Function
      • By Application
      • By Distribution Channel
    • Market Attractiveness Analysis
      • By Country
      • By Product Type
      • By Function
      • By Application
      • By Distribution Channel
    • Key Takeaways
  15. East Asia Market Analysis 2020-2024 and Forecast 2025-2035, By Country
    • Historical Market Size Value (USD Million) & Volume (Thousand Metric Tons) Trend Analysis By Market Taxonomy, 2020-2024
    • Market Size Value (USD Million) & Volume (Thousand Metric Tons) Forecast By Market Taxonomy, 2025-2035
      • By Country
        • China
        • Japan
        • South Korea
      • By Product Type
      • By Function
      • By Application
      • By Distribution Channel
    • Market Attractiveness Analysis
      • By Country
      • By Product Type
      • By Function
      • By Application
      • By Distribution Channel
    • Key Takeaways
  16. South Asia & Pacific Market Analysis 2020-2024 and Forecast 2025-2035, By Country
    • Historical Market Size Value (USD Million) & Volume (Thousand Metric Tons) Trend Analysis By Market Taxonomy, 2020-2024
    • Market Size Value (USD Million) & Volume (Thousand Metric Tons) Forecast By Market Taxonomy, 2025-2035
      • By Country
        • India
        • Australia & New Zealand
        • ASEAN
        • Rest of SAP
      • By Product Type
      • By Function
      • By Application
      • By Distribution Channel
    • Market Attractiveness Analysis
      • By Country
      • By Product Type
      • By Function
      • By Application
      • By Distribution Channel
    • Key Takeaways
  17. Middle East and Africa Market Analysis 2020-2024 and Forecast 2025-2035, By Country
    • Historical Market Size Value (USD Million) & Volume (Thousand Metric Tons) Trend Analysis By Market Taxonomy, 2020-2024
    • Market Size Value (USD Million) & Volume (Thousand Metric Tons) Forecast By Market Taxonomy, 2025-2035
      • By Country
        • GCC Countries
        • Northern Africa
        • South Africa
        • Turkiye
        • Rest of MEA
      • By Product Type
      • By Function
      • By Application
      • By Distribution Channel
    • Market Attractiveness Analysis
      • By Country
      • By Product Type
      • By Function
      • By Application
      • By Distribution Channel
    • Key Takeaways
  18. Key Countries Market Analysis
    • USA
      • Pricing Analysis
      • Market Share Analysis, 2024
        • By Product Type
        • By Function
        • By Application
        • By Distribution Channel
    • Canada
      • Pricing Analysis
      • Market Share Analysis, 2024
        • By Product Type
        • By Function
        • By Application
        • By Distribution Channel
    • Brazil
      • Pricing Analysis
      • Market Share Analysis, 2024
        • By Product Type
        • By Function
        • By Application
        • By Distribution Channel
    • Mexico
      • Pricing Analysis
      • Market Share Analysis, 2024
        • By Product Type
        • By Function
        • By Application
        • By Distribution Channel
    • Argentina
      • Pricing Analysis
      • Market Share Analysis, 2024
        • By Product Type
        • By Function
        • By Application
        • By Distribution Channel
  19. Market Structure Analysis
    • Competition Dashboard
    • Competition Benchmarking
    • Market Share Analysis of Top Players
      • By Regional
      • By Product Type
      • By Function
      • By Application
      • By Distribution Channel
  20. Competition Analysis
    • Competition Deep Dive
      • Malt Products Corporation
        • Overview
        • Product Portfolio
        • Profitability by Market Segments (Product/Age /Sales Channel/Region)
        • Sales Footprint
        • Strategy Overview
          • Marketing Strategy
          • Product Strategy
          • Channel Strategy
      • The IIDEA Company
        • Overview
        • Product Portfolio
        • Profitability by Market Segments (Product/Age /Sales Channel/Region)
        • Sales Footprint
        • Strategy Overview
          • Marketing Strategy
          • Product Strategy
          • Channel Strategy
      • Swanson Health Products Inc.
        • Overview
        • Product Portfolio
        • Profitability by Market Segments (Product/Age /Sales Channel/Region)
        • Sales Footprint
        • Strategy Overview
          • Marketing Strategy
          • Product Strategy
          • Channel Strategy
      • Loving Earth Pty Ltd
        • Overview
        • Product Portfolio
        • Profitability by Market Segments (Product/Age /Sales Channel/Region)
        • Sales Footprint
        • Strategy Overview
          • Marketing Strategy
          • Product Strategy
          • Channel Strategy
      • Domino Foods Inc.
        • Overview
        • Product Portfolio
        • Profitability by Market Segments (Product/Age /Sales Channel/Region)
        • Sales Footprint
        • Strategy Overview
          • Marketing Strategy
          • Product Strategy
          • Channel Strategy
      • Vita Foods Products
        • Overview
        • Product Portfolio
        • Profitability by Market Segments (Product/Age /Sales Channel/Region)
        • Sales Footprint
        • Strategy Overview
          • Marketing Strategy
          • Product Strategy
          • Channel Strategy
      • Nature’s Agave, Inc.
        • Overview
        • Product Portfolio
        • Profitability by Market Segments (Product/Age /Sales Channel/Region)
        • Sales Footprint
        • Strategy Overview
          • Marketing Strategy
          • Product Strategy
          • Channel Strategy
      • NOW Health Group, Inc.
        • Overview
        • Product Portfolio
        • Profitability by Market Segments (Product/Age /Sales Channel/Region)
        • Sales Footprint
        • Strategy Overview
          • Marketing Strategy
          • Product Strategy
          • Channel Strategy
      • Groovy Food Company Ltd
        • Overview
        • Product Portfolio
        • Profitability by Market Segments (Product/Age /Sales Channel/Region)
        • Sales Footprint
        • Strategy Overview
          • Marketing Strategy
          • Product Strategy
          • Channel Strategy
      • The Colibree Company, Inc.
        • Overview
        • Product Portfolio
        • Profitability by Market Segments (Product/Age /Sales Channel/Region)
        • Sales Footprint
        • Strategy Overview
          • Marketing Strategy
          • Product Strategy
          • Channel Strategy
      • The American Beverage Marketers
        • Overview
        • Product Portfolio
        • Profitability by Market Segments (Product/Age /Sales Channel/Region)
        • Sales Footprint
        • Strategy Overview
          • Marketing Strategy
          • Product Strategy
          • Channel Strategy
      • Madhava Natural Sweeteners
        • Overview
        • Product Portfolio
        • Profitability by Market Segments (Product/Age /Sales Channel/Region)
        • Sales Footprint
        • Strategy Overview
          • Marketing Strategy
          • Product Strategy
          • Channel Strategy
      • Global Goods Inc.
        • Overview
        • Product Portfolio
        • Profitability by Market Segments (Product/Age /Sales Channel/Region)
        • Sales Footprint
        • Strategy Overview
          • Marketing Strategy
          • Product Strategy
          • Channel Strategy
      • The Simple Syrup Co.
        • Overview
        • Product Portfolio
        • Profitability by Market Segments (Product/Age /Sales Channel/Region)
        • Sales Footprint
        • Strategy Overview
          • Marketing Strategy
          • Product Strategy
          • Channel Strategy
      • SunOpta Inc.
        • Overview
        • Product Portfolio
        • Profitability by Market Segments (Product/Age /Sales Channel/Region)
        • Sales Footprint
        • Strategy Overview
          • Marketing Strategy
          • Product Strategy
          • Channel Strategy
      • 21.1Natura BioFoods
        • Overview
        • Product Portfolio
        • Profitability by Market Segments (Product/Age /Sales Channel/Region)
        • Sales Footprint
        • Strategy Overview
          • Marketing Strategy
          • Product Strategy
          • Channel Strategy
      • Other Players (On Additional Request)
        • Overview
        • Product Portfolio
        • Profitability by Market Segments (Product/Age /Sales Channel/Region)
        • Sales Footprint
        • Strategy Overview
          • Marketing Strategy
          • Product Strategy
          • Channel Strategy
  21. Assumptions & Acronyms Used
  22. Research Methodology

List of Tables

  • Table 1: Global Market Value (USD Million) Forecast by Region, 2020-2035
  • Table 2: Global Market Volume (Thousand Metric Tons) Forecast by Region, 2020-2035
  • Table 3: Global Market Value (USD Million) Forecast by Product Type, 2020-2035
  • Table 4: Global Market Volume (Thousand Metric Tons) Forecast by Product Type, 2020-2035
  • Table 5: Global Market Value (USD Million) Forecast by Function, 2020-2035
  • Table 6: Global Market Volume (Thousand Metric Tons) Forecast by Function, 2020-2035
  • Table 7: Global Market Value (USD Million) Forecast by Application, 2020-2035
  • Table 8: Global Market Volume (Thousand Metric Tons) Forecast by Application, 2020-2035
  • Table 9: Global Market Value (USD Million) Forecast by Distribution Channel, 2020-2035
  • Table 10: Global Market Volume (Thousand Metric Tons) Forecast by Distribution Channel, 2020-2035
  • Table 11: North America Market Value (USD Million) Forecast by Country, 2020-2035
  • Table 12: North America Market Volume (Thousand Metric Tons) Forecast by Country, 2020-2035
  • Table 13: North America Market Value (USD Million) Forecast by Product Type, 2020-2035
  • Table 14: North America Market Volume (Thousand Metric Tons) Forecast by Product Type, 2020-2035
  • Table 15: North America Market Value (USD Million) Forecast by Function, 2020-2035
  • Table 16: North America Market Volume (Thousand Metric Tons) Forecast by Function, 2020-2035
  • Table 17: North America Market Value (USD Million) Forecast by Application, 2020-2035
  • Table 18: North America Market Volume (Thousand Metric Tons) Forecast by Application, 2020-2035
  • Table 19: North America Market Value (USD Million) Forecast by Distribution Channel, 2020-2035
  • Table 20: North America Market Volume (Thousand Metric Tons) Forecast by Distribution Channel, 2020-2035
  • Table 21: Latin America Market Value (USD Million) Forecast by Country, 2020-2035
  • Table 22: Latin America Market Volume (Thousand Metric Tons) Forecast by Country, 2020-2035
  • Table 23: Latin America Market Value (USD Million) Forecast by Product Type, 2020-2035
  • Table 24: Latin America Market Volume (Thousand Metric Tons) Forecast by Product Type, 2020-2035
  • Table 25: Latin America Market Value (USD Million) Forecast by Function, 2020-2035
  • Table 26: Latin America Market Volume (Thousand Metric Tons) Forecast by Function, 2020-2035
  • Table 27: Latin America Market Value (USD Million) Forecast by Application, 2020-2035
  • Table 28: Latin America Market Volume (Thousand Metric Tons) Forecast by Application, 2020-2035
  • Table 29: Latin America Market Value (USD Million) Forecast by Distribution Channel, 2020-2035
  • Table 30: Latin America Market Volume (Thousand Metric Tons) Forecast by Distribution Channel, 2020-2035
  • Table 31: Western Europe Market Value (USD Million) Forecast by Country, 2020-2035
  • Table 32: Western Europe Market Volume (Thousand Metric Tons) Forecast by Country, 2020-2035
  • Table 33: Western Europe Market Value (USD Million) Forecast by Product Type, 2020-2035
  • Table 34: Western Europe Market Volume (Thousand Metric Tons) Forecast by Product Type, 2020-2035
  • Table 35: Western Europe Market Value (USD Million) Forecast by Function, 2020-2035
  • Table 36: Western Europe Market Volume (Thousand Metric Tons) Forecast by Function, 2020-2035
  • Table 37: Western Europe Market Value (USD Million) Forecast by Application, 2020-2035
  • Table 38: Western Europe Market Volume (Thousand Metric Tons) Forecast by Application, 2020-2035
  • Table 39: Western Europe Market Value (USD Million) Forecast by Distribution Channel, 2020-2035
  • Table 40: Western Europe Market Volume (Thousand Metric Tons) Forecast by Distribution Channel, 2020-2035
  • Table 41: Eastern Europe Market Value (USD Million) Forecast by Country, 2020-2035
  • Table 42: Eastern Europe Market Volume (Thousand Metric Tons) Forecast by Country, 2020-2035
  • Table 43: Eastern Europe Market Value (USD Million) Forecast by Product Type, 2020-2035
  • Table 44: Eastern Europe Market Volume (Thousand Metric Tons) Forecast by Product Type, 2020-2035
  • Table 45: Eastern Europe Market Value (USD Million) Forecast by Function, 2020-2035
  • Table 46: Eastern Europe Market Volume (Thousand Metric Tons) Forecast by Function, 2020-2035
  • Table 47: Eastern Europe Market Value (USD Million) Forecast by Application, 2020-2035
  • Table 48: Eastern Europe Market Volume (Thousand Metric Tons) Forecast by Application, 2020-2035
  • Table 49: Eastern Europe Market Value (USD Million) Forecast by Distribution Channel, 2020-2035
  • Table 50: Eastern Europe Market Volume (Thousand Metric Tons) Forecast by Distribution Channel, 2020-2035
  • Table 51: East Asia Market Value (USD Million) Forecast by Country, 2020-2035
  • Table 52: East Asia Market Volume (Thousand Metric Tons) Forecast by Country, 2020-2035
  • Table 53: East Asia Market Value (USD Million) Forecast by Product Type, 2020-2035
  • Table 54: East Asia Market Volume (Thousand Metric Tons) Forecast by Product Type, 2020-2035
  • Table 55: East Asia Market Value (USD Million) Forecast by Function, 2020-2035
  • Table 56: East Asia Market Volume (Thousand Metric Tons) Forecast by Function, 2020-2035
  • Table 57: East Asia Market Value (USD Million) Forecast by Application, 2020-2035
  • Table 58: East Asia Market Volume (Thousand Metric Tons) Forecast by Application, 2020-2035
  • Table 59: East Asia Market Value (USD Million) Forecast by Distribution Channel, 2020-2035
  • Table 60: East Asia Market Volume (Thousand Metric Tons) Forecast by Distribution Channel, 2020-2035
  • Table 61: South Asia & Pacific Market Value (USD Million) Forecast by Country, 2020-2035
  • Table 62: South Asia & Pacific Market Volume (Thousand Metric Tons) Forecast by Country, 2020-2035
  • Table 63: South Asia & Pacific Market Value (USD Million) Forecast by Product Type, 2020-2035
  • Table 64: South Asia & Pacific Market Volume (Thousand Metric Tons) Forecast by Product Type, 2020-2035
  • Table 65: South Asia & Pacific Market Value (USD Million) Forecast by Function, 2020-2035
  • Table 66: South Asia & Pacific Market Volume (Thousand Metric Tons) Forecast by Function, 2020-2035
  • Table 67: South Asia & Pacific Market Value (USD Million) Forecast by Application, 2020-2035
  • Table 68: South Asia & Pacific Market Volume (Thousand Metric Tons) Forecast by Application, 2020-2035
  • Table 69: South Asia & Pacific Market Value (USD Million) Forecast by Distribution Channel, 2020-2035
  • Table 70: South Asia & Pacific Market Volume (Thousand Metric Tons) Forecast by Distribution Channel, 2020-2035
  • Table 71: Middle East and Africa Market Value (USD Million) Forecast by Country, 2020-2035
  • Table 72: Middle East and Africa Market Volume (Thousand Metric Tons) Forecast by Country, 2020-2035
  • Table 73: Middle East and Africa Market Value (USD Million) Forecast by Product Type, 2020-2035
  • Table 74: Middle East and Africa Market Volume (Thousand Metric Tons) Forecast by Product Type, 2020-2035
  • Table 75: Middle East and Africa Market Value (USD Million) Forecast by Function, 2020-2035
  • Table 76: Middle East and Africa Market Volume (Thousand Metric Tons) Forecast by Function, 2020-2035
  • Table 77: Middle East and Africa Market Value (USD Million) Forecast by Application, 2020-2035
  • Table 78: Middle East and Africa Market Volume (Thousand Metric Tons) Forecast by Application, 2020-2035
  • Table 79: Middle East and Africa Market Value (USD Million) Forecast by Distribution Channel, 2020-2035
  • Table 80: Middle East and Africa Market Volume (Thousand Metric Tons) Forecast by Distribution Channel, 2020-2035

List of Figures

  • Figure 1: Global Market Volume (Thousand Metric Tons) Forecast 2020-2035
  • Figure 2: Global Market Pricing Analysis
  • Figure 3: Global Market Value (USD Million) Forecast 2020-2035
  • Figure 4: Global Market Value Share and BPS Analysis by Product Type, 2025 and 2035
  • Figure 5: Global Market Y-o-Y Growth Comparison by Product Type, 2025-2035
  • Figure 6: Global Market Attractiveness Analysis by Product Type
  • Figure 7: Global Market Value Share and BPS Analysis by Function, 2025 and 2035
  • Figure 8: Global Market Y-o-Y Growth Comparison by Function, 2025-2035
  • Figure 9: Global Market Attractiveness Analysis by Function
  • Figure 10: Global Market Value Share and BPS Analysis by Application, 2025 and 2035
  • Figure 11: Global Market Y-o-Y Growth Comparison by Application, 2025-2035
  • Figure 12: Global Market Attractiveness Analysis by Application
  • Figure 13: Global Market Value Share and BPS Analysis by Distribution Channel, 2025 and 2035
  • Figure 14: Global Market Y-o-Y Growth Comparison by Distribution Channel, 2025-2035
  • Figure 15: Global Market Attractiveness Analysis by Distribution Channel
  • Figure 16: Global Market Value (USD Million) Share and BPS Analysis by Region, 2025 and 2035
  • Figure 17: Global Market Y-o-Y Growth Comparison by Region, 2025-2035
  • Figure 18: Global Market Attractiveness Analysis by Region
  • Figure 19: North America Market Incremental $ Opportunity, 2025-2035
  • Figure 20: Latin America Market Incremental $ Opportunity, 2025-2035
  • Figure 21: Western Europe Market Incremental $ Opportunity, 2025-2035
  • Figure 22: Eastern Europe Market Incremental $ Opportunity, 2025-2035
  • Figure 23: East Asia Market Incremental $ Opportunity, 2025-2035
  • Figure 24: South Asia & Pacific Market Incremental $ Opportunity, 2025-2035
  • Figure 25: Middle East and Africa Market Incremental $ Opportunity, 2025-2035
  • Figure 26: North America Market Value Share and BPS Analysis by Country, 2025 and 2035
  • Figure 27: North America Market Value Share and BPS Analysis by Product Type, 2025 and 2035
  • Figure 28: North America Market Y-o-Y Growth Comparison by Product Type, 2025-2035
  • Figure 29: North America Market Attractiveness Analysis by Product Type
  • Figure 30: North America Market Value Share and BPS Analysis by Function, 2025 and 2035
  • Figure 31: North America Market Y-o-Y Growth Comparison by Function, 2025-2035
  • Figure 32: North America Market Attractiveness Analysis by Function
  • Figure 33: North America Market Value Share and BPS Analysis by Application, 2025 and 2035
  • Figure 34: North America Market Y-o-Y Growth Comparison by Application, 2025-2035
  • Figure 35: North America Market Attractiveness Analysis by Application
  • Figure 36: North America Market Value Share and BPS Analysis by Distribution Channel, 2025 and 2035
  • Figure 37: North America Market Y-o-Y Growth Comparison by Distribution Channel, 2025-2035
  • Figure 38: North America Market Attractiveness Analysis by Distribution Channel
  • Figure 39: Latin America Market Value Share and BPS Analysis by Country, 2025 and 2035
  • Figure 40: Latin America Market Value Share and BPS Analysis by Product Type, 2025 and 2035
  • Figure 41: Latin America Market Y-o-Y Growth Comparison by Product Type, 2025-2035
  • Figure 42: Latin America Market Attractiveness Analysis by Product Type
  • Figure 43: Latin America Market Value Share and BPS Analysis by Function, 2025 and 2035
  • Figure 44: Latin America Market Y-o-Y Growth Comparison by Function, 2025-2035
  • Figure 45: Latin America Market Attractiveness Analysis by Function
  • Figure 46: Latin America Market Value Share and BPS Analysis by Application, 2025 and 2035
  • Figure 47: Latin America Market Y-o-Y Growth Comparison by Application, 2025-2035
  • Figure 48: Latin America Market Attractiveness Analysis by Application
  • Figure 49: Latin America Market Value Share and BPS Analysis by Distribution Channel, 2025 and 2035
  • Figure 50: Latin America Market Y-o-Y Growth Comparison by Distribution Channel, 2025-2035
  • Figure 51: Latin America Market Attractiveness Analysis by Distribution Channel
  • Figure 52: Western Europe Market Value Share and BPS Analysis by Country, 2025 and 2035
  • Figure 53: Western Europe Market Value Share and BPS Analysis by Product Type, 2025 and 2035
  • Figure 54: Western Europe Market Y-o-Y Growth Comparison by Product Type, 2025-2035
  • Figure 55: Western Europe Market Attractiveness Analysis by Product Type
  • Figure 56: Western Europe Market Value Share and BPS Analysis by Function, 2025 and 2035
  • Figure 57: Western Europe Market Y-o-Y Growth Comparison by Function, 2025-2035
  • Figure 58: Western Europe Market Attractiveness Analysis by Function
  • Figure 59: Western Europe Market Value Share and BPS Analysis by Application, 2025 and 2035
  • Figure 60: Western Europe Market Y-o-Y Growth Comparison by Application, 2025-2035
  • Figure 61: Western Europe Market Attractiveness Analysis by Application
  • Figure 62: Western Europe Market Value Share and BPS Analysis by Distribution Channel, 2025 and 2035
  • Figure 63: Western Europe Market Y-o-Y Growth Comparison by Distribution Channel, 2025-2035
  • Figure 64: Western Europe Market Attractiveness Analysis by Distribution Channel
  • Figure 65: Eastern Europe Market Value Share and BPS Analysis by Country, 2025 and 2035
  • Figure 66: Eastern Europe Market Value Share and BPS Analysis by Product Type, 2025 and 2035
  • Figure 67: Eastern Europe Market Y-o-Y Growth Comparison by Product Type, 2025-2035
  • Figure 68: Eastern Europe Market Attractiveness Analysis by Product Type
  • Figure 69: Eastern Europe Market Value Share and BPS Analysis by Function, 2025 and 2035
  • Figure 70: Eastern Europe Market Y-o-Y Growth Comparison by Function, 2025-2035
  • Figure 71: Eastern Europe Market Attractiveness Analysis by Function
  • Figure 72: Eastern Europe Market Value Share and BPS Analysis by Application, 2025 and 2035
  • Figure 73: Eastern Europe Market Y-o-Y Growth Comparison by Application, 2025-2035
  • Figure 74: Eastern Europe Market Attractiveness Analysis by Application
  • Figure 75: Eastern Europe Market Value Share and BPS Analysis by Distribution Channel, 2025 and 2035
  • Figure 76: Eastern Europe Market Y-o-Y Growth Comparison by Distribution Channel, 2025-2035
  • Figure 77: Eastern Europe Market Attractiveness Analysis by Distribution Channel
  • Figure 78: East Asia Market Value Share and BPS Analysis by Country, 2025 and 2035
  • Figure 79: East Asia Market Value Share and BPS Analysis by Product Type, 2025 and 2035
  • Figure 80: East Asia Market Y-o-Y Growth Comparison by Product Type, 2025-2035
  • Figure 81: East Asia Market Attractiveness Analysis by Product Type
  • Figure 82: East Asia Market Value Share and BPS Analysis by Function, 2025 and 2035
  • Figure 83: East Asia Market Y-o-Y Growth Comparison by Function, 2025-2035
  • Figure 84: East Asia Market Attractiveness Analysis by Function
  • Figure 85: East Asia Market Value Share and BPS Analysis by Application, 2025 and 2035
  • Figure 86: East Asia Market Y-o-Y Growth Comparison by Application, 2025-2035
  • Figure 87: East Asia Market Attractiveness Analysis by Application
  • Figure 88: East Asia Market Value Share and BPS Analysis by Distribution Channel, 2025 and 2035
  • Figure 89: East Asia Market Y-o-Y Growth Comparison by Distribution Channel, 2025-2035
  • Figure 90: East Asia Market Attractiveness Analysis by Distribution Channel
  • Figure 91: South Asia & Pacific Market Value Share and BPS Analysis by Country, 2025 and 2035
  • Figure 92: South Asia & Pacific Market Value Share and BPS Analysis by Product Type, 2025 and 2035
  • Figure 93: South Asia & Pacific Market Y-o-Y Growth Comparison by Product Type, 2025-2035
  • Figure 94: South Asia & Pacific Market Attractiveness Analysis by Product Type
  • Figure 95: South Asia & Pacific Market Value Share and BPS Analysis by Function, 2025 and 2035
  • Figure 96: South Asia & Pacific Market Y-o-Y Growth Comparison by Function, 2025-2035
  • Figure 97: South Asia & Pacific Market Attractiveness Analysis by Function
  • Figure 98: South Asia & Pacific Market Value Share and BPS Analysis by Application, 2025 and 2035
  • Figure 99: South Asia & Pacific Market Y-o-Y Growth Comparison by Application, 2025-2035
  • Figure 100: South Asia & Pacific Market Attractiveness Analysis by Application
  • Figure 101: South Asia & Pacific Market Value Share and BPS Analysis by Distribution Channel, 2025 and 2035
  • Figure 102: South Asia & Pacific Market Y-o-Y Growth Comparison by Distribution Channel, 2025-2035
  • Figure 103: South Asia & Pacific Market Attractiveness Analysis by Distribution Channel
  • Figure 104: Middle East and Africa Market Value Share and BPS Analysis by Country, 2025 and 2035
  • Figure 105: Middle East and Africa Market Value Share and BPS Analysis by Product Type, 2025 and 2035
  • Figure 106: Middle East and Africa Market Y-o-Y Growth Comparison by Product Type, 2025-2035
  • Figure 107: Middle East and Africa Market Attractiveness Analysis by Product Type
  • Figure 108: Middle East and Africa Market Value Share and BPS Analysis by Function, 2025 and 2035
  • Figure 109: Middle East and Africa Market Y-o-Y Growth Comparison by Function, 2025-2035
  • Figure 110: Middle East and Africa Market Attractiveness Analysis by Function
  • Figure 111: Middle East and Africa Market Value Share and BPS Analysis by Application, 2025 and 2035
  • Figure 112: Middle East and Africa Market Y-o-Y Growth Comparison by Application, 2025-2035
  • Figure 113: Middle East and Africa Market Attractiveness Analysis by Application
  • Figure 114: Middle East and Africa Market Value Share and BPS Analysis by Distribution Channel, 2025 and 2035
  • Figure 115: Middle East and Africa Market Y-o-Y Growth Comparison by Distribution Channel, 2025-2035
  • Figure 116: Middle East and Africa Market Attractiveness Analysis by Distribution Channel
  • Figure 117: Global Market - Tier Structure Analysis
  • Figure 118: Global Market - Company Share Analysis

Frequently Asked Questions

What is the market value of the agave syrup industry in 2025?

The industry is valued at USD 645 million in 2025.

What is the projected CAGR for the agave syrup industry from 2025 to 2035?

The industry is expected to grow at a CAGR of 6.7% from 2025 to 2035.

What is the expected market value of the Agave Syrup Market by 2035?

The industry is forecasted to reach USD 1,233.6 million by 2035.

What is the industry share market held by light agave syrup in 2025?

Light Agave sweetener holds a 60% share of the industry in 2025.

What is the share of Malt Products Corporation in the agave syrup market?

Malt Products Corporation holds a 15% share in the industry.

Explore Similar Insights

Future Market Insights

Agave Syrup Market