Agave Inulin Market Size and Share Forecast Outlook 2025 to 2035

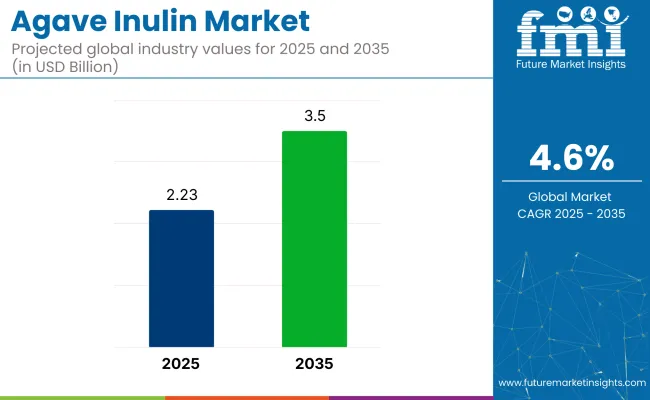
The agave inulin market is expected to grow from a valuation of USD 2.23 billion in 2025 to USD 3.50 billion by 2035, with a steady CAGR of 4.6% over the forecast period. Increasing awareness of gut health, prebiotic fibers, and natural sugar alternatives has established agave fiber as a preferred functional ingredient in food, beverage, and nutraceutical applications.
Quick Stats of Agave Inulin Market

  • Market Value (2025): USD 2.23 billion
  • Forecast Value (2035): USD 3.50 billion
  • Forecast CAGR (2025-2035): 4.6%
  • Leading Segment in 2025: Liquid Form (60%)
  • Key Growth Region: South Asia
  • Top Key Players: Naturel West Corp, Sensus, Beneo GmbH, The Tierra Group, Nutra Food Ingredients

Agave Inulin Market

Attributes Description
Industry Size (2025E) USD 2.23 billion
Industry Value (2035F) USD 3.50 billion
CAGR (2025 to 2035) 4.6%

This growth is largely driven by the increasing demand for naturally occurring, functional ingredients in the food and beverage industry. Agave Fibre is a soluble fiber extracted from the agave plant, is well-regarded for its prebiotic effects, promoting gut health and digestive system wellness.

The industry accounts for an estimated 12-15% share of the global inulin industry, where chicory remains dominant. Within the broader prebiotic and dietary fiber ingredients industry, its share ranges between 2-3%, as it competes with ingredients like FOS, GOS, and beta-glucan. In the functional foods and beverages industry, agave fiber constitutesless than 1%, used mainly in niche clean-label and sugar-reduced formulations.

In the dietary supplements and nutraceuticals industry, its contribution is modest-about 1-2%, mostly in fiber blends and digestive health products. Its presence in the pharmaceutical ingredients industry is minimal, well under 0.5%, though growing due to its GRAS status and emerging gut microbiome applications. Its impact remains high despite low volumetric share.

A June 2024 article published in SupplySide Food & Beverage Journal showcased Ciranda’s leadership. Eric Lofgren, Vice President of Innovation & Sustainability at Ciranda, stated, “Ciranda looks forward to helping more product developers offer the functional health benefits of inulin.

These ingredient options deliver taste and texture, while also satisfying the health-conscious consumer's desire for more fiber and reduced-sugar options.” The article underscored rising demand for prebiotic dietary fibers, positioning organic agave fiber as a key clean-label ingredient in functional foods, beverages, and low-sugar product innovations

Analyzing the Agave Inulin Market by Top Investment Segments

The industry is segmented into form, nature, application, and sales channel. Liquid form leads with 60%, followed by conventional products at 55%. Food & beverages hold 30%, and offline sales dominate with 70%. Growing demand for digestive health and plant-based products is driving the idustry, while affordability and availability make conventional Agave fiber the preferred choice.

Liquid Form to Lead the Agave Inulin Market in 2025

The liquid form is expected to hold the largest share of 60% share in 2025. This dominance is driven by its widespread use in beverages and liquid supplements. The solubility and ease of integration into drinks make it a preferred choice for functional beverage development.

Agave fibre is increasingly incorporated into products by leading companies like Danone and Yakult, with its digestive health benefits being promoted. As demand for gut health solutions grows, the position of liquid agave fiber in the industry is strengthened, particularly in formats like smoothies, juices, and health drinks.
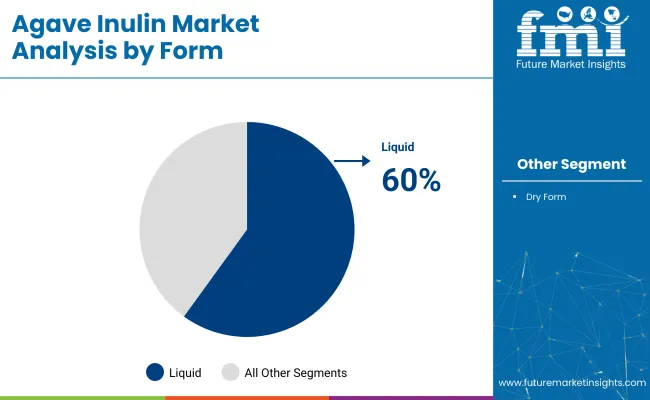
  • Liquid form is commonly used in beverages due to ease of incorporation.
  • Growing interest in digestive health is fueling the popularity of liquid agave fibre.
  • Leading beverage brands are adopting agave fiber for gut health-focused drinks.

Agave Inulin Market By Form

Conventional Products to Dominate the Agave Inulin Market by Nature

The conventionalsegment is expected to dominate, accounting for 55% of the share in 2025. This dominance is largely due to its cost-effectiveness compared to organic variants. Companies like Chr. Hansen and DuPontcontinue to offer conventional agave fibre, which is widely used across various industries.

The affordability and availability of conventional products make them the preferred option for manufacturers, particularly in price-sensitive segments like food and beverages. While the demand for organic agave fibre is growing, conventional variants continue to dominate the industry because they are more economically viable for mass production.
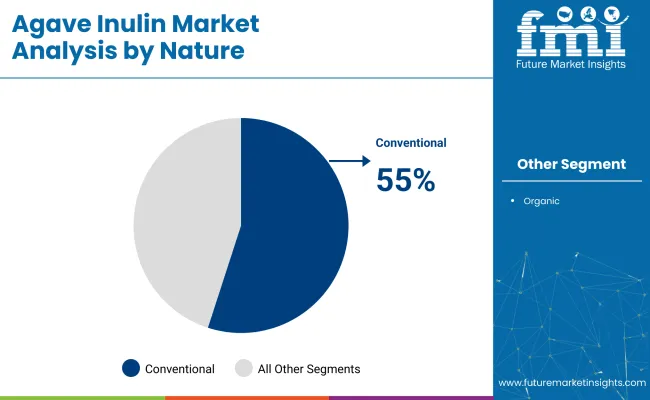
  • Conventional agave fibre is preferred for its cost-effectiveness and widespread availability.
  • Organic alternatives are growing but conventional products remain the dominant choice.
  • The affordability of conventional agave fibre is critical for price-sensitive industries.

Agave Inulin Market By Nature

Food & Beverages to Hold Significant Share in Agave Inulin Applications

The food and beverages sector is expected to account for 30% share in 2025. The demand for functional foods that support digestive health is driving the growth of sector. Leading brands like Nestlé and Kraft Heinz are increasingly incorporating agave fibre into their food products to meet the needs of health-conscious consumers.

Agave fibre is used in products like smoothies, yogurts, and energy bars, offering a natural source of fiber and prebiotics. As consumers continue to seek health-promoting food options, agave fibres in food and beverages are likely to grow, with more companies leveraging their benefits for digestive wellness.

  • Food and beverages are the largest application segment.
  • Growing demand for functional foods is driving agave fibres adoption in food products.
  • Companies are incorporating agave fibres into health-focused foods like yogurts and smoothies.

Offline Sales Channel to Lead in Agave Inulin Market Distribution

The offline sales channel is expected to dominate, capturing 70% share in 2025. Traditional retail stores, including retail stores and health food stores, are crucial for the distribution of agave fibre products. Consumers continue to prefer in-store shopping where they can compare products, read labels, and receive expert advice.

Health-focused retail chains like Whole Foods and CVS Health are playing an important role in distributing agave fibre-based products. Offline retail remains a strong distribution channel due to its established presence, consumer trust, and the tactile shopping experience it provides, especially for health and wellness products.

  • Offline sales channels dominate due to established consumer shopping habits.
  • Health-focused retail chains play a significant role in distributing agave fibre products.
  • Consumer preference for in-store shopping and product comparison continues to drive offline sales.

Top Agave Syrup Market Dynamics

Growing Demand for Prebiotic Ingredients

The demand for prebiotic ingredients is being driven by the growing awareness of gut health. Consumers are increasingly seeking products that support digestion. Inulin, being rich in prebiotics, is now widely incorporated into various food and beverage items, such as yogurts, smoothies, and dietary supplements. This shift in consumer preference is prompting manufacturers to create new products that highlight agave fibren as a functional ingredient for digestive health.

  • Awareness of gut health is significantly increasing the demand for prebiotic ingredients.
  • Agave fibre is being integrated into a broader range of food and beverage products.
  • Manufacturers are prioritizing the development of products emphasizing agave fibres' digestive benefits.

Rise of Plant-Based and Clean Label Products

The rise of plant-based diets and clean label products is having a considerable impact on the industry. As more consumers adopt vegan and vegetarian lifestyles, the preference for food without animal products and artificial additives is growing. While agave fibre is a natural, plant-derived ingredient, meeting the clean label demand is challenging. Manufacturers are striving to offer products that maintain ingredient integrity while aligning with the clean-label trend.
  • The increasing preference for plant-based diets is fueling demand for clean label products.
  • The need for transparency in labeling is driving the use of plant-derived ingredients.
  • Companies are reformulating their products to meet clean label standards and appeal to eco-conscious consumers.

Top Countries Manufacturing, Distributing, and Generating Demand for Agave Inulin

Country Wise Analysisi Of Agave Inulin Market

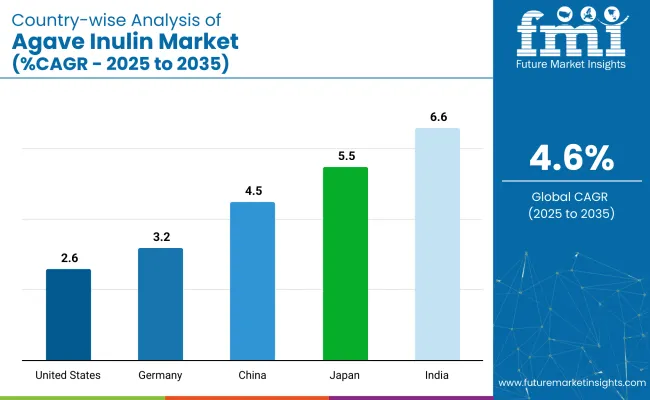
Country CAGR (2025 to 2035)
United States 2.6%
Germany 3.2%
China 4.5%
Japan 5.5%
India 6.6%

In the global context, uneven growth is shown across major economies in the industry. Among the OECD countries, a below-average CAGR of 2.6% is exhibited by the United States, underperforming the global growth rate by 2.0 percentage points. A moderate CAGR of 3.2% is reported by Germany, reflecting steady uptake, particularly in food and health sectors, but still trailing the global growth pace by 1.4%.

In contrast, the BRICS group, strong momentum is demonstrated by India, with a projected CAGR of 6.6%, driven by increasing interest in functional foods and dietary fiber. A near-global average CAGR of 4.5% is posted by China. Japan, part of the OECD, exceeds the global average with a 5.5% CAGR, attributed to its proactive functional food culture.

The report covers detailed analysis of 40+ countries, and the top five countries have been shared as a reference.

Analysis of Agave Inulin Market in India

Demand for the agave fibrein india is expanding at a 9.7% CAGR through 2035. This growth is driven by rising consumer awareness, increased disposable income, and demand for lactose-free dairy alternatives. Leading companies like Amul, Parle Agro, and Nestlé India are expanding their portfolios to meet the growing demand for lactose-free products.

The industry is also benefiting from increased health-conscious lifestyles, government campaigns, and better product labeling. E-commerce platforms are making these products more accessible, while innovation in formulations and packaging is meeting diverse consumer needs.

  • Growing awareness of lactose-free products.
  • Expansion of lactose-free portfolios by major local brands.
  • Enhanced product accessibility through e-commerce platforms.

Demand Forecast for Agave Inulin Market in the United States

Demand for agave fibre in the USA, growing at a 6.1% CAGR from 2025 to 2035. The industry benefits from a well-established healthcare infrastructure and increasing demand for functional, lactose-free products. Companies like Danone,

Dairy Farmers of America, and Blue Diamond Growers are expanding their lactose-free offerings in retail and foodservice sectors. Growth is also driven by consumer preference for plant-based alternatives, with government healthcare initiatives and awareness campaigns contributing to faster adoption.

  • Plant-based food segment driving product demand.
  • Increased adoption in the retail and foodservice sectors.
  • Accelerated adoption due to government healthcare initiatives.

Growth Analysis of Agave Inulin Market in Germany

Germany holds a dominant position with a CAGR of 3.2% through 2035, driven by the increasing demand for organic and clean-label products. Consumers are becoming more informed about food labeling and ingredient sourcing, which is raising the preference for agave fibre.

Local producers are capitalizing on this by offering a range of certified organic agave fibre products. Retailers, including health food stores, retail stores, and e-commerce platforms, are ensuring widespread availability, making these products easily accessible to consumers.

  • Rising demand for organic and clean-label products.
  • Consumer awareness about ingredient sourcing influencing growth.
  • Strong presence of online retail platforms.

Future Outlook for Agave Inulin Market in China

Sales of agave fibre in China are projected to grow at an 8.9% CAGR through 2035. This growth is fueled by dietary shifts and rising health awareness. Dairy companies such as Yili Group, Mengniu Dairy, and Beingmate are investing heavily in lactose-free products to cater to the growing demand.

Government initiatives to promote nutritional education and awareness are further supporting industrial growth. Expanding retail chains and e-commerce platforms are making it easier for consumers to access agave fibre products.

  • Rising health consciousness is driving the demand for lactose-free products.
  • Nutritional education programs boosting industry growth.
  • Expanding retail and e-commerce platforms increasing product accessibility.

Agave Inulin Market Growth Outlook in Japan

Demand for agave fibrein Japan is projected to grow at a 5.5% CAGR through 2035. Growth is influenced by the country’s aging population, which faces increased digestive sensitivities, and rising dietary awareness. Major companies such as Meiji Holdings, Morinaga Milk Industry, and Snow Brand Milk Products are leading the development of lactose-free products. Government initiatives promoting digestive health and functional foods are supporting industry growth. E-commerce and retail stores are expanding the availability of these products to a wider consumer base.
  • Increased demand for lactose-free products driven by the aging population.
  • Government initiatives encouraging digestive health and functional foods.
  • Expansion of product availability through retail stores and online retailers.

Leading Suppliers in the Agave Inulin Market

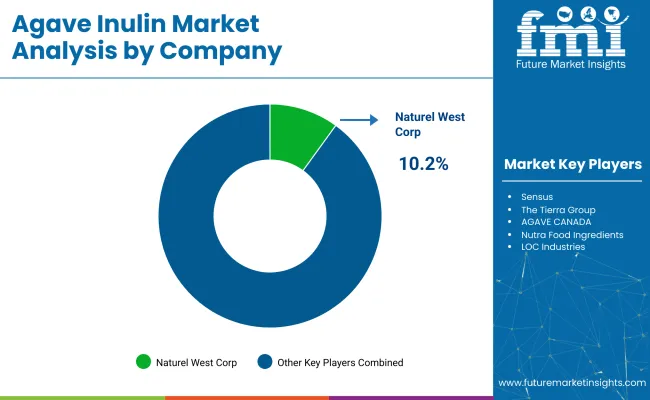
Agave Inulin Market By Company

The industry features a mix of leading, key, and emerging players. Leading players like Naturel West Corp, Sensus, and Beneo dominate the industry with extensive product portfolios and global reach. Key players such as The Tierra Group and Nutra Food Ingredients focus on regional sectors, offering specialized products tailored to local preferences.

Emerging players like AGAVE CANADA and LOC Industries primarily serve specific geographic areas, providing agave fibre at competitive prices while promoting local economies. These players contribute to industry innovation, catering to growing demand for prebiotic ingredients and functional foods globally.

Recent Industry News

  • A May 2025 report by Ciranda Inc., as published on SupplySideFBJ (May 2025), highlighted the growing demand for inulin as a fiber ingredient. The report emphasized its prebiotic benefits and suitability for clean-label formulations, reflecting the increasing consumer preference for natural ingredients.
  • A June 2025 report by Pyure Brands LLC, as published on WiseGuyReports (June 2025), revealed that the company expanded its product line to include organic agave fibre. This development caters to the rising consumer demand for natural and organic ingredients in food and beverage products.

Leading Player In Agave Inulin Market

  • Naturel West Corp
  • Sensus
  • The Tierra Group
  • AGAVE CANADA
  • Nutra Food Ingredients
  • LOC Industries
  • Beneo
  • Pyure Brands
  • Maretai Organics
  • 21 Missions’ Organics
  • EDULAG
  • Ciranda

Report Scope Table

Report Attributes Details
Industry Size (2025) USD 2.23 billion
Industry Size (2035) USD 3.50 billion
CAGR (2025 to 2035) 4.6%
Base Year for Estimation 2024
Historical Period 2020 to 2024
Projections Period 2025 to 2035
Quantitative Units USD billion for value and thousand metric tons for volume
Forms Analyzed (Segment 1) Liquid, Dry
Nature Types Analyzed (Segment 2) Organic, Conventional
Applications Analyzed (Segment 3) Pharmaceuticals, Dietary Supplements, Food & Beverages, Industrial
Sales Channels Analyzed (Segment 4) Online, Offline
Regions Covered North America, Latin America, Western Europe, Eastern Europe, East Asia, South Asia & Pacific, Central Asia, Russia & Belarus, Balkan & Baltic Countries, Middle East & Africa
Countries Covered United States, Canada, Germany, United Kingdom, France, Italy, Spain, China, India, Japan, South Korea, Australia, Brazil, Mexico, Argentina, Saudi Arabia, UAE, South Africa
Key Players Naturel West Corp, Sensus, The Tierra Group, AGAVE CANADA, Nutra Food Ingredients, LOC Industries, Beneo, Pyure Brands, Maretai Organics, 21 Missions’ Organics, EDULAG, Ciranda
Additional Attributes Dollar sales, share by form and application, rising use in dietary fibers and sugar alternatives, increased demand in functional foods, clean label and organic formulation trends, regional supply chain expansion

Agave Inulin Market Analyzed by Key Investment Segments

By Form:

The industry is segmented into liquid and dry forms.

By Nature:

The industry includes both organic and conventional types.

By Application:

The industry finds applications in pharmaceuticals, dietary supplements, food & beverages, and industrial sectors.

By Sales Channel:

Agave inulin is distributed through online and offline sales channels.

By Region:

Geographically segmented into North America, Latin America, Western Europe, Eastern Europe, East Asia, South Asia & Pacific, Central Asia, Russia and Belarus, Balkan & Baltic countries, and the Middle East & Africa.

Table of Content

  1. Executive Summary
    • Global Market Outlook
    • Demand-side Trends
    • Supply-side Trends
    • Technology Roadmap Analysis
    • Analysis and Recommendations
  2. Market Overview
    • Market Coverage / Taxonomy
    • Market Definition / Scope / Limitations
  3. Market Background
    • Market Dynamics
      • Drivers
      • Restraints
      • Opportunity
      • Trends
    • Scenario Forecast
      • Demand in Optimistic Scenario
      • Demand in Likely Scenario
      • Demand in Conservative Scenario
    • Opportunity Map Analysis
    • Product Life Cycle Analysis
    • Supply Chain Analysis
      • Supply Side Participants and their Roles
        • Producers
        • Mid-Level Participants (Traders/ Agents/ Brokers)
        • Wholesalers and Distributors
      • Value Added and Value Created at Node in the Supply Chain
      • List of Raw Material Suppliers
      • List of Existing and Potential Buyer’s
    • Investment Feasibility Matrix
    • Value Chain Analysis
      • Profit Margin Analysis
      • Wholesalers and Distributors
      • Retailers
    • PESTLE and Porter’s Analysis
    • Regulatory Landscape
      • By Key Regions
      • By Key Countries
    • Regional Parent Market Outlook
    • Production and Consumption Statistics
    • Import and Export Statistics
  4. Global Market Analysis 2020-2024 and Forecast, 2025-2035
    • Historical Market Size Value (USD Billion) & Volume (Thousand Metric Tons) Analysis, 2020-2024
    • Current and Future Market Size Value (USD Billion) & Volume (Thousand Metric Tons) Projections, 2025-2035
      • Y-o-Y Growth Trend Analysis
      • Absolute $ Opportunity Analysis
  5. Global Market Pricing Analysis 2020-2024 and Forecast 2025-2035
  6. Global Market Analysis 2020-2024 and Forecast 2025-2035, By Form
    • Introduction / Key Findings
    • Historical Market Size Value (USD Billion) & Volume (Thousand Metric Tons) Analysis By Form, 2020-2024
    • Current and Future Market Size Value (USD Billion) & Volume (Thousand Metric Tons) Analysis and Forecast By Form, 2025-2035
      • Dry
      • Liquid
    • Y-o-Y Growth Trend Analysis By Form, 2020-2024
    • Absolute $ Opportunity Analysis By Form, 2025-2035
  7. Global Market Analysis 2020-2024 and Forecast 2025-2035, By Nature
    • Introduction / Key Findings
    • Historical Market Size Value (USD Billion) & Volume (Thousand Metric Tons) Analysis By Nature, 2020-2024
    • Current and Future Market Size Value (USD Billion) & Volume (Thousand Metric Tons) Analysis and Forecast By Nature, 2025-2035
      • Organic
      • Conventional
    • Y-o-Y Growth Trend Analysis By Nature, 2020-2024
    • Absolute $ Opportunity Analysis By Nature, 2025-2035
  8. Global Market Analysis 2020-2024 and Forecast 2025-2035, By Application
    • Introduction / Key Findings
    • Historical Market Size Value (USD Billion) & Volume (Thousand Metric Tons) Analysis By Application, 2020-2024
    • Current and Future Market Size Value (USD Billion) & Volume (Thousand Metric Tons) Analysis and Forecast By Application, 2025-2035
      • Pharmaceuticals
      • Dietary Supplements
      • Food Beverages
      • Industrial
    • Y-o-Y Growth Trend Analysis By Application, 2020-2024
    • Absolute $ Opportunity Analysis By Application, 2025-2035
  9. Global Market Analysis 2020-2024 and Forecast 2025-2035, By Sales Channel
    • Introduction / Key Findings
    • Historical Market Size Value (USD Billion) & Volume (Thousand Metric Tons) Analysis By Sales Channel, 2020-2024
    • Current and Future Market Size Value (USD Billion) & Volume (Thousand Metric Tons) Analysis and Forecast By Sales Channel, 2025-2035
      • Online
      • Offline
    • Y-o-Y Growth Trend Analysis By Sales Channel, 2020-2024
    • Absolute $ Opportunity Analysis By Sales Channel, 2025-2035
  10. Global Market Analysis 2020-2024 and Forecast 2025-2035, By Region
    • Introduction
    • Historical Market Size Value (USD Billion) & Volume (Thousand Metric Tons) Analysis By Region, 2020-2024
    • Current Market Size Value (USD Billion) & Volume (Thousand Metric Tons) Analysis and Forecast By Region, 2025-2035
      • North America
      • Latin America
      • Western Europe
      • Eastern Europe
      • East Asia
      • South Asia & Pacific
      • Middle East and Africa
    • Market Attractiveness Analysis By Region
  11. North America Market Analysis 2020-2024 and Forecast 2025-2035, By Country
    • Historical Market Size Value (USD Billion) & Volume (Thousand Metric Tons) Trend Analysis By Market Taxonomy, 2020-2024
    • Market Size Value (USD Billion) & Volume (Thousand Metric Tons) Forecast By Market Taxonomy, 2025-2035
      • By Country
        • USA
        • Canada
        • Mexico
      • By Form
      • By Nature
      • By Application
      • By Sales Channel
    • Market Attractiveness Analysis
      • By Country
      • By Form
      • By Nature
      • By Application
      • By Sales Channel
    • Key Takeaways
  12. Latin America Market Analysis 2020-2024 and Forecast 2025-2035, By Country
    • Historical Market Size Value (USD Billion) & Volume (Thousand Metric Tons) Trend Analysis By Market Taxonomy, 2020-2024
    • Market Size Value (USD Billion) & Volume (Thousand Metric Tons) Forecast By Market Taxonomy, 2025-2035
      • By Country
        • Brazil
        • Argentina
        • Rest of LATAM
      • By Form
      • By Nature
      • By Application
      • By Sales Channel
    • Market Attractiveness Analysis
      • By Country
      • By Form
      • By Nature
      • By Application
      • By Sales Channel
    • Key Takeaways
  13. Western Europe Market Analysis 2020-2024 and Forecast 2025-2035, By Country
    • Historical Market Size Value (USD Billion) & Volume (Thousand Metric Tons) Trend Analysis By Market Taxonomy, 2020-2024
    • Market Size Value (USD Billion) & Volume (Thousand Metric Tons) Forecast By Market Taxonomy, 2025-2035
      • By Country
        • Germany
        • Italy
        • France
        • UK
        • Spain
        • BENELUX
        • Nordic
        • Rest of W.Europe
      • By Form
      • By Nature
      • By Application
      • By Sales Channel
    • Market Attractiveness Analysis
      • By Country
      • By Form
      • By Nature
      • By Application
      • By Sales Channel
    • Key Takeaways
  14. Eastern Europe Market Analysis 2020-2024 and Forecast 2025-2035, By Country
    • Historical Market Size Value (USD Billion) & Volume (Thousand Metric Tons) Trend Analysis By Market Taxonomy, 2020-2024
    • Market Size Value (USD Billion) & Volume (Thousand Metric Tons) Forecast By Market Taxonomy, 2025-2035
      • By Country
        • Russia
        • Hungary
        • Poland
        • Balkan & Baltics
        • Rest of E. Europe
      • By Form
      • By Nature
      • By Application
      • By Sales Channel
    • Market Attractiveness Analysis
      • By Country
      • By Form
      • By Nature
      • By Application
      • By Sales Channel
    • Key Takeaways
  15. East Asia Market Analysis 2020-2024 and Forecast 2025-2035, By Country
    • Historical Market Size Value (USD Billion) & Volume (Thousand Metric Tons) Trend Analysis By Market Taxonomy, 2020-2024
    • Market Size Value (USD Billion) & Volume (Thousand Metric Tons) Forecast By Market Taxonomy, 2025-2035
      • By Country
        • China
        • Japan
        • South Korea
      • By Form
      • By Nature
      • By Application
      • By Sales Channel
    • Market Attractiveness Analysis
      • By Country
      • By Form
      • By Nature
      • By Application
      • By Sales Channel
    • Key Takeaways
  16. South Asia & Pacific Market Analysis 2020-2024 and Forecast 2025-2035, By Country
    • Historical Market Size Value (USD Billion) & Volume (Thousand Metric Tons) Trend Analysis By Market Taxonomy, 2020-2024
    • Market Size Value (USD Billion) & Volume (Thousand Metric Tons) Forecast By Market Taxonomy, 2025-2035
      • By Country
        • India
        • Australia & New Zealand
        • ASEAN
        • Rest of SAP
      • By Form
      • By Nature
      • By Application
      • By Sales Channel
    • Market Attractiveness Analysis
      • By Country
      • By Form
      • By Nature
      • By Application
      • By Sales Channel
    • Key Takeaways
  17. Middle East and Africa Market Analysis 2020-2024 and Forecast 2025-2035, By Country
    • Historical Market Size Value (USD Billion) & Volume (Thousand Metric Tons) Trend Analysis By Market Taxonomy, 2020-2024
    • Market Size Value (USD Billion) & Volume (Thousand Metric Tons) Forecast By Market Taxonomy, 2025-2035
      • By Country
        • GCC Countries
        • Northern Africa
        • South Africa
        • Turkiye
        • Rest of MEA
      • By Form
      • By Nature
      • By Application
      • By Sales Channel
    • Market Attractiveness Analysis
      • By Country
      • By Form
      • By Nature
      • By Application
      • By Sales Channel
    • Key Takeaways
  18. Key Countries Market Analysis
    • USA
      • Pricing Analysis
      • Market Share Analysis, 2024
        • By Form
        • By Nature
        • By Application
        • By Sales Channel
    • Canada
      • Pricing Analysis
      • Market Share Analysis, 2024
        • By Form
        • By Nature
        • By Application
        • By Sales Channel
    • Brazil
      • Pricing Analysis
      • Market Share Analysis, 2024
        • By Form
        • By Nature
        • By Application
        • By Sales Channel
    • Mexico
      • Pricing Analysis
      • Market Share Analysis, 2024
        • By Form
        • By Nature
        • By Application
        • By Sales Channel
    • Argentina
      • Pricing Analysis
      • Market Share Analysis, 2024
        • By Form
        • By Nature
        • By Application
        • By Sales Channel
  19. Market Structure Analysis
    • Competition Dashboard
    • Competition Benchmarking
    • Market Share Analysis of Top Players
      • By Regional
      • By Form
      • By Nature
      • By Application
      • By Sales Channel
  20. Competition Analysis
    • Competition Deep Dive
      • Naturel West Corp
        • Overview
        • Product Portfolio
        • Profitability by Market Segments (Product/Age /Sales Channel/Region)
        • Sales Footprint
        • Strategy Overview
          • Marketing Strategy
          • Product Strategy
          • Channel Strategy
      • Sensus
        • Overview
        • Product Portfolio
        • Profitability by Market Segments (Product/Age /Sales Channel/Region)
        • Sales Footprint
        • Strategy Overview
          • Marketing Strategy
          • Product Strategy
          • Channel Strategy
      • The Tierra Group
        • Overview
        • Product Portfolio
        • Profitability by Market Segments (Product/Age /Sales Channel/Region)
        • Sales Footprint
        • Strategy Overview
          • Marketing Strategy
          • Product Strategy
          • Channel Strategy
      • AGAVE CANADA
        • Overview
        • Product Portfolio
        • Profitability by Market Segments (Product/Age /Sales Channel/Region)
        • Sales Footprint
        • Strategy Overview
          • Marketing Strategy
          • Product Strategy
          • Channel Strategy
      • Nutra Food Ingredients
        • Overview
        • Product Portfolio
        • Profitability by Market Segments (Product/Age /Sales Channel/Region)
        • Sales Footprint
        • Strategy Overview
          • Marketing Strategy
          • Product Strategy
          • Channel Strategy
      • LOC Industries
        • Overview
        • Product Portfolio
        • Profitability by Market Segments (Product/Age /Sales Channel/Region)
        • Sales Footprint
        • Strategy Overview
          • Marketing Strategy
          • Product Strategy
          • Channel Strategy
      • Beneo
        • Overview
        • Product Portfolio
        • Profitability by Market Segments (Product/Age /Sales Channel/Region)
        • Sales Footprint
        • Strategy Overview
          • Marketing Strategy
          • Product Strategy
          • Channel Strategy
      • Pyure Brands
        • Overview
        • Product Portfolio
        • Profitability by Market Segments (Product/Age /Sales Channel/Region)
        • Sales Footprint
        • Strategy Overview
          • Marketing Strategy
          • Product Strategy
          • Channel Strategy
      • Maretai Organics
        • Overview
        • Product Portfolio
        • Profitability by Market Segments (Product/Age /Sales Channel/Region)
        • Sales Footprint
        • Strategy Overview
          • Marketing Strategy
          • Product Strategy
          • Channel Strategy
      • 21 Missions’ Organics
        • Overview
        • Product Portfolio
        • Profitability by Market Segments (Product/Age /Sales Channel/Region)
        • Sales Footprint
        • Strategy Overview
          • Marketing Strategy
          • Product Strategy
          • Channel Strategy
      • EDULAG
        • Overview
        • Product Portfolio
        • Profitability by Market Segments (Product/Age /Sales Channel/Region)
        • Sales Footprint
        • Strategy Overview
          • Marketing Strategy
          • Product Strategy
          • Channel Strategy
      • Ciranda
        • Overview
        • Product Portfolio
        • Profitability by Market Segments (Product/Age /Sales Channel/Region)
        • Sales Footprint
        • Strategy Overview
          • Marketing Strategy
          • Product Strategy
          • Channel Strategy
  21. Assumptions & Acronyms Used
  22. Research Methodology

List of Tables

  • Table 1: Global Market Value (USD Billion) Forecast by Region, 2020-2035
  • Table 2: Global Market Volume (Thousand Metric Tons) Forecast by Region, 2020-2035
  • Table 3: Global Market Value (USD Billion) Forecast by Form, 2020-2035
  • Table 4: Global Market Volume (Thousand Metric Tons) Forecast by Form, 2020-2035
  • Table 5: Global Market Value (USD Billion) Forecast by Nature, 2020-2035
  • Table 6: Global Market Volume (Thousand Metric Tons) Forecast by Nature, 2020-2035
  • Table 7: Global Market Value (USD Billion) Forecast by Application, 2020-2035
  • Table 8: Global Market Volume (Thousand Metric Tons) Forecast by Application, 2020-2035
  • Table 9: Global Market Value (USD Billion) Forecast by Sales Channel, 2020-2035
  • Table 10: Global Market Volume (Thousand Metric Tons) Forecast by Sales Channel, 2020-2035
  • Table 11: North America Market Value (USD Billion) Forecast by Country, 2020-2035
  • Table 12: North America Market Volume (Thousand Metric Tons) Forecast by Country, 2020-2035
  • Table 13: North America Market Value (USD Billion) Forecast by Form, 2020-2035
  • Table 14: North America Market Volume (Thousand Metric Tons) Forecast by Form, 2020-2035
  • Table 15: North America Market Value (USD Billion) Forecast by Nature, 2020-2035
  • Table 16: North America Market Volume (Thousand Metric Tons) Forecast by Nature, 2020-2035
  • Table 17: North America Market Value (USD Billion) Forecast by Application, 2020-2035
  • Table 18: North America Market Volume (Thousand Metric Tons) Forecast by Application, 2020-2035
  • Table 19: North America Market Value (USD Billion) Forecast by Sales Channel, 2020-2035
  • Table 20: North America Market Volume (Thousand Metric Tons) Forecast by Sales Channel, 2020-2035
  • Table 21: Latin America Market Value (USD Billion) Forecast by Country, 2020-2035
  • Table 22: Latin America Market Volume (Thousand Metric Tons) Forecast by Country, 2020-2035
  • Table 23: Latin America Market Value (USD Billion) Forecast by Form, 2020-2035
  • Table 24: Latin America Market Volume (Thousand Metric Tons) Forecast by Form, 2020-2035
  • Table 25: Latin America Market Value (USD Billion) Forecast by Nature, 2020-2035
  • Table 26: Latin America Market Volume (Thousand Metric Tons) Forecast by Nature, 2020-2035
  • Table 27: Latin America Market Value (USD Billion) Forecast by Application, 2020-2035
  • Table 28: Latin America Market Volume (Thousand Metric Tons) Forecast by Application, 2020-2035
  • Table 29: Latin America Market Value (USD Billion) Forecast by Sales Channel, 2020-2035
  • Table 30: Latin America Market Volume (Thousand Metric Tons) Forecast by Sales Channel, 2020-2035
  • Table 31: Western Europe Market Value (USD Billion) Forecast by Country, 2020-2035
  • Table 32: Western Europe Market Volume (Thousand Metric Tons) Forecast by Country, 2020-2035
  • Table 33: Western Europe Market Value (USD Billion) Forecast by Form, 2020-2035
  • Table 34: Western Europe Market Volume (Thousand Metric Tons) Forecast by Form, 2020-2035
  • Table 35: Western Europe Market Value (USD Billion) Forecast by Nature, 2020-2035
  • Table 36: Western Europe Market Volume (Thousand Metric Tons) Forecast by Nature, 2020-2035
  • Table 37: Western Europe Market Value (USD Billion) Forecast by Application, 2020-2035
  • Table 38: Western Europe Market Volume (Thousand Metric Tons) Forecast by Application, 2020-2035
  • Table 39: Western Europe Market Value (USD Billion) Forecast by Sales Channel, 2020-2035
  • Table 40: Western Europe Market Volume (Thousand Metric Tons) Forecast by Sales Channel, 2020-2035
  • Table 41: Eastern Europe Market Value (USD Billion) Forecast by Country, 2020-2035
  • Table 42: Eastern Europe Market Volume (Thousand Metric Tons) Forecast by Country, 2020-2035
  • Table 43: Eastern Europe Market Value (USD Billion) Forecast by Form, 2020-2035
  • Table 44: Eastern Europe Market Volume (Thousand Metric Tons) Forecast by Form, 2020-2035
  • Table 45: Eastern Europe Market Value (USD Billion) Forecast by Nature, 2020-2035
  • Table 46: Eastern Europe Market Volume (Thousand Metric Tons) Forecast by Nature, 2020-2035
  • Table 47: Eastern Europe Market Value (USD Billion) Forecast by Application, 2020-2035
  • Table 48: Eastern Europe Market Volume (Thousand Metric Tons) Forecast by Application, 2020-2035
  • Table 49: Eastern Europe Market Value (USD Billion) Forecast by Sales Channel, 2020-2035
  • Table 50: Eastern Europe Market Volume (Thousand Metric Tons) Forecast by Sales Channel, 2020-2035
  • Table 51: East Asia Market Value (USD Billion) Forecast by Country, 2020-2035
  • Table 52: East Asia Market Volume (Thousand Metric Tons) Forecast by Country, 2020-2035
  • Table 53: East Asia Market Value (USD Billion) Forecast by Form, 2020-2035
  • Table 54: East Asia Market Volume (Thousand Metric Tons) Forecast by Form, 2020-2035
  • Table 55: East Asia Market Value (USD Billion) Forecast by Nature, 2020-2035
  • Table 56: East Asia Market Volume (Thousand Metric Tons) Forecast by Nature, 2020-2035
  • Table 57: East Asia Market Value (USD Billion) Forecast by Application, 2020-2035
  • Table 58: East Asia Market Volume (Thousand Metric Tons) Forecast by Application, 2020-2035
  • Table 59: East Asia Market Value (USD Billion) Forecast by Sales Channel, 2020-2035
  • Table 60: East Asia Market Volume (Thousand Metric Tons) Forecast by Sales Channel, 2020-2035
  • Table 61: South Asia & Pacific Market Value (USD Billion) Forecast by Country, 2020-2035
  • Table 62: South Asia & Pacific Market Volume (Thousand Metric Tons) Forecast by Country, 2020-2035
  • Table 63: South Asia & Pacific Market Value (USD Billion) Forecast by Form, 2020-2035
  • Table 64: South Asia & Pacific Market Volume (Thousand Metric Tons) Forecast by Form, 2020-2035
  • Table 65: South Asia & Pacific Market Value (USD Billion) Forecast by Nature, 2020-2035
  • Table 66: South Asia & Pacific Market Volume (Thousand Metric Tons) Forecast by Nature, 2020-2035
  • Table 67: South Asia & Pacific Market Value (USD Billion) Forecast by Application, 2020-2035
  • Table 68: South Asia & Pacific Market Volume (Thousand Metric Tons) Forecast by Application, 2020-2035
  • Table 69: South Asia & Pacific Market Value (USD Billion) Forecast by Sales Channel, 2020-2035
  • Table 70: South Asia & Pacific Market Volume (Thousand Metric Tons) Forecast by Sales Channel, 2020-2035
  • Table 71: Middle East and Africa Market Value (USD Billion) Forecast by Country, 2020-2035
  • Table 72: Middle East and Africa Market Volume (Thousand Metric Tons) Forecast by Country, 2020-2035
  • Table 73: Middle East and Africa Market Value (USD Billion) Forecast by Form, 2020-2035
  • Table 74: Middle East and Africa Market Volume (Thousand Metric Tons) Forecast by Form, 2020-2035
  • Table 75: Middle East and Africa Market Value (USD Billion) Forecast by Nature, 2020-2035
  • Table 76: Middle East and Africa Market Volume (Thousand Metric Tons) Forecast by Nature, 2020-2035
  • Table 77: Middle East and Africa Market Value (USD Billion) Forecast by Application, 2020-2035
  • Table 78: Middle East and Africa Market Volume (Thousand Metric Tons) Forecast by Application, 2020-2035
  • Table 79: Middle East and Africa Market Value (USD Billion) Forecast by Sales Channel, 2020-2035
  • Table 80: Middle East and Africa Market Volume (Thousand Metric Tons) Forecast by Sales Channel, 2020-2035

List of Figures

  • Figure 1: Global Market Volume (Thousand Metric Tons) Forecast 2020-2035
  • Figure 2: Global Market Pricing Analysis
  • Figure 3: Global Market Value (USD Billion) Forecast 2020-2035
  • Figure 4: Global Market Value Share and BPS Analysis by Form, 2025 and 2035
  • Figure 5: Global Market Y-o-Y Growth Comparison by Form, 2025-2035
  • Figure 6: Global Market Attractiveness Analysis by Form
  • Figure 7: Global Market Value Share and BPS Analysis by Nature, 2025 and 2035
  • Figure 8: Global Market Y-o-Y Growth Comparison by Nature, 2025-2035
  • Figure 9: Global Market Attractiveness Analysis by Nature
  • Figure 10: Global Market Value Share and BPS Analysis by Application, 2025 and 2035
  • Figure 11: Global Market Y-o-Y Growth Comparison by Application, 2025-2035
  • Figure 12: Global Market Attractiveness Analysis by Application
  • Figure 13: Global Market Value Share and BPS Analysis by Sales Channel, 2025 and 2035
  • Figure 14: Global Market Y-o-Y Growth Comparison by Sales Channel, 2025-2035
  • Figure 15: Global Market Attractiveness Analysis by Sales Channel
  • Figure 16: Global Market Value (USD Billion) Share and BPS Analysis by Region, 2025 and 2035
  • Figure 17: Global Market Y-o-Y Growth Comparison by Region, 2025-2035
  • Figure 18: Global Market Attractiveness Analysis by Region
  • Figure 19: North America Market Incremental $ Opportunity, 2025-2035
  • Figure 20: Latin America Market Incremental $ Opportunity, 2025-2035
  • Figure 21: Western Europe Market Incremental $ Opportunity, 2025-2035
  • Figure 22: Eastern Europe Market Incremental $ Opportunity, 2025-2035
  • Figure 23: East Asia Market Incremental $ Opportunity, 2025-2035
  • Figure 24: South Asia & Pacific Market Incremental $ Opportunity, 2025-2035
  • Figure 25: Middle East and Africa Market Incremental $ Opportunity, 2025-2035
  • Figure 26: North America Market Value Share and BPS Analysis by Country, 2025 and 2035
  • Figure 27: North America Market Value Share and BPS Analysis by Form, 2025 and 2035
  • Figure 28: North America Market Y-o-Y Growth Comparison by Form, 2025-2035
  • Figure 29: North America Market Attractiveness Analysis by Form
  • Figure 30: North America Market Value Share and BPS Analysis by Nature, 2025 and 2035
  • Figure 31: North America Market Y-o-Y Growth Comparison by Nature, 2025-2035
  • Figure 32: North America Market Attractiveness Analysis by Nature
  • Figure 33: North America Market Value Share and BPS Analysis by Application, 2025 and 2035
  • Figure 34: North America Market Y-o-Y Growth Comparison by Application, 2025-2035
  • Figure 35: North America Market Attractiveness Analysis by Application
  • Figure 36: North America Market Value Share and BPS Analysis by Sales Channel, 2025 and 2035
  • Figure 37: North America Market Y-o-Y Growth Comparison by Sales Channel, 2025-2035
  • Figure 38: North America Market Attractiveness Analysis by Sales Channel
  • Figure 39: Latin America Market Value Share and BPS Analysis by Country, 2025 and 2035
  • Figure 40: Latin America Market Value Share and BPS Analysis by Form, 2025 and 2035
  • Figure 41: Latin America Market Y-o-Y Growth Comparison by Form, 2025-2035
  • Figure 42: Latin America Market Attractiveness Analysis by Form
  • Figure 43: Latin America Market Value Share and BPS Analysis by Nature, 2025 and 2035
  • Figure 44: Latin America Market Y-o-Y Growth Comparison by Nature, 2025-2035
  • Figure 45: Latin America Market Attractiveness Analysis by Nature
  • Figure 46: Latin America Market Value Share and BPS Analysis by Application, 2025 and 2035
  • Figure 47: Latin America Market Y-o-Y Growth Comparison by Application, 2025-2035
  • Figure 48: Latin America Market Attractiveness Analysis by Application
  • Figure 49: Latin America Market Value Share and BPS Analysis by Sales Channel, 2025 and 2035
  • Figure 50: Latin America Market Y-o-Y Growth Comparison by Sales Channel, 2025-2035
  • Figure 51: Latin America Market Attractiveness Analysis by Sales Channel
  • Figure 52: Western Europe Market Value Share and BPS Analysis by Country, 2025 and 2035
  • Figure 53: Western Europe Market Value Share and BPS Analysis by Form, 2025 and 2035
  • Figure 54: Western Europe Market Y-o-Y Growth Comparison by Form, 2025-2035
  • Figure 55: Western Europe Market Attractiveness Analysis by Form
  • Figure 56: Western Europe Market Value Share and BPS Analysis by Nature, 2025 and 2035
  • Figure 57: Western Europe Market Y-o-Y Growth Comparison by Nature, 2025-2035
  • Figure 58: Western Europe Market Attractiveness Analysis by Nature
  • Figure 59: Western Europe Market Value Share and BPS Analysis by Application, 2025 and 2035
  • Figure 60: Western Europe Market Y-o-Y Growth Comparison by Application, 2025-2035
  • Figure 61: Western Europe Market Attractiveness Analysis by Application
  • Figure 62: Western Europe Market Value Share and BPS Analysis by Sales Channel, 2025 and 2035
  • Figure 63: Western Europe Market Y-o-Y Growth Comparison by Sales Channel, 2025-2035
  • Figure 64: Western Europe Market Attractiveness Analysis by Sales Channel
  • Figure 65: Eastern Europe Market Value Share and BPS Analysis by Country, 2025 and 2035
  • Figure 66: Eastern Europe Market Value Share and BPS Analysis by Form, 2025 and 2035
  • Figure 67: Eastern Europe Market Y-o-Y Growth Comparison by Form, 2025-2035
  • Figure 68: Eastern Europe Market Attractiveness Analysis by Form
  • Figure 69: Eastern Europe Market Value Share and BPS Analysis by Nature, 2025 and 2035
  • Figure 70: Eastern Europe Market Y-o-Y Growth Comparison by Nature, 2025-2035
  • Figure 71: Eastern Europe Market Attractiveness Analysis by Nature
  • Figure 72: Eastern Europe Market Value Share and BPS Analysis by Application, 2025 and 2035
  • Figure 73: Eastern Europe Market Y-o-Y Growth Comparison by Application, 2025-2035
  • Figure 74: Eastern Europe Market Attractiveness Analysis by Application
  • Figure 75: Eastern Europe Market Value Share and BPS Analysis by Sales Channel, 2025 and 2035
  • Figure 76: Eastern Europe Market Y-o-Y Growth Comparison by Sales Channel, 2025-2035
  • Figure 77: Eastern Europe Market Attractiveness Analysis by Sales Channel
  • Figure 78: East Asia Market Value Share and BPS Analysis by Country, 2025 and 2035
  • Figure 79: East Asia Market Value Share and BPS Analysis by Form, 2025 and 2035
  • Figure 80: East Asia Market Y-o-Y Growth Comparison by Form, 2025-2035
  • Figure 81: East Asia Market Attractiveness Analysis by Form
  • Figure 82: East Asia Market Value Share and BPS Analysis by Nature, 2025 and 2035
  • Figure 83: East Asia Market Y-o-Y Growth Comparison by Nature, 2025-2035
  • Figure 84: East Asia Market Attractiveness Analysis by Nature
  • Figure 85: East Asia Market Value Share and BPS Analysis by Application, 2025 and 2035
  • Figure 86: East Asia Market Y-o-Y Growth Comparison by Application, 2025-2035
  • Figure 87: East Asia Market Attractiveness Analysis by Application
  • Figure 88: East Asia Market Value Share and BPS Analysis by Sales Channel, 2025 and 2035
  • Figure 89: East Asia Market Y-o-Y Growth Comparison by Sales Channel, 2025-2035
  • Figure 90: East Asia Market Attractiveness Analysis by Sales Channel
  • Figure 91: South Asia & Pacific Market Value Share and BPS Analysis by Country, 2025 and 2035
  • Figure 92: South Asia & Pacific Market Value Share and BPS Analysis by Form, 2025 and 2035
  • Figure 93: South Asia & Pacific Market Y-o-Y Growth Comparison by Form, 2025-2035
  • Figure 94: South Asia & Pacific Market Attractiveness Analysis by Form
  • Figure 95: South Asia & Pacific Market Value Share and BPS Analysis by Nature, 2025 and 2035
  • Figure 96: South Asia & Pacific Market Y-o-Y Growth Comparison by Nature, 2025-2035
  • Figure 97: South Asia & Pacific Market Attractiveness Analysis by Nature
  • Figure 98: South Asia & Pacific Market Value Share and BPS Analysis by Application, 2025 and 2035
  • Figure 99: South Asia & Pacific Market Y-o-Y Growth Comparison by Application, 2025-2035
  • Figure 100: South Asia & Pacific Market Attractiveness Analysis by Application
  • Figure 101: South Asia & Pacific Market Value Share and BPS Analysis by Sales Channel, 2025 and 2035
  • Figure 102: South Asia & Pacific Market Y-o-Y Growth Comparison by Sales Channel, 2025-2035
  • Figure 103: South Asia & Pacific Market Attractiveness Analysis by Sales Channel
  • Figure 104: Middle East and Africa Market Value Share and BPS Analysis by Country, 2025 and 2035
  • Figure 105: Middle East and Africa Market Value Share and BPS Analysis by Form, 2025 and 2035
  • Figure 106: Middle East and Africa Market Y-o-Y Growth Comparison by Form, 2025-2035
  • Figure 107: Middle East and Africa Market Attractiveness Analysis by Form
  • Figure 108: Middle East and Africa Market Value Share and BPS Analysis by Nature, 2025 and 2035
  • Figure 109: Middle East and Africa Market Y-o-Y Growth Comparison by Nature, 2025-2035
  • Figure 110: Middle East and Africa Market Attractiveness Analysis by Nature
  • Figure 111: Middle East and Africa Market Value Share and BPS Analysis by Application, 2025 and 2035
  • Figure 112: Middle East and Africa Market Y-o-Y Growth Comparison by Application, 2025-2035
  • Figure 113: Middle East and Africa Market Attractiveness Analysis by Application
  • Figure 114: Middle East and Africa Market Value Share and BPS Analysis by Sales Channel, 2025 and 2035
  • Figure 115: Middle East and Africa Market Y-o-Y Growth Comparison by Sales Channel, 2025-2035
  • Figure 116: Middle East and Africa Market Attractiveness Analysis by Sales Channel
  • Figure 117: Global Market - Tier Structure Analysis
  • Figure 118: Global Market - Company Share Analysis

Frequently Asked Questions

What is the projected industry size of the agave inulin market by 2035?

The industry is projected to reach USD 3.50 billion by 2035.

What is the estimated CAGR of the agave inulin market from 2025 to 2035?

The industry is expected to grow at a CAGR of 4.6% from 2025 to 2035.

Which segment will dominate the agave inulin market in 2025?

Liquid form will dominate the industry with a 60% share in 2025.

What is the industry value of the agave inulin market in 2025?

It is projected to be USD 2.23 billion in 2025.

Which region will lead the growth in the agave inulin market?

South Asia, with India leading at a CAGR of 6.6%, is expected to drive the growth.

Explore Similar Insights

Future Market Insights

Agave Inulin Market