Reusable Packing Market Size and Share Forecast Outlook 2025 to 2035

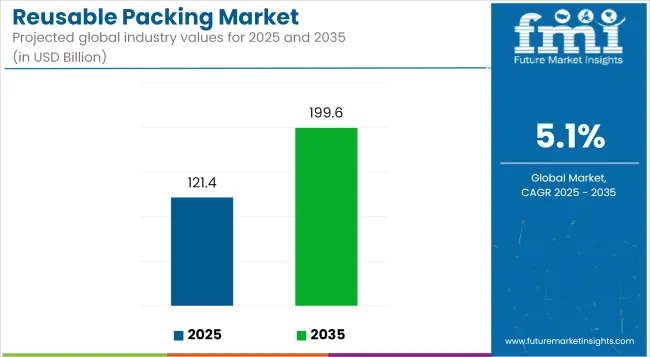
The reusable packing market is projected to grow from USD 121.4 billion in 2025 to USD 199.6 billion by 2035, registering a CAGR of 5.1% during the forecast period. Sales in 2024 reached USD 115.5 billion. The rise in industrial automation, combined with growing e-commerce logistics, has boosted the adoption of reusable transit solutions.
Quick Stats of Reusable Packing Market

  • Market Value (2025): USD 121.4 billion
  • Forecast Value (2035): USD 199.6 billion
  • Forecast CAGR: 5.1%
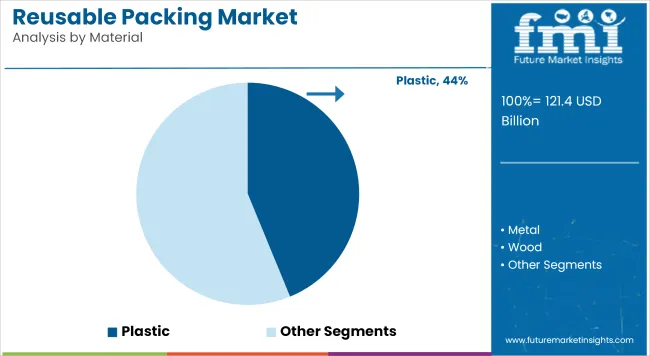
  • Material Leader in 2025: Plastic (43.8% market share)
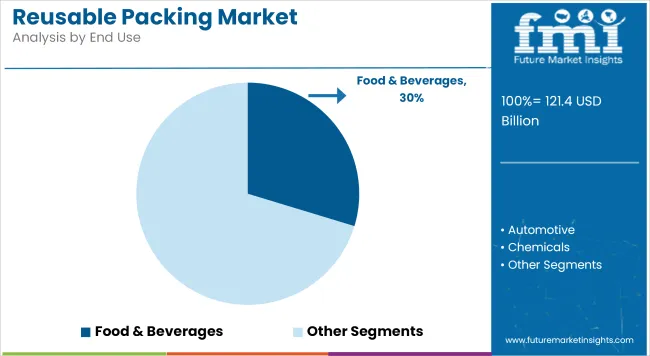
  • Top End Use: Food & beverages (29.7% share)
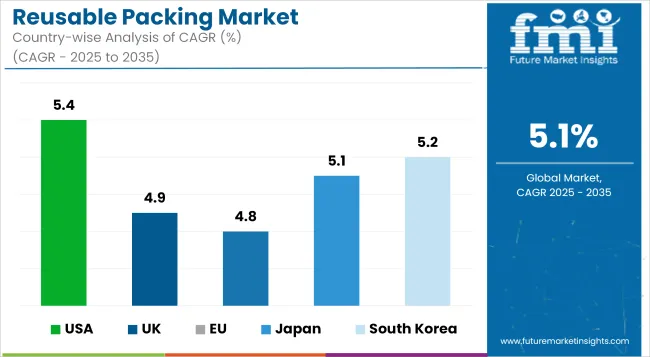
  • Key Growth Country: USA (USA is the fastest-growing market with 5.4% CAGR)

Reusable Packing Market Industry Value Analysis

Metric Value
Market Size in 2025 USD 121.4 billion
Projected Market Size in 2035 USD 199.6 billion
CAGR (2025 to 2035) 5.1%

Lightweight, durable materials and advanced folding mechanisms have been integrated to streamline return cycles. Retailers and FMCG sectors have adopted bulk containers and reusable totes to minimize single-use plastic waste. Standardization of crate dimensions for warehouse robotics has further strengthened product demand.

In November 2024, ORBIS to Showcase Reusable Packaging Products that Play a Pivotal Role in Optimizing Supply Chains at PACK EXPO International 2024. “At ORBIS, we recognize that a better way to a more sustainable supply chain starts with reusable packaging” said Lynn Hediger, vice-president of product management.

“Our integrated portfolio of products and solutions enhance supply chain efficiency and sustainability-driven ROI. We’re excited to showcase our commitment to demonstrating what a more efficient, sustainable and resilient supply chain looks like for our customers and how it can greatly benefit their business while also serving a greater good.”

Strong demand for closed-loop logistics, coupled with legislation limiting single-use packaging, is expected to create sustained growth opportunities for reusable packing providers. Market expansion is projected to continue in cold chain applications, particularly for pharmaceuticals and perishables.

Digital tracking tools and blockchain integration are forecast to become standard in reusable asset management. Long-term contracts with manufacturers, retailers, and 3PLs are being signed to stabilize container rotations and reduce loss rates. Regional governments are expected to offer incentives for circular packaging practices, fueling further adoption.

Sustainability mandates and corporate net-zero roadmaps have played a crucial role in shaping innovation within the reusable packing market. Emphasis has been placed on lightweight polymer compositions that resist degradation during multiple use cycles.

Machine-washable, collapsible crates and pallets have been engineered to reduce both logistics costs and material waste. Integration of smart labels and IoT tags has enhanced product traceability across return loops.

Carbon tracking systems have been embedded to align with ESG reporting metrics. Modular component replacements have been developed to extend lifespan and lower maintenance overheads. Partnerships between packaging firms and retailers have accelerated innovation in rental-based reusable solutions. These product designs have been tailored for high-density shipping and compatibility with robotic material handling.

Analyzing Reusable Packing Market by Top Investment Segments

The market is segmented based on material, product type, end-use industry, distribution channel, and region. By material, the market includes plastic, metal, wood, glass, foam, textile/fabric, and composite materials. In terms of product type, the market is categorized into pallets, crates, dunnage, intermediate bulk containers (IBC), boxes, drums & barrels, reusable bags & sacks, and trays & racks.

By end-use industry, the market comprises food & beverages, automotive, chemicals, building & construction, pharmaceuticals, logistics & transportation, consumer durables, retail & e-commerce, and agriculture.

Based on distribution channel, the market is segmented into direct-to-business (B2B), third-party logistics providers (3PLs), and reusable packaging pools (e.g., CHEP, IFCO). Regionally, the market is analyzed across North America, Latin America, East Asia, South Asia & Pacific, Eastern Europe, Western Europe, Oceania, and the Middle East & Africa.

Plastic Selected Widely for Its Durability, Cost Efficiency, and Lightweight Design

Plastic has been estimated to account for 43.8% of the global reusable packaging market in 2025, due to its combination of durability, low weight, and mold ability. High-density polyethylene (HDPE), polypropylene (PP), and PET have been predominantly used for crates, pallets, bins, and containers.

These materials have enabled long service life and easy cleaning, making them ideal for circular supply chains. Plastic packaging has been designed to withstand repeated handling and stacking stress. The use of plastic in reusable formats has reduced single-use waste and improved handling efficiency across logistics hubs and warehouses.

Interlocking features, RFID tagging compatibility, and weather resistance have added to their appeal. Design innovations such as foldable totes and collapsible crates have been deployed to save reverse logistics costs. Food-safe plastic containers have ensured hygienic transport for perishables and beverages.

Plastic reusable packaging has been preferred across both automated and manual loading operations. Standardized footprints and stack ability have facilitated integration into conveyor and shelving systems. Due to its recyclability, post-consumer and post-industrial plastic content has been increasingly adopted in manufacturing.

Sustainability certifications have been applied to plastic-based systems to support brand goals. With advancements in material blends and reinforcements, impact-resistant and antimicrobial plastics are being introduced for sensitive applications.

The shift to circular packaging models in retail and B2B supply chains has further accelerated adoption. Plastic's reusability has aligned with cost-saving goals and ESG compliance strategies. As a result, plastic is expected to remain the dominant material type in the reusable packaging segment.
Reusable Packing Market Analysis By Material

Food & Beverage Industry Drives Demand with Hygiene and Rotation Needs

The food & beverages sector has been projected to hold 29.7% of the reusable packaging market share in 2025, owing to high-volume product movement, perishability, and hygiene requirements. Reusable crates, bins, and pallets have been widely employed for produce, bakery items, meat, dairy, and bottled beverages.

Returnable packaging has ensured product safety, temperature control, and contamination prevention across cold chains. Compliance with food-grade standards has been consistently met through washable and sanitized systems.

Retail grocers, food processors, and beverage bottlers have adopted reusable packaging to reduce plastic waste and streamline backhaul logistics. Closed-loop systems have enabled consistent crate rotation, especially for short-distance and regional supply chains. The adoption of barcoded and RFID-enabled containers has enhanced traceability. Ease of stacking and handling has reduced labor costs and product damage.

With the rise in online grocery and meal kit delivery, reusable totes and bins have gained importance in warehouse-to-doorstep models. Reusable beverage crates and racks have been used to transport water, soda, and beer efficiently across distribution centers and retail shelves.

Return programs and deposit systems have supported crate recovery in urban and rural zones. These systems have been optimized for temperature control and operational sustainability. Going forward, regulatory policies targeting single-use packaging are expected to further promote reusable formats across the F&B value chain.

Innovation in modular, insulated, and tamper-evident packaging designs is being prioritized. Regional co-ops and retailer partnerships have supported shared container pools. As consumption volumes and sustainability expectations increase, the food and beverage sector is set to lead reusable packaging demand globally.
Reusable Packing Market Analysis By End Use

Challenges and Opportunities

Challenges

High Initial Costs and Reverse Logistics Complexity

High setup cost of durable containers, tracking equipment, and cleaning facilities is limiting market growth. The major challenges include the complication in terms of reverse logistics in the metropolitan last-mile and global shipping as collection of reusable packaging entails logistical, operational and environmental expenses. Moreover, the lack of standardisation in packaging formats and conflictual regulatory guidelines on reuse versus recyclability can result in confusion amongst consumers and corporations alike.

Opportunities

Sustainability Mandates, Circular Economy Momentum, and Smart Tracking Technologies

Growing pressure to eliminate single-use plastics and achieve corporate ESG objectives is driving the transition to reusable packaging systems throughout retail, foodservice, logistics, e-commerce, and industrial applications. Improvements in intelligent RFID/NFC tracking, collapsible pack design, antimicrobial protection and blockchain-traceability are improving system performance.

Public-private partnerships are paving the way to adoption at scale with city-wide reuse models and subscription-return logistics. The rise of conscious consumers, especially Gen Z and Millennials also is driving demand for reuse-based business models.

Country-wise Outlook

United States

The United States reusable packing market is booming at a robust pace, supported by increasing sustainability pledges made by big box retailers, logistics companies, and food delivery services. Corporate-Companion: Eliminating harmful single-use plastics through durable, reusable containers and totes to reduce environmental impact and meet ESG expectations.

Audiences are growing especially in e-commerce, where reusable shipping boxes, insulated delivery bags and collapsible crates are being adopted to reduce packaging waste. Startups with closed-loop packaging systems for online orders are also becoming popular.

Country CAGR (2025 to 2035)
USA 5.4%

United Kingdom

Environmental directives banning single-use packaging and a growing consumer base that back affordable eco-friendly substitutes drive the steady momentum of UK's Reusable Packing industry. Supermarkets, restaurant chains and fashion retailers are testing reusable packaging schemes including returnable delivery boxes and refill pouches.

Government support for circular economy initiatives and investments in reuse infrastructure (such as reverse logistics and washing centers) are driving adoption.

Country CAGR (2025 to 2035)
UK 4.9%

European Union

Underpinned by an ambitious framework of sustainability legislation, the EU reusable packing market is consistently growing; the EU packaging waste directive, a cornerstone agreement currently under discussion, as well as the EU circular economy action plan, opened a pathway towards a circular economy, which facilitates in-depth development of the EU reusable packing market.

Germany, France, and the Netherlands are widely recognized leaders in reusable packaging systems, featuring widely used systems in beverage, foodservice, and retail logistics. Disposable bags, cups and containers are being replaced with reusable plastic crates, pallets, kegs and containers in B2B supply chains, while reuse platforms that directly touch the consumer are sprouting up across the grocery and meal-kit delivery industries.

Country CAGR (2025 to 2035)
EU 4.8%

Japan

The Japan market for reusable packing remains in upward trajectory, aided by the countries deep-rooted culture of cleanliness, efficiency and waste management. Reusable containers used in retail, food delivery, and electronics logistics are on the rise to curb packaging waste in a densely populated society.

As a result, some retailers and logistics companies are developing new stackable, space-saving, RFID-enabled reusable containers that allow for better traceability and turnaround efficiency. Reusable packaging standards are part of public-private partnerships among industries.

Country CAGR (2025 to 2035)
Japan 5.1%

South Korea

The South Korean reusable packing market is quickly gaining momentum, propelled by a combination of increasing environmental consciousness, urban density, and strict government regulations on plastic waste. To help minimize waste, e-commerce behemoths and food delivery services are working towards reusable packaging systems to boost their corporate image and live up to national zero-waste targets.

Reusable insulated bags, containers for takeout, and sturdy transport crates are becoming more commonplace. South Korea’s advances in smart logistics and automation are also aiding the scaling of returnable packaging systems.
Reusable Packing Market Cagr Analysis By Country

Country CAGR (2025 to 2035)
South Korea 5.2%

Competitive Outlook

The reusable packing market is growing rapidly as corporations and consumers alike are focusing on sustainability, circular economy efforts, and waste reduction. Across e-commerce, food & beverage, retail, industrial shipping, and logistics, reusable packing solutions are becoming the e-qual to single-use packaging, durable, returnable, and cost-efficient. The key growth drivers include corporate ESG initiatives, a regulatory ban on single-use plastics, and rising consumer awareness regarding sustainable consumption.
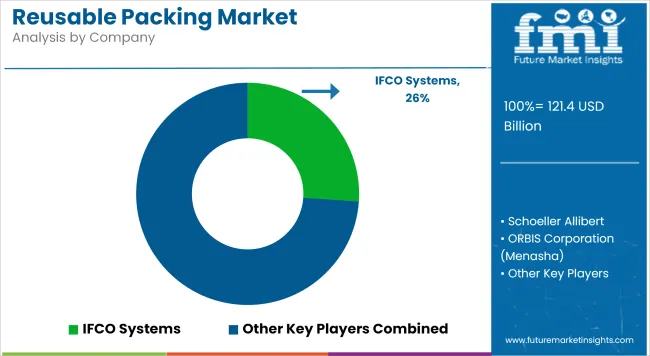
Reusable Packing Market Analysis By Company

Other Key Players

  • Returnity Innovations
  • PeliBioThermal
  • Bento Bio Inc.
  • Loop by TerraCycle
  • Tosca Ltd.

Top Segments Studied in the Reusable Packing Market Research Report

By Material:

  • Plastic
  • Metal
  • Wood
  • Glass
  • Foam
  • Textile/Fabric
  • Composite Materials

By Product Type:

  • Pallets
  • Crates
  • Dunnage
  • Intermediate Bulk Containers (IBC)
  • Boxes
  • Drums & Barrels
  • Reusable Bags & Sacks
  • Trays & Racks

By End-use Industry:

  • Food & Beverages
  • Automotive
  • Chemicals
  • Building & Construction
  • Pharmaceuticals
  • Logistics & Transportation
  • Consumer Durables
  • Retail & E-commerce
  • Agriculture

By Distribution Channel:

  • Direct-to-Business (B2B)
  • Third-party Logistics Providers (3PLs)
  • Reusable Packaging Pools (e.g., CHEP, IFCO)

By Region:

  • North America
  • Latin America
  • East Asia
  • South Asia & Pacific
  • Eastern Europe
  • Western Europe
  • Oceania
  • Middle East & Africa

Table of Content

  1. Executive Summary
    • Global Market Outlook
    • Demand-side Trends
    • Supply-side Trends
    • Technology Roadmap Analysis
    • Analysis and Recommendations
  2. Market Overview
    • Market Coverage / Taxonomy
    • Market Definition / Scope / Limitations
  3. Market Background
    • Market Dynamics
      • Drivers
      • Restraints
      • Opportunity
      • Trends
    • Scenario Forecast
      • Demand in Optimistic Scenario
      • Demand in Likely Scenario
      • Demand in Conservative Scenario
    • Opportunity Map Analysis
    • Product Life Cycle Analysis
    • Supply Chain Analysis
      • Supply Side Participants and their Roles
        • Producers
        • Mid-Level Participants (Traders/ Agents/ Brokers)
        • Wholesalers and Distributors
      • Value Added and Value Created at Node in the Supply Chain
      • List of Raw Material Suppliers
      • List of Existing and Potential Buyer’s
    • Investment Feasibility Matrix
    • Value Chain Analysis
      • Profit Margin Analysis
      • Wholesalers and Distributors
      • Retailers
    • PESTLE and Porter’s Analysis
    • Regulatory Landscape
      • By Key Regions
      • By Key Countries
    • Regional Parent Market Outlook
    • Production and Consumption Statistics
    • Import and Export Statistics
  4. Global Market Analysis 2020-2024 and Forecast, 2025-2035
    • Historical Market Size Value (USD Million) & Volume (Units) Analysis, 2020-2024
    • Current and Future Market Size Value (USD Million) & Volume (Units) Projections, 2025-2035
      • Y-o-Y Growth Trend Analysis
      • Absolute $ Opportunity Analysis
  5. Global Market Analysis 2020-2024 and Forecast 2025-2035, By Material
    • Introduction / Key Findings
    • Historical Market Size Value (USD Million) & Volume (Units) Analysis By Material, 2020-2024
    • Current and Future Market Size Value (USD Million) & Volume (Units) Analysis and Forecast By Material, 2025-2035
      • Plastic
      • Metal
      • Wood
      • Glass
      • Foam
      • Textile/Fabric
      • Composite Materials
    • Y-o-Y Growth Trend Analysis By Material, 2020-2024
    • Absolute $ Opportunity Analysis By Material, 2025-2035
  6. Global Market Analysis 2020-2024 and Forecast 2025-2035, By Product Type
    • Introduction / Key Findings
    • Historical Market Size Value (USD Million) & Volume (Units) Analysis By Product Type, 2020-2024
    • Current and Future Market Size Value (USD Million) & Volume (Units) Analysis and Forecast By Product Type, 2025-2035
      • Pallets
      • Crates
      • Dunnage
      • Intermediate Bulk Containers (IBC)
      • Boxes
      • Drums & Barrels
      • Reusable Bags & Sacks
      • Trays & Racks
    • Y-o-Y Growth Trend Analysis By Product Type, 2020-2024
    • Absolute $ Opportunity Analysis By Product Type, 2025-2035
  7. Global Market Analysis 2020-2024 and Forecast 2025-2035, By End-use Industry
    • Introduction / Key Findings
    • Historical Market Size Value (USD Million) & Volume (Units) Analysis By End-use Industry, 2020-2024
    • Current and Future Market Size Value (USD Million) & Volume (Units) Analysis and Forecast By End-use Industry, 2025-2035
      • Food & Beverages
      • Automotive
      • Chemicals
      • Building & Construction
      • Pharmaceuticals
      • Logistics & Transportation
      • Consumer Durables
      • Retail & E-commerce
      • Agriculture
    • Y-o-Y Growth Trend Analysis By End-use Industry, 2020-2024
    • Absolute $ Opportunity Analysis By End-use Industry, 2025-2035
  8. Global Market Analysis 2020-2024 and Forecast 2025-2035, By Distribution Channel
    • Introduction / Key Findings
    • Historical Market Size Value (USD Million) & Volume (Units) Analysis By Distribution Channel, 2020-2024
    • Current and Future Market Size Value (USD Million) & Volume (Units) Analysis and Forecast By Distribution Channel, 2025-2035
      • Direct-to-Business (B2B)
      • Third-party Logistics Providers (3PLs)
      • Reusable Packaging Pools (e.g., CHEP, IFCO)
    • Y-o-Y Growth Trend Analysis By Distribution Channel, 2020-2024
    • Absolute $ Opportunity Analysis By Distribution Channel, 2025-2035
  9. Global Market Analysis 2020-2024 and Forecast 2025-2035, By Region
    • Introduction
    • Historical Market Size Value (USD Million) & Volume (Units) Analysis By Region, 2020-2024
    • Current Market Size Value (USD Million) & Volume (Units) Analysis and Forecast By Region, 2025-2035
      • North America
      • Latin America
      • Europe
      • East Asia
      • South Asia
      • Oceania
      • MEA
    • Market Attractiveness Analysis By Region
  10. North America Market Analysis 2020-2024 and Forecast 2025-2035, By Country
    • Historical Market Size Value (USD Million) & Volume (Units) Trend Analysis By Market Taxonomy, 2020-2024
    • Market Size Value (USD Million) & Volume (Units) Forecast By Market Taxonomy, 2025-2035
      • By Country
        • USA
        • Canada
      • By Material
      • By Product Type
      • By End-use Industry
      • By Distribution Channel
    • Market Attractiveness Analysis
      • By Country
      • By Material
      • By Product Type
      • By End-use Industry
      • By Distribution Channel
    • Key Takeaways
  11. Latin America Market Analysis 2020-2024 and Forecast 2025-2035, By Country
    • Historical Market Size Value (USD Million) & Volume (Units) Trend Analysis By Market Taxonomy, 2020-2024
    • Market Size Value (USD Million) & Volume (Units) Forecast By Market Taxonomy, 2025-2035
      • By Country
        • Brazil
        • Mexico
        • Argentina
        • Chile
        • Peru
        • Rest of Latin America
      • By Material
      • By Product Type
      • By End-use Industry
      • By Distribution Channel
    • Market Attractiveness Analysis
      • By Country
      • By Material
      • By Product Type
      • By End-use Industry
      • By Distribution Channel
    • Key Takeaways
  12. Europe Market Analysis 2020-2024 and Forecast 2025-2035, By Country
    • Historical Market Size Value (USD Million) & Volume (Units) Trend Analysis By Market Taxonomy, 2020-2024
    • Market Size Value (USD Million) & Volume (Units) Forecast By Market Taxonomy, 2025-2035
      • By Country
        • Germany
        • Italy
        • France
        • UK
        • Spain
        • Russia
        • BENELUX
        • Rest of Europe
      • By Material
      • By Product Type
      • By End-use Industry
      • By Distribution Channel
    • Market Attractiveness Analysis
      • By Country
      • By Material
      • By Product Type
      • By End-use Industry
      • By Distribution Channel
    • Key Takeaways
  13. East Asia Market Analysis 2020-2024 and Forecast 2025-2035, By Country
    • Historical Market Size Value (USD Million) & Volume (Units) Trend Analysis By Market Taxonomy, 2020-2024
    • Market Size Value (USD Million) & Volume (Units) Forecast By Market Taxonomy, 2025-2035
      • By Country
        • China
        • Japan
        • South Korea
      • By Material
      • By Product Type
      • By End-use Industry
      • By Distribution Channel
    • Market Attractiveness Analysis
      • By Country
      • By Material
      • By Product Type
      • By End-use Industry
      • By Distribution Channel
    • Key Takeaways
  14. South Asia Market Analysis 2020-2024 and Forecast 2025-2035, By Country
    • Historical Market Size Value (USD Million) & Volume (Units) Trend Analysis By Market Taxonomy, 2020-2024
    • Market Size Value (USD Million) & Volume (Units) Forecast By Market Taxonomy, 2025-2035
      • By Country
        • India
        • Thailand
        • Malaysia
        • Indonesia
        • Rest of South Asia
      • By Material
      • By Product Type
      • By End-use Industry
      • By Distribution Channel
    • Market Attractiveness Analysis
      • By Country
      • By Material
      • By Product Type
      • By End-use Industry
      • By Distribution Channel
    • Key Takeaways
  15. Oceania Market Analysis 2020-2024 and Forecast 2025-2035, By Country
    • Historical Market Size Value (USD Million) & Volume (Units) Trend Analysis By Market Taxonomy, 2020-2024
    • Market Size Value (USD Million) & Volume (Units) Forecast By Market Taxonomy, 2025-2035
      • By Country
        • Australia
        • New Zealand
      • By Material
      • By Product Type
      • By End-use Industry
      • By Distribution Channel
    • Market Attractiveness Analysis
      • By Country
      • By Material
      • By Product Type
      • By End-use Industry
      • By Distribution Channel
    • Key Takeaways
  16. MEA Market Analysis 2020-2024 and Forecast 2025-2035, By Country
    • Historical Market Size Value (USD Million) & Volume (Units) Trend Analysis By Market Taxonomy, 2020-2024
    • Market Size Value (USD Million) & Volume (Units) Forecast By Market Taxonomy, 2025-2035
      • By Country
        • GCC
        • Rest of MEA
      • By Material
      • By Product Type
      • By End-use Industry
      • By Distribution Channel
    • Market Attractiveness Analysis
      • By Country
      • By Material
      • By Product Type
      • By End-use Industry
      • By Distribution Channel
    • Key Takeaways
  17. Key Countries Market Analysis
    • USA
      • Pricing Analysis
      • Market Share Analysis, 2024
        • By Material
        • By Product Type
        • By End-use Industry
        • By Distribution Channel
    • Canada
      • Pricing Analysis
      • Market Share Analysis, 2024
        • By Material
        • By Product Type
        • By End-use Industry
        • By Distribution Channel
    • Brazil
      • Pricing Analysis
      • Market Share Analysis, 2024
        • By Material
        • By Product Type
        • By End-use Industry
        • By Distribution Channel
    • Mexico
      • Pricing Analysis
      • Market Share Analysis, 2024
        • By Material
        • By Product Type
        • By End-use Industry
        • By Distribution Channel
    • Argentina
      • Pricing Analysis
      • Market Share Analysis, 2024
        • By Material
        • By Product Type
        • By End-use Industry
        • By Distribution Channel
  18. Market Structure Analysis
    • Competition Dashboard
    • Competition Benchmarking
    • Market Share Analysis of Top Players
      • By Regional
      • By Material
      • By Product Type
      • By End-use Industry
      • By Distribution Channel
  19. Competition Analysis
    • Competition Deep Dive
      • Tri-pack Packaging Systems Ltd
        • Overview
        • Product Portfolio
        • Profitability by Market Segments (Product/Age /Sales Channel/Region)
        • Sales Footprint
        • Strategy Overview
          • Marketing Strategy
          • Product Strategy
          • Channel Strategy
      • Brambles
        • Overview
        • Product Portfolio
        • Profitability by Market Segments (Product/Age /Sales Channel/Region)
        • Sales Footprint
        • Strategy Overview
          • Marketing Strategy
          • Product Strategy
          • Channel Strategy
      • DS Smith
        • Overview
        • Product Portfolio
        • Profitability by Market Segments (Product/Age /Sales Channel/Region)
        • Sales Footprint
        • Strategy Overview
          • Marketing Strategy
          • Product Strategy
          • Channel Strategy
      • IPL Plastics
        • Overview
        • Product Portfolio
        • Profitability by Market Segments (Product/Age /Sales Channel/Region)
        • Sales Footprint
        • Strategy Overview
          • Marketing Strategy
          • Product Strategy
          • Channel Strategy
      • Menasha Corporation
        • Overview
        • Product Portfolio
        • Profitability by Market Segments (Product/Age /Sales Channel/Region)
        • Sales Footprint
        • Strategy Overview
          • Marketing Strategy
          • Product Strategy
          • Channel Strategy
      • Myers Industries
        • Overview
        • Product Portfolio
        • Profitability by Market Segments (Product/Age /Sales Channel/Region)
        • Sales Footprint
        • Strategy Overview
          • Marketing Strategy
          • Product Strategy
          • Channel Strategy
      • Nefab Group
        • Overview
        • Product Portfolio
        • Profitability by Market Segments (Product/Age /Sales Channel/Region)
        • Sales Footprint
        • Strategy Overview
          • Marketing Strategy
          • Product Strategy
          • Channel Strategy
      • Rehrig Pacific Company
        • Overview
        • Product Portfolio
        • Profitability by Market Segments (Product/Age /Sales Channel/Region)
        • Sales Footprint
        • Strategy Overview
          • Marketing Strategy
          • Product Strategy
          • Channel Strategy
      • Schoeller Allibert
        • Overview
        • Product Portfolio
        • Profitability by Market Segments (Product/Age /Sales Channel/Region)
        • Sales Footprint
        • Strategy Overview
          • Marketing Strategy
          • Product Strategy
          • Channel Strategy
      • Schütz GmbH & Co. KGaA
        • Overview
        • Product Portfolio
        • Profitability by Market Segments (Product/Age /Sales Channel/Region)
        • Sales Footprint
        • Strategy Overview
          • Marketing Strategy
          • Product Strategy
          • Channel Strategy
  20. Assumptions & Acronyms Used
  21. Research Methodology

List of Tables

  • Table 1: Global Market Value (USD Million) Forecast by Region, 2020-2035
  • Table 2: Global Market Volume (Units) Forecast by Region, 2020-2035
  • Table 3: Global Market Value (USD Million) Forecast by Material, 2020-2035
  • Table 4: Global Market Volume (Units) Forecast by Material, 2020-2035
  • Table 5: Global Market Value (USD Million) Forecast by Product Type, 2020-2035
  • Table 6: Global Market Volume (Units) Forecast by Product Type, 2020-2035
  • Table 7: Global Market Value (USD Million) Forecast by End-use Industry, 2020-2035
  • Table 8: Global Market Volume (Units) Forecast by End-use Industry, 2020-2035
  • Table 9: Global Market Value (USD Million) Forecast by Distribution Channel, 2020-2035
  • Table 10: Global Market Volume (Units) Forecast by Distribution Channel, 2020-2035
  • Table 11: North America Market Value (USD Million) Forecast by Country, 2020-2035
  • Table 12: North America Market Volume (Units) Forecast by Country, 2020-2035
  • Table 13: North America Market Value (USD Million) Forecast by Material, 2020-2035
  • Table 14: North America Market Volume (Units) Forecast by Material, 2020-2035
  • Table 15: North America Market Value (USD Million) Forecast by Product Type, 2020-2035
  • Table 16: North America Market Volume (Units) Forecast by Product Type, 2020-2035
  • Table 17: North America Market Value (USD Million) Forecast by End-use Industry, 2020-2035
  • Table 18: North America Market Volume (Units) Forecast by End-use Industry, 2020-2035
  • Table 19: North America Market Value (USD Million) Forecast by Distribution Channel, 2020-2035
  • Table 20: North America Market Volume (Units) Forecast by Distribution Channel, 2020-2035
  • Table 21: Latin America Market Value (USD Million) Forecast by Country, 2020-2035
  • Table 22: Latin America Market Volume (Units) Forecast by Country, 2020-2035
  • Table 23: Latin America Market Value (USD Million) Forecast by Material, 2020-2035
  • Table 24: Latin America Market Volume (Units) Forecast by Material, 2020-2035
  • Table 25: Latin America Market Value (USD Million) Forecast by Product Type, 2020-2035
  • Table 26: Latin America Market Volume (Units) Forecast by Product Type, 2020-2035
  • Table 27: Latin America Market Value (USD Million) Forecast by End-use Industry, 2020-2035
  • Table 28: Latin America Market Volume (Units) Forecast by End-use Industry, 2020-2035
  • Table 29: Latin America Market Value (USD Million) Forecast by Distribution Channel, 2020-2035
  • Table 30: Latin America Market Volume (Units) Forecast by Distribution Channel, 2020-2035
  • Table 31: Europe Market Value (USD Million) Forecast by Country, 2020-2035
  • Table 32: Europe Market Volume (Units) Forecast by Country, 2020-2035
  • Table 33: Europe Market Value (USD Million) Forecast by Material, 2020-2035
  • Table 34: Europe Market Volume (Units) Forecast by Material, 2020-2035
  • Table 35: Europe Market Value (USD Million) Forecast by Product Type, 2020-2035
  • Table 36: Europe Market Volume (Units) Forecast by Product Type, 2020-2035
  • Table 37: Europe Market Value (USD Million) Forecast by End-use Industry, 2020-2035
  • Table 38: Europe Market Volume (Units) Forecast by End-use Industry, 2020-2035
  • Table 39: Europe Market Value (USD Million) Forecast by Distribution Channel, 2020-2035
  • Table 40: Europe Market Volume (Units) Forecast by Distribution Channel, 2020-2035
  • Table 41: East Asia Market Value (USD Million) Forecast by Country, 2020-2035
  • Table 42: East Asia Market Volume (Units) Forecast by Country, 2020-2035
  • Table 43: East Asia Market Value (USD Million) Forecast by Material, 2020-2035
  • Table 44: East Asia Market Volume (Units) Forecast by Material, 2020-2035
  • Table 45: East Asia Market Value (USD Million) Forecast by Product Type, 2020-2035
  • Table 46: East Asia Market Volume (Units) Forecast by Product Type, 2020-2035
  • Table 47: East Asia Market Value (USD Million) Forecast by End-use Industry, 2020-2035
  • Table 48: East Asia Market Volume (Units) Forecast by End-use Industry, 2020-2035
  • Table 49: East Asia Market Value (USD Million) Forecast by Distribution Channel, 2020-2035
  • Table 50: East Asia Market Volume (Units) Forecast by Distribution Channel, 2020-2035
  • Table 51: South Asia Market Value (USD Million) Forecast by Country, 2020-2035
  • Table 52: South Asia Market Volume (Units) Forecast by Country, 2020-2035
  • Table 53: South Asia Market Value (USD Million) Forecast by Material, 2020-2035
  • Table 54: South Asia Market Volume (Units) Forecast by Material, 2020-2035
  • Table 55: South Asia Market Value (USD Million) Forecast by Product Type, 2020-2035
  • Table 56: South Asia Market Volume (Units) Forecast by Product Type, 2020-2035
  • Table 57: South Asia Market Value (USD Million) Forecast by End-use Industry, 2020-2035
  • Table 58: South Asia Market Volume (Units) Forecast by End-use Industry, 2020-2035
  • Table 59: South Asia Market Value (USD Million) Forecast by Distribution Channel, 2020-2035
  • Table 60: South Asia Market Volume (Units) Forecast by Distribution Channel, 2020-2035
  • Table 61: Oceania Market Value (USD Million) Forecast by Country, 2020-2035
  • Table 62: Oceania Market Volume (Units) Forecast by Country, 2020-2035
  • Table 63: Oceania Market Value (USD Million) Forecast by Material, 2020-2035
  • Table 64: Oceania Market Volume (Units) Forecast by Material, 2020-2035
  • Table 65: Oceania Market Value (USD Million) Forecast by Product Type, 2020-2035
  • Table 66: Oceania Market Volume (Units) Forecast by Product Type, 2020-2035
  • Table 67: Oceania Market Value (USD Million) Forecast by End-use Industry, 2020-2035
  • Table 68: Oceania Market Volume (Units) Forecast by End-use Industry, 2020-2035
  • Table 69: Oceania Market Value (USD Million) Forecast by Distribution Channel, 2020-2035
  • Table 70: Oceania Market Volume (Units) Forecast by Distribution Channel, 2020-2035
  • Table 71: MEA Market Value (USD Million) Forecast by Country, 2020-2035
  • Table 72: MEA Market Volume (Units) Forecast by Country, 2020-2035
  • Table 73: MEA Market Value (USD Million) Forecast by Material, 2020-2035
  • Table 74: MEA Market Volume (Units) Forecast by Material, 2020-2035
  • Table 75: MEA Market Value (USD Million) Forecast by Product Type, 2020-2035
  • Table 76: MEA Market Volume (Units) Forecast by Product Type, 2020-2035
  • Table 77: MEA Market Value (USD Million) Forecast by End-use Industry, 2020-2035
  • Table 78: MEA Market Volume (Units) Forecast by End-use Industry, 2020-2035
  • Table 79: MEA Market Value (USD Million) Forecast by Distribution Channel, 2020-2035
  • Table 80: MEA Market Volume (Units) Forecast by Distribution Channel, 2020-2035

List of Figures

  • Figure 1: Global Market Value (USD Million) by Material, 2025-2035
  • Figure 2: Global Market Value (USD Million) by Product Type, 2025-2035
  • Figure 3: Global Market Value (USD Million) by End-use Industry, 2025-2035
  • Figure 4: Global Market Value (USD Million) by Distribution Channel, 2025-2035
  • Figure 5: Global Market Value (USD Million) by Region, 2025-2035
  • Figure 6: Global Market Value (USD Million) Analysis by Region, 2020-2035
  • Figure 7: Global Market Volume (Units) Analysis by Region, 2020-2035
  • Figure 8: Global Market Value Share (%) and BPS Analysis by Region, 2025-2035
  • Figure 9: Global Market Y-o-Y Growth (%) Projections by Region, 2025-2035
  • Figure 10: Global Market Value (USD Million) Analysis by Material, 2020-2035
  • Figure 11: Global Market Volume (Units) Analysis by Material, 2020-2035
  • Figure 12: Global Market Value Share (%) and BPS Analysis by Material, 2025-2035
  • Figure 13: Global Market Y-o-Y Growth (%) Projections by Material, 2025-2035
  • Figure 14: Global Market Value (USD Million) Analysis by Product Type, 2020-2035
  • Figure 15: Global Market Volume (Units) Analysis by Product Type, 2020-2035
  • Figure 16: Global Market Value Share (%) and BPS Analysis by Product Type, 2025-2035
  • Figure 17: Global Market Y-o-Y Growth (%) Projections by Product Type, 2025-2035
  • Figure 18: Global Market Value (USD Million) Analysis by End-use Industry, 2020-2035
  • Figure 19: Global Market Volume (Units) Analysis by End-use Industry, 2020-2035
  • Figure 20: Global Market Value Share (%) and BPS Analysis by End-use Industry, 2025-2035
  • Figure 21: Global Market Y-o-Y Growth (%) Projections by End-use Industry, 2025-2035
  • Figure 22: Global Market Value (USD Million) Analysis by Distribution Channel, 2020-2035
  • Figure 23: Global Market Volume (Units) Analysis by Distribution Channel, 2020-2035
  • Figure 24: Global Market Value Share (%) and BPS Analysis by Distribution Channel, 2025-2035
  • Figure 25: Global Market Y-o-Y Growth (%) Projections by Distribution Channel, 2025-2035
  • Figure 26: Global Market Attractiveness by Material, 2025-2035
  • Figure 27: Global Market Attractiveness by Product Type, 2025-2035
  • Figure 28: Global Market Attractiveness by End-use Industry, 2025-2035
  • Figure 29: Global Market Attractiveness by Distribution Channel, 2025-2035
  • Figure 30: Global Market Attractiveness by Region, 2025-2035
  • Figure 31: North America Market Value (USD Million) by Material, 2025-2035
  • Figure 32: North America Market Value (USD Million) by Product Type, 2025-2035
  • Figure 33: North America Market Value (USD Million) by End-use Industry, 2025-2035
  • Figure 34: North America Market Value (USD Million) by Distribution Channel, 2025-2035
  • Figure 35: North America Market Value (USD Million) by Country, 2025-2035
  • Figure 36: North America Market Value (USD Million) Analysis by Country, 2020-2035
  • Figure 37: North America Market Volume (Units) Analysis by Country, 2020-2035
  • Figure 38: North America Market Value Share (%) and BPS Analysis by Country, 2025-2035
  • Figure 39: North America Market Y-o-Y Growth (%) Projections by Country, 2025-2035
  • Figure 40: North America Market Value (USD Million) Analysis by Material, 2020-2035
  • Figure 41: North America Market Volume (Units) Analysis by Material, 2020-2035
  • Figure 42: North America Market Value Share (%) and BPS Analysis by Material, 2025-2035
  • Figure 43: North America Market Y-o-Y Growth (%) Projections by Material, 2025-2035
  • Figure 44: North America Market Value (USD Million) Analysis by Product Type, 2020-2035
  • Figure 45: North America Market Volume (Units) Analysis by Product Type, 2020-2035
  • Figure 46: North America Market Value Share (%) and BPS Analysis by Product Type, 2025-2035
  • Figure 47: North America Market Y-o-Y Growth (%) Projections by Product Type, 2025-2035
  • Figure 48: North America Market Value (USD Million) Analysis by End-use Industry, 2020-2035
  • Figure 49: North America Market Volume (Units) Analysis by End-use Industry, 2020-2035
  • Figure 50: North America Market Value Share (%) and BPS Analysis by End-use Industry, 2025-2035
  • Figure 51: North America Market Y-o-Y Growth (%) Projections by End-use Industry, 2025-2035
  • Figure 52: North America Market Value (USD Million) Analysis by Distribution Channel, 2020-2035
  • Figure 53: North America Market Volume (Units) Analysis by Distribution Channel, 2020-2035
  • Figure 54: North America Market Value Share (%) and BPS Analysis by Distribution Channel, 2025-2035
  • Figure 55: North America Market Y-o-Y Growth (%) Projections by Distribution Channel, 2025-2035
  • Figure 56: North America Market Attractiveness by Material, 2025-2035
  • Figure 57: North America Market Attractiveness by Product Type, 2025-2035
  • Figure 58: North America Market Attractiveness by End-use Industry, 2025-2035
  • Figure 59: North America Market Attractiveness by Distribution Channel, 2025-2035
  • Figure 60: North America Market Attractiveness by Country, 2025-2035
  • Figure 61: Latin America Market Value (USD Million) by Material, 2025-2035
  • Figure 62: Latin America Market Value (USD Million) by Product Type, 2025-2035
  • Figure 63: Latin America Market Value (USD Million) by End-use Industry, 2025-2035
  • Figure 64: Latin America Market Value (USD Million) by Distribution Channel, 2025-2035
  • Figure 65: Latin America Market Value (USD Million) by Country, 2025-2035
  • Figure 66: Latin America Market Value (USD Million) Analysis by Country, 2020-2035
  • Figure 67: Latin America Market Volume (Units) Analysis by Country, 2020-2035
  • Figure 68: Latin America Market Value Share (%) and BPS Analysis by Country, 2025-2035
  • Figure 69: Latin America Market Y-o-Y Growth (%) Projections by Country, 2025-2035
  • Figure 70: Latin America Market Value (USD Million) Analysis by Material, 2020-2035
  • Figure 71: Latin America Market Volume (Units) Analysis by Material, 2020-2035
  • Figure 72: Latin America Market Value Share (%) and BPS Analysis by Material, 2025-2035
  • Figure 73: Latin America Market Y-o-Y Growth (%) Projections by Material, 2025-2035
  • Figure 74: Latin America Market Value (USD Million) Analysis by Product Type, 2020-2035
  • Figure 75: Latin America Market Volume (Units) Analysis by Product Type, 2020-2035
  • Figure 76: Latin America Market Value Share (%) and BPS Analysis by Product Type, 2025-2035
  • Figure 77: Latin America Market Y-o-Y Growth (%) Projections by Product Type, 2025-2035
  • Figure 78: Latin America Market Value (USD Million) Analysis by End-use Industry, 2020-2035
  • Figure 79: Latin America Market Volume (Units) Analysis by End-use Industry, 2020-2035
  • Figure 80: Latin America Market Value Share (%) and BPS Analysis by End-use Industry, 2025-2035
  • Figure 81: Latin America Market Y-o-Y Growth (%) Projections by End-use Industry, 2025-2035
  • Figure 82: Latin America Market Value (USD Million) Analysis by Distribution Channel, 2020-2035
  • Figure 83: Latin America Market Volume (Units) Analysis by Distribution Channel, 2020-2035
  • Figure 84: Latin America Market Value Share (%) and BPS Analysis by Distribution Channel, 2025-2035
  • Figure 85: Latin America Market Y-o-Y Growth (%) Projections by Distribution Channel, 2025-2035
  • Figure 86: Latin America Market Attractiveness by Material, 2025-2035
  • Figure 87: Latin America Market Attractiveness by Product Type, 2025-2035
  • Figure 88: Latin America Market Attractiveness by End-use Industry, 2025-2035
  • Figure 89: Latin America Market Attractiveness by Distribution Channel, 2025-2035
  • Figure 90: Latin America Market Attractiveness by Country, 2025-2035
  • Figure 91: Europe Market Value (USD Million) by Material, 2025-2035
  • Figure 92: Europe Market Value (USD Million) by Product Type, 2025-2035
  • Figure 93: Europe Market Value (USD Million) by End-use Industry, 2025-2035
  • Figure 94: Europe Market Value (USD Million) by Distribution Channel, 2025-2035
  • Figure 95: Europe Market Value (USD Million) by Country, 2025-2035
  • Figure 96: Europe Market Value (USD Million) Analysis by Country, 2020-2035
  • Figure 97: Europe Market Volume (Units) Analysis by Country, 2020-2035
  • Figure 98: Europe Market Value Share (%) and BPS Analysis by Country, 2025-2035
  • Figure 99: Europe Market Y-o-Y Growth (%) Projections by Country, 2025-2035
  • Figure 100: Europe Market Value (USD Million) Analysis by Material, 2020-2035
  • Figure 101: Europe Market Volume (Units) Analysis by Material, 2020-2035
  • Figure 102: Europe Market Value Share (%) and BPS Analysis by Material, 2025-2035
  • Figure 103: Europe Market Y-o-Y Growth (%) Projections by Material, 2025-2035
  • Figure 104: Europe Market Value (USD Million) Analysis by Product Type, 2020-2035
  • Figure 105: Europe Market Volume (Units) Analysis by Product Type, 2020-2035
  • Figure 106: Europe Market Value Share (%) and BPS Analysis by Product Type, 2025-2035
  • Figure 107: Europe Market Y-o-Y Growth (%) Projections by Product Type, 2025-2035
  • Figure 108: Europe Market Value (USD Million) Analysis by End-use Industry, 2020-2035
  • Figure 109: Europe Market Volume (Units) Analysis by End-use Industry, 2020-2035
  • Figure 110: Europe Market Value Share (%) and BPS Analysis by End-use Industry, 2025-2035
  • Figure 111: Europe Market Y-o-Y Growth (%) Projections by End-use Industry, 2025-2035
  • Figure 112: Europe Market Value (USD Million) Analysis by Distribution Channel, 2020-2035
  • Figure 113: Europe Market Volume (Units) Analysis by Distribution Channel, 2020-2035
  • Figure 114: Europe Market Value Share (%) and BPS Analysis by Distribution Channel, 2025-2035
  • Figure 115: Europe Market Y-o-Y Growth (%) Projections by Distribution Channel, 2025-2035
  • Figure 116: Europe Market Attractiveness by Material, 2025-2035
  • Figure 117: Europe Market Attractiveness by Product Type, 2025-2035
  • Figure 118: Europe Market Attractiveness by End-use Industry, 2025-2035
  • Figure 119: Europe Market Attractiveness by Distribution Channel, 2025-2035
  • Figure 120: Europe Market Attractiveness by Country, 2025-2035
  • Figure 121: East Asia Market Value (USD Million) by Material, 2025-2035
  • Figure 122: East Asia Market Value (USD Million) by Product Type, 2025-2035
  • Figure 123: East Asia Market Value (USD Million) by End-use Industry, 2025-2035
  • Figure 124: East Asia Market Value (USD Million) by Distribution Channel, 2025-2035
  • Figure 125: East Asia Market Value (USD Million) by Country, 2025-2035
  • Figure 126: East Asia Market Value (USD Million) Analysis by Country, 2020-2035
  • Figure 127: East Asia Market Volume (Units) Analysis by Country, 2020-2035
  • Figure 128: East Asia Market Value Share (%) and BPS Analysis by Country, 2025-2035
  • Figure 129: East Asia Market Y-o-Y Growth (%) Projections by Country, 2025-2035
  • Figure 130: East Asia Market Value (USD Million) Analysis by Material, 2020-2035
  • Figure 131: East Asia Market Volume (Units) Analysis by Material, 2020-2035
  • Figure 132: East Asia Market Value Share (%) and BPS Analysis by Material, 2025-2035
  • Figure 133: East Asia Market Y-o-Y Growth (%) Projections by Material, 2025-2035
  • Figure 134: East Asia Market Value (USD Million) Analysis by Product Type, 2020-2035
  • Figure 135: East Asia Market Volume (Units) Analysis by Product Type, 2020-2035
  • Figure 136: East Asia Market Value Share (%) and BPS Analysis by Product Type, 2025-2035
  • Figure 137: East Asia Market Y-o-Y Growth (%) Projections by Product Type, 2025-2035
  • Figure 138: East Asia Market Value (USD Million) Analysis by End-use Industry, 2020-2035
  • Figure 139: East Asia Market Volume (Units) Analysis by End-use Industry, 2020-2035
  • Figure 140: East Asia Market Value Share (%) and BPS Analysis by End-use Industry, 2025-2035
  • Figure 141: East Asia Market Y-o-Y Growth (%) Projections by End-use Industry, 2025-2035
  • Figure 142: East Asia Market Value (USD Million) Analysis by Distribution Channel, 2020-2035
  • Figure 143: East Asia Market Volume (Units) Analysis by Distribution Channel, 2020-2035
  • Figure 144: East Asia Market Value Share (%) and BPS Analysis by Distribution Channel, 2025-2035
  • Figure 145: East Asia Market Y-o-Y Growth (%) Projections by Distribution Channel, 2025-2035
  • Figure 146: East Asia Market Attractiveness by Material, 2025-2035
  • Figure 147: East Asia Market Attractiveness by Product Type, 2025-2035
  • Figure 148: East Asia Market Attractiveness by End-use Industry, 2025-2035
  • Figure 149: East Asia Market Attractiveness by Distribution Channel, 2025-2035
  • Figure 150: East Asia Market Attractiveness by Country, 2025-2035
  • Figure 151: South Asia Market Value (USD Million) by Material, 2025-2035
  • Figure 152: South Asia Market Value (USD Million) by Product Type, 2025-2035
  • Figure 153: South Asia Market Value (USD Million) by End-use Industry, 2025-2035
  • Figure 154: South Asia Market Value (USD Million) by Distribution Channel, 2025-2035
  • Figure 155: South Asia Market Value (USD Million) by Country, 2025-2035
  • Figure 156: South Asia Market Value (USD Million) Analysis by Country, 2020-2035
  • Figure 157: South Asia Market Volume (Units) Analysis by Country, 2020-2035
  • Figure 158: South Asia Market Value Share (%) and BPS Analysis by Country, 2025-2035
  • Figure 159: South Asia Market Y-o-Y Growth (%) Projections by Country, 2025-2035
  • Figure 160: South Asia Market Value (USD Million) Analysis by Material, 2020-2035
  • Figure 161: South Asia Market Volume (Units) Analysis by Material, 2020-2035
  • Figure 162: South Asia Market Value Share (%) and BPS Analysis by Material, 2025-2035
  • Figure 163: South Asia Market Y-o-Y Growth (%) Projections by Material, 2025-2035
  • Figure 164: South Asia Market Value (USD Million) Analysis by Product Type, 2020-2035
  • Figure 165: South Asia Market Volume (Units) Analysis by Product Type, 2020-2035
  • Figure 166: South Asia Market Value Share (%) and BPS Analysis by Product Type, 2025-2035
  • Figure 167: South Asia Market Y-o-Y Growth (%) Projections by Product Type, 2025-2035
  • Figure 168: South Asia Market Value (USD Million) Analysis by End-use Industry, 2020-2035
  • Figure 169: South Asia Market Volume (Units) Analysis by End-use Industry, 2020-2035
  • Figure 170: South Asia Market Value Share (%) and BPS Analysis by End-use Industry, 2025-2035
  • Figure 171: South Asia Market Y-o-Y Growth (%) Projections by End-use Industry, 2025-2035
  • Figure 172: South Asia Market Value (USD Million) Analysis by Distribution Channel, 2020-2035
  • Figure 173: South Asia Market Volume (Units) Analysis by Distribution Channel, 2020-2035
  • Figure 174: South Asia Market Value Share (%) and BPS Analysis by Distribution Channel, 2025-2035
  • Figure 175: South Asia Market Y-o-Y Growth (%) Projections by Distribution Channel, 2025-2035
  • Figure 176: South Asia Market Attractiveness by Material, 2025-2035
  • Figure 177: South Asia Market Attractiveness by Product Type, 2025-2035
  • Figure 178: South Asia Market Attractiveness by End-use Industry, 2025-2035
  • Figure 179: South Asia Market Attractiveness by Distribution Channel, 2025-2035
  • Figure 180: South Asia Market Attractiveness by Country, 2025-2035
  • Figure 181: Oceania Market Value (USD Million) by Material, 2025-2035
  • Figure 182: Oceania Market Value (USD Million) by Product Type, 2025-2035
  • Figure 183: Oceania Market Value (USD Million) by End-use Industry, 2025-2035
  • Figure 184: Oceania Market Value (USD Million) by Distribution Channel, 2025-2035
  • Figure 185: Oceania Market Value (USD Million) by Country, 2025-2035
  • Figure 186: Oceania Market Value (USD Million) Analysis by Country, 2020-2035
  • Figure 187: Oceania Market Volume (Units) Analysis by Country, 2020-2035
  • Figure 188: Oceania Market Value Share (%) and BPS Analysis by Country, 2025-2035
  • Figure 189: Oceania Market Y-o-Y Growth (%) Projections by Country, 2025-2035
  • Figure 190: Oceania Market Value (USD Million) Analysis by Material, 2020-2035
  • Figure 191: Oceania Market Volume (Units) Analysis by Material, 2020-2035
  • Figure 192: Oceania Market Value Share (%) and BPS Analysis by Material, 2025-2035
  • Figure 193: Oceania Market Y-o-Y Growth (%) Projections by Material, 2025-2035
  • Figure 194: Oceania Market Value (USD Million) Analysis by Product Type, 2020-2035
  • Figure 195: Oceania Market Volume (Units) Analysis by Product Type, 2020-2035
  • Figure 196: Oceania Market Value Share (%) and BPS Analysis by Product Type, 2025-2035
  • Figure 197: Oceania Market Y-o-Y Growth (%) Projections by Product Type, 2025-2035
  • Figure 198: Oceania Market Value (USD Million) Analysis by End-use Industry, 2020-2035
  • Figure 199: Oceania Market Volume (Units) Analysis by End-use Industry, 2020-2035
  • Figure 200: Oceania Market Value Share (%) and BPS Analysis by End-use Industry, 2025-2035
  • Figure 201: Oceania Market Y-o-Y Growth (%) Projections by End-use Industry, 2025-2035
  • Figure 202: Oceania Market Value (USD Million) Analysis by Distribution Channel, 2020-2035
  • Figure 203: Oceania Market Volume (Units) Analysis by Distribution Channel, 2020-2035
  • Figure 204: Oceania Market Value Share (%) and BPS Analysis by Distribution Channel, 2025-2035
  • Figure 205: Oceania Market Y-o-Y Growth (%) Projections by Distribution Channel, 2025-2035
  • Figure 206: Oceania Market Attractiveness by Material, 2025-2035
  • Figure 207: Oceania Market Attractiveness by Product Type, 2025-2035
  • Figure 208: Oceania Market Attractiveness by End-use Industry, 2025-2035
  • Figure 209: Oceania Market Attractiveness by Distribution Channel, 2025-2035
  • Figure 210: Oceania Market Attractiveness by Country, 2025-2035
  • Figure 211: MEA Market Value (USD Million) by Material, 2025-2035
  • Figure 212: MEA Market Value (USD Million) by Product Type, 2025-2035
  • Figure 213: MEA Market Value (USD Million) by End-use Industry, 2025-2035
  • Figure 214: MEA Market Value (USD Million) by Distribution Channel, 2025-2035
  • Figure 215: MEA Market Value (USD Million) by Country, 2025-2035
  • Figure 216: MEA Market Value (USD Million) Analysis by Country, 2020-2035
  • Figure 217: MEA Market Volume (Units) Analysis by Country, 2020-2035
  • Figure 218: MEA Market Value Share (%) and BPS Analysis by Country, 2025-2035
  • Figure 219: MEA Market Y-o-Y Growth (%) Projections by Country, 2025-2035
  • Figure 220: MEA Market Value (USD Million) Analysis by Material, 2020-2035
  • Figure 221: MEA Market Volume (Units) Analysis by Material, 2020-2035
  • Figure 222: MEA Market Value Share (%) and BPS Analysis by Material, 2025-2035
  • Figure 223: MEA Market Y-o-Y Growth (%) Projections by Material, 2025-2035
  • Figure 224: MEA Market Value (USD Million) Analysis by Product Type, 2020-2035
  • Figure 225: MEA Market Volume (Units) Analysis by Product Type, 2020-2035
  • Figure 226: MEA Market Value Share (%) and BPS Analysis by Product Type, 2025-2035
  • Figure 227: MEA Market Y-o-Y Growth (%) Projections by Product Type, 2025-2035
  • Figure 228: MEA Market Value (USD Million) Analysis by End-use Industry, 2020-2035
  • Figure 229: MEA Market Volume (Units) Analysis by End-use Industry, 2020-2035
  • Figure 230: MEA Market Value Share (%) and BPS Analysis by End-use Industry, 2025-2035
  • Figure 231: MEA Market Y-o-Y Growth (%) Projections by End-use Industry, 2025-2035
  • Figure 232: MEA Market Value (USD Million) Analysis by Distribution Channel, 2020-2035
  • Figure 233: MEA Market Volume (Units) Analysis by Distribution Channel, 2020-2035
  • Figure 234: MEA Market Value Share (%) and BPS Analysis by Distribution Channel, 2025-2035
  • Figure 235: MEA Market Y-o-Y Growth (%) Projections by Distribution Channel, 2025-2035
  • Figure 236: MEA Market Attractiveness by Material, 2025-2035
  • Figure 237: MEA Market Attractiveness by Product Type, 2025-2035
  • Figure 238: MEA Market Attractiveness by End-use Industry, 2025-2035
  • Figure 239: MEA Market Attractiveness by Distribution Channel, 2025-2035
  • Figure 240: MEA Market Attractiveness by Country, 2025-2035

Frequently Asked Questions

What was the overall size of the reusable packing market in 2025?

The overall market size for reusable packing market was USD 121.4 billion in 2025.

How big the reusable packing market is expected in 2035?

The reusable packing market is expected to reach USD 199.6 billion in 2035.

What will drive the demand for reusable packing market during the forecast period?

Growing emphasis on environmental sustainability, increasing regulations on single-use plastics, and rising demand from logistics and retail sectors for cost-effective, durable packaging will drive market growth.

List the top 5 countries contributing in reusable packing market?

The top 5 countries which drives the development of reusable packing market are USA, European Union, Japan, South Korea and UK.

Explore Similar Insights

Future Market Insights

Reusable Packing Market