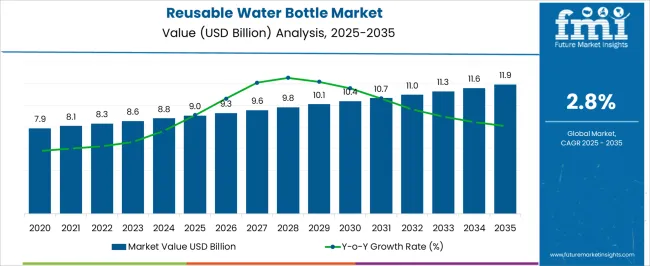
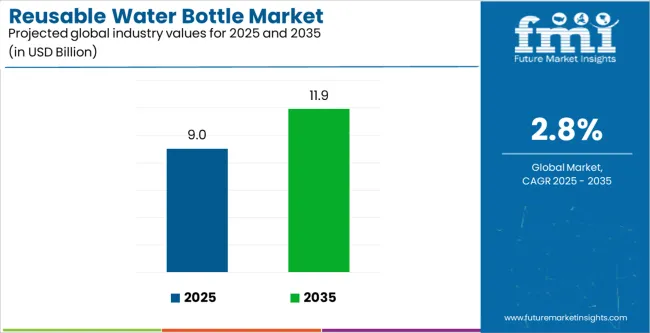
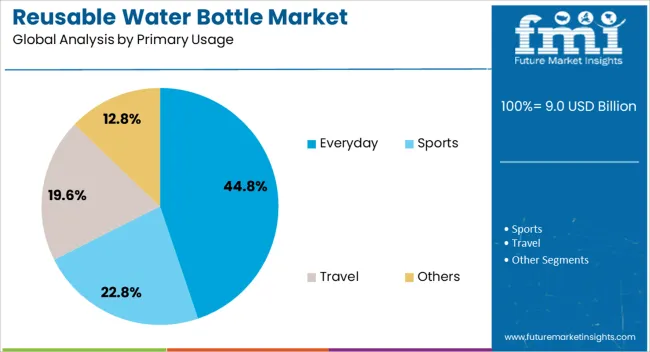
The reusable water bottle market size is estimated to be valued at USD 8.8 billion in 2024. Growing awareness about the detrimental impact of single-use plastics on the environment has led consumers to seek eco-friendly alternatives like reusable water bottles.
Concerns about plastic waste in oceans and landfills have prompted individuals to opt for sustainable alternatives to reduce their carbon footprint.
Attributes | Details |
---|---|
Reusable Water Bottle Market Value for 2024 | USD 8.8 billion |
Reusable Water Bottle Market Value for 2034 | USD 11.5 billion |
Reusable Water Bottle Market Forecast CAGR for 2024 to 2034 | 2.8% |
The sales of reusable water bottle are predicted to witness expansion at a CAGR of 2.8% through 2034. The industry is anticipated to surpass USD 11.5 billion by 2034.
With a greater focus on health and wellness, consumers are increasingly mindful of the potential health risks associated with single-use plastic bottles. Reusable water bottles offer a safer and more hygienic option for carrying water, free from harmful chemicals such as BPA (bisphenol A) found in some plastic bottles.
Historical CAGR | 2.2% |
---|---|
Forecast CAGR | 2.8% |
The historical performance of the reusable water bottle market reflects a notable CAGR of 2.2%, indicating moderate growth over the specified period. However, the forecasted CAGR of 2.8% suggests a slight increase in growth rates in the coming years. Several factors contribute to this shift in growth trajectory.
One factor influencing the historical CAGR of 2.2% could be the growing awareness of environmental sustainability and the associated increase in demand for eco-friendly alternatives to single-use plastics.
Consumers are becoming more conscious of the environmental impact of their choices, leading to the gradual adoption of reusable water bottles. Additionally, government initiatives promoting sustainability and reducing plastic waste may have played a role in driving market growth.
The forecasted increase in CAGR to 2.8% could be attributed to several factors. As environmental concerns continue to escalate, there is a heightened emphasis on reducing plastic waste and embracing reusable alternatives.
This growing awareness is expected to drive higher demand for reusable water bottles in the future. Furthermore, advancements in bottle design and material technology, such as lightweight and durable materials, may enhance the appeal of reusable bottles, attracting more consumers to make the switch.
Corporate Sustainability Initiatives
Many companies are implementing corporate social responsibility programs focused on reducing single-use plastics, which include providing employees with reusable water bottles. This corporate shift towards sustainability is boosting the adoption of reusable bottles in workplaces.
Fashion and Personalization
The trend towards personalized and stylish reusable water bottles, featuring unique designs, customizable options, and trendy materials, is attracting consumers looking for functional yet fashionable hydration accessories.
Rise of Specialty Markets
Emerging markets for specialized reusable water bottles, such as bottles designed for outdoor activities like hiking and camping, sports-specific bottles for athletes, and kid-friendly bottles with spill-proof features, are diversifying product offerings and meeting niche consumer needs.
Corporate Sustainability Programs
Corporations and organizations are implementing corporate sustainability programs that promote the use of reusable water bottles among employees and customers, contributing to the overall growth of the market.
This section provides detailed insights into specific segments in the reusable water bottle industry.
Top Material | Metal |
---|---|
Market Share in 2024 | 33.1% |
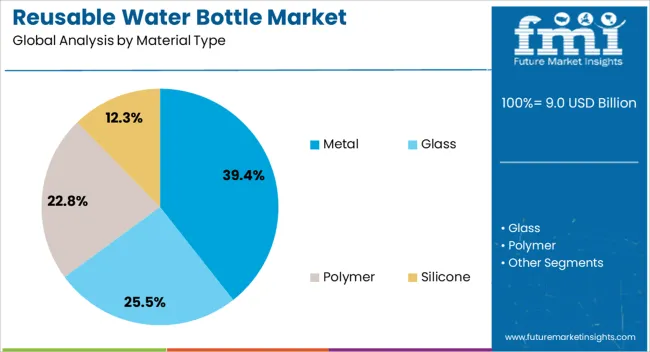
Metal bottles are projected to maintain their dominance with a significant market share of 33.1% in 2024. Their continued popularity can be attributed to several factors:
Dominating End Use | Institutional Use |
---|---|
Market Share in 2024 | 43.2% |
The institutional use segment is predicted to be the industry leader in 2024, holding an estimated market share of 43.2%. This significant share can be explained by:
The section analyzes the reusable water bottle market across key countries, including the United States, United Kingdom, China, India, and Japan. The analysis delves into the specific factors driving the demand for reusable water bottles in these countries.
Countries | CAGR |
---|---|
United States | 1.7% |
United Kingdom | 1.5% |
China | 4.7% |
India | 6.5% |
Japan | 2.6% |
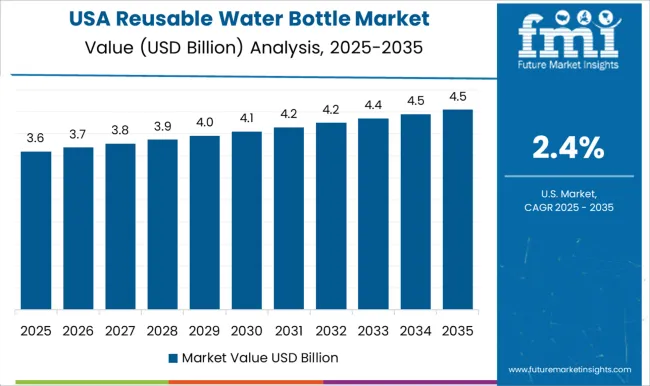
The reusable water bottle industry in the United States is anticipated to rise at a CAGR of 1.7% through 2034.
The reusable water bottle industry in the United Kingdom is projected to rise at a CAGR of 1.5% through 2034.
China’s reusable water bottle industry is likely to witness expansion at a CAGR of 4.7% through 2034.
India's reusable water bottle industry is projected to rise at a CAGR of 6.5% through 2034.
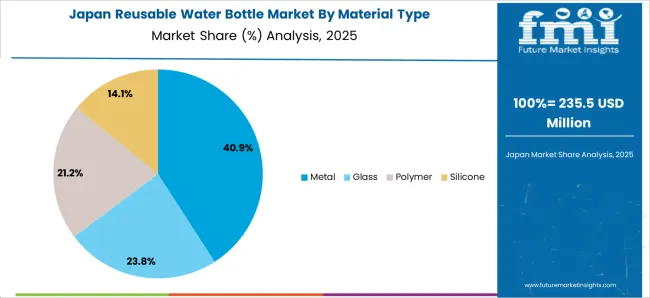
Japan's reusable water bottle market is expected to rise at a 2.6% CAGR through 2034.
Established brands with strong brand recognition and distribution networks hold a significant market share. However, new entrants are emerging, offering innovative designs, sustainable materials, and niche functionalities. This compels established brands to adapt and innovate to retain their market position.
Consumers are increasingly prioritizing eco-friendly products. Manufacturers are responding by using recycled materials, offering end-of-life recycling programs, and adopting sustainable production practices. This focus on sustainability is becoming a key differentiator in the competitive industry.
Catering to specific needs and preferences through targeted marketing and product development is crucial. This could involve offering water bottles designed for athletes, professionals, or children or providing customization options like personalized engravings or unique designs.
Recent Developments in the Reusable Water Bottle Industry
Table 1: Global Market Value (US$ Million) Forecast by Region, 2019 to 2034
Table 2: Global Market Volume (Units) Forecast by Region, 2019 to 2034
Table 3: Global Market Value (US$ Million) Forecast by Material Type, 2019 to 2034
Table 4: Global Market Volume (Units) Forecast by Material Type, 2019 to 2034
Table 5: Global Market Value (US$ Million) Forecast by Distribution Channel, 2019 to 2034
Table 6: Global Market Volume (Units) Forecast by Distribution Channel, 2019 to 2034
Table 7: Global Market Value (US$ Million) Forecast by Primary Usage, 2019 to 2034
Table 8: Global Market Volume (Units) Forecast by Primary Usage, 2019 to 2034
Table 9: North America Market Value (US$ Million) Forecast by Country, 2019 to 2034
Table 10: North America Market Volume (Units) Forecast by Country, 2019 to 2034
Table 11: North America Market Value (US$ Million) Forecast by Material Type, 2019 to 2034
Table 12: North America Market Volume (Units) Forecast by Material Type, 2019 to 2034
Table 13: North America Market Value (US$ Million) Forecast by Distribution Channel, 2019 to 2034
Table 14: North America Market Volume (Units) Forecast by Distribution Channel, 2019 to 2034
Table 15: North America Market Value (US$ Million) Forecast by Primary Usage, 2019 to 2034
Table 16: North America Market Volume (Units) Forecast by Primary Usage, 2019 to 2034
Table 17: Latin America Market Value (US$ Million) Forecast by Country, 2019 to 2034
Table 18: Latin America Market Volume (Units) Forecast by Country, 2019 to 2034
Table 19: Latin America Market Value (US$ Million) Forecast by Material Type, 2019 to 2034
Table 20: Latin America Market Volume (Units) Forecast by Material Type, 2019 to 2034
Table 21: Latin America Market Value (US$ Million) Forecast by Distribution Channel, 2019 to 2034
Table 22: Latin America Market Volume (Units) Forecast by Distribution Channel, 2019 to 2034
Table 23: Latin America Market Value (US$ Million) Forecast by Primary Usage, 2019 to 2034
Table 24: Latin America Market Volume (Units) Forecast by Primary Usage, 2019 to 2034
Table 25: Western Europe Market Value (US$ Million) Forecast by Country, 2019 to 2034
Table 26: Western Europe Market Volume (Units) Forecast by Country, 2019 to 2034
Table 27: Western Europe Market Value (US$ Million) Forecast by Material Type, 2019 to 2034
Table 28: Western Europe Market Volume (Units) Forecast by Material Type, 2019 to 2034
Table 29: Western Europe Market Value (US$ Million) Forecast by Distribution Channel, 2019 to 2034
Table 30: Western Europe Market Volume (Units) Forecast by Distribution Channel, 2019 to 2034
Table 31: Western Europe Market Value (US$ Million) Forecast by Primary Usage, 2019 to 2034
Table 32: Western Europe Market Volume (Units) Forecast by Primary Usage, 2019 to 2034
Table 33: Eastern Europe Market Value (US$ Million) Forecast by Country, 2019 to 2034
Table 34: Eastern Europe Market Volume (Units) Forecast by Country, 2019 to 2034
Table 35: Eastern Europe Market Value (US$ Million) Forecast by Material Type, 2019 to 2034
Table 36: Eastern Europe Market Volume (Units) Forecast by Material Type, 2019 to 2034
Table 37: Eastern Europe Market Value (US$ Million) Forecast by Distribution Channel, 2019 to 2034
Table 38: Eastern Europe Market Volume (Units) Forecast by Distribution Channel, 2019 to 2034
Table 39: Eastern Europe Market Value (US$ Million) Forecast by Primary Usage, 2019 to 2034
Table 40: Eastern Europe Market Volume (Units) Forecast by Primary Usage, 2019 to 2034
Table 41: South Asia and Pacific Market Value (US$ Million) Forecast by Country, 2019 to 2034
Table 42: South Asia and Pacific Market Volume (Units) Forecast by Country, 2019 to 2034
Table 43: South Asia and Pacific Market Value (US$ Million) Forecast by Material Type, 2019 to 2034
Table 44: South Asia and Pacific Market Volume (Units) Forecast by Material Type, 2019 to 2034
Table 45: South Asia and Pacific Market Value (US$ Million) Forecast by Distribution Channel, 2019 to 2034
Table 46: South Asia and Pacific Market Volume (Units) Forecast by Distribution Channel, 2019 to 2034
Table 47: South Asia and Pacific Market Value (US$ Million) Forecast by Primary Usage, 2019 to 2034
Table 48: South Asia and Pacific Market Volume (Units) Forecast by Primary Usage, 2019 to 2034
Table 49: East Asia Market Value (US$ Million) Forecast by Country, 2019 to 2034
Table 50: East Asia Market Volume (Units) Forecast by Country, 2019 to 2034
Table 51: East Asia Market Value (US$ Million) Forecast by Material Type, 2019 to 2034
Table 52: East Asia Market Volume (Units) Forecast by Material Type, 2019 to 2034
Table 53: East Asia Market Value (US$ Million) Forecast by Distribution Channel, 2019 to 2034
Table 54: East Asia Market Volume (Units) Forecast by Distribution Channel, 2019 to 2034
Table 55: East Asia Market Value (US$ Million) Forecast by Primary Usage, 2019 to 2034
Table 56: East Asia Market Volume (Units) Forecast by Primary Usage, 2019 to 2034
Table 57: Middle East and Africa Market Value (US$ Million) Forecast by Country, 2019 to 2034
Table 58: Middle East and Africa Market Volume (Units) Forecast by Country, 2019 to 2034
Table 59: Middle East and Africa Market Value (US$ Million) Forecast by Material Type, 2019 to 2034
Table 60: Middle East and Africa Market Volume (Units) Forecast by Material Type, 2019 to 2034
Table 61: Middle East and Africa Market Value (US$ Million) Forecast by Distribution Channel, 2019 to 2034
Table 62: Middle East and Africa Market Volume (Units) Forecast by Distribution Channel, 2019 to 2034
Table 63: Middle East and Africa Market Value (US$ Million) Forecast by Primary Usage, 2019 to 2034
Table 64: Middle East and Africa Market Volume (Units) Forecast by Primary Usage, 2019 to 2034
Figure 1: Global Market Value (US$ Million) by Material Type, 2024 to 2034
Figure 2: Global Market Value (US$ Million) by Distribution Channel, 2024 to 2034
Figure 3: Global Market Value (US$ Million) by Primary Usage, 2024 to 2034
Figure 4: Global Market Value (US$ Million) by Region, 2024 to 2034
Figure 5: Global Market Value (US$ Million) Analysis by Region, 2019 to 2034
Figure 6: Global Market Volume (Units) Analysis by Region, 2019 to 2034
Figure 7: Global Market Value Share (%) and BPS Analysis by Region, 2024 to 2034
Figure 8: Global Market Y-o-Y Growth (%) Projections by Region, 2024 to 2034
Figure 9: Global Market Value (US$ Million) Analysis by Material Type, 2019 to 2034
Figure 10: Global Market Volume (Units) Analysis by Material Type, 2019 to 2034
Figure 11: Global Market Value Share (%) and BPS Analysis by Material Type, 2024 to 2034
Figure 12: Global Market Y-o-Y Growth (%) Projections by Material Type, 2024 to 2034
Figure 13: Global Market Value (US$ Million) Analysis by Distribution Channel, 2019 to 2034
Figure 14: Global Market Volume (Units) Analysis by Distribution Channel, 2019 to 2034
Figure 15: Global Market Value Share (%) and BPS Analysis by Distribution Channel, 2024 to 2034
Figure 16: Global Market Y-o-Y Growth (%) Projections by Distribution Channel, 2024 to 2034
Figure 17: Global Market Value (US$ Million) Analysis by Primary Usage, 2019 to 2034
Figure 18: Global Market Volume (Units) Analysis by Primary Usage, 2019 to 2034
Figure 19: Global Market Value Share (%) and BPS Analysis by Primary Usage, 2024 to 2034
Figure 20: Global Market Y-o-Y Growth (%) Projections by Primary Usage, 2024 to 2034
Figure 21: Global Market Attractiveness by Material Type, 2024 to 2034
Figure 22: Global Market Attractiveness by Distribution Channel, 2024 to 2034
Figure 23: Global Market Attractiveness by Primary Usage, 2024 to 2034
Figure 24: Global Market Attractiveness by Region, 2024 to 2034
Figure 25: North America Market Value (US$ Million) by Material Type, 2024 to 2034
Figure 26: North America Market Value (US$ Million) by Distribution Channel, 2024 to 2034
Figure 27: North America Market Value (US$ Million) by Primary Usage, 2024 to 2034
Figure 28: North America Market Value (US$ Million) by Country, 2024 to 2034
Figure 29: North America Market Value (US$ Million) Analysis by Country, 2019 to 2034
Figure 30: North America Market Volume (Units) Analysis by Country, 2019 to 2034
Figure 31: North America Market Value Share (%) and BPS Analysis by Country, 2024 to 2034
Figure 32: North America Market Y-o-Y Growth (%) Projections by Country, 2024 to 2034
Figure 33: North America Market Value (US$ Million) Analysis by Material Type, 2019 to 2034
Figure 34: North America Market Volume (Units) Analysis by Material Type, 2019 to 2034
Figure 35: North America Market Value Share (%) and BPS Analysis by Material Type, 2024 to 2034
Figure 36: North America Market Y-o-Y Growth (%) Projections by Material Type, 2024 to 2034
Figure 37: North America Market Value (US$ Million) Analysis by Distribution Channel, 2019 to 2034
Figure 38: North America Market Volume (Units) Analysis by Distribution Channel, 2019 to 2034
Figure 39: North America Market Value Share (%) and BPS Analysis by Distribution Channel, 2024 to 2034
Figure 40: North America Market Y-o-Y Growth (%) Projections by Distribution Channel, 2024 to 2034
Figure 41: North America Market Value (US$ Million) Analysis by Primary Usage, 2019 to 2034
Figure 42: North America Market Volume (Units) Analysis by Primary Usage, 2019 to 2034
Figure 43: North America Market Value Share (%) and BPS Analysis by Primary Usage, 2024 to 2034
Figure 44: North America Market Y-o-Y Growth (%) Projections by Primary Usage, 2024 to 2034
Figure 45: North America Market Attractiveness by Material Type, 2024 to 2034
Figure 46: North America Market Attractiveness by Distribution Channel, 2024 to 2034
Figure 47: North America Market Attractiveness by Primary Usage, 2024 to 2034
Figure 48: North America Market Attractiveness by Country, 2024 to 2034
Figure 49: Latin America Market Value (US$ Million) by Material Type, 2024 to 2034
Figure 50: Latin America Market Value (US$ Million) by Distribution Channel, 2024 to 2034
Figure 51: Latin America Market Value (US$ Million) by Primary Usage, 2024 to 2034
Figure 52: Latin America Market Value (US$ Million) by Country, 2024 to 2034
Figure 53: Latin America Market Value (US$ Million) Analysis by Country, 2019 to 2034
Figure 54: Latin America Market Volume (Units) Analysis by Country, 2019 to 2034
Figure 55: Latin America Market Value Share (%) and BPS Analysis by Country, 2024 to 2034
Figure 56: Latin America Market Y-o-Y Growth (%) Projections by Country, 2024 to 2034
Figure 57: Latin America Market Value (US$ Million) Analysis by Material Type, 2019 to 2034
Figure 58: Latin America Market Volume (Units) Analysis by Material Type, 2019 to 2034
Figure 59: Latin America Market Value Share (%) and BPS Analysis by Material Type, 2024 to 2034
Figure 60: Latin America Market Y-o-Y Growth (%) Projections by Material Type, 2024 to 2034
Figure 61: Latin America Market Value (US$ Million) Analysis by Distribution Channel, 2019 to 2034
Figure 62: Latin America Market Volume (Units) Analysis by Distribution Channel, 2019 to 2034
Figure 63: Latin America Market Value Share (%) and BPS Analysis by Distribution Channel, 2024 to 2034
Figure 64: Latin America Market Y-o-Y Growth (%) Projections by Distribution Channel, 2024 to 2034
Figure 65: Latin America Market Value (US$ Million) Analysis by Primary Usage, 2019 to 2034
Figure 66: Latin America Market Volume (Units) Analysis by Primary Usage, 2019 to 2034
Figure 67: Latin America Market Value Share (%) and BPS Analysis by Primary Usage, 2024 to 2034
Figure 68: Latin America Market Y-o-Y Growth (%) Projections by Primary Usage, 2024 to 2034
Figure 69: Latin America Market Attractiveness by Material Type, 2024 to 2034
Figure 70: Latin America Market Attractiveness by Distribution Channel, 2024 to 2034
Figure 71: Latin America Market Attractiveness by Primary Usage, 2024 to 2034
Figure 72: Latin America Market Attractiveness by Country, 2024 to 2034
Figure 73: Western Europe Market Value (US$ Million) by Material Type, 2024 to 2034
Figure 74: Western Europe Market Value (US$ Million) by Distribution Channel, 2024 to 2034
Figure 75: Western Europe Market Value (US$ Million) by Primary Usage, 2024 to 2034
Figure 76: Western Europe Market Value (US$ Million) by Country, 2024 to 2034
Figure 77: Western Europe Market Value (US$ Million) Analysis by Country, 2019 to 2034
Figure 78: Western Europe Market Volume (Units) Analysis by Country, 2019 to 2034
Figure 79: Western Europe Market Value Share (%) and BPS Analysis by Country, 2024 to 2034
Figure 80: Western Europe Market Y-o-Y Growth (%) Projections by Country, 2024 to 2034
Figure 81: Western Europe Market Value (US$ Million) Analysis by Material Type, 2019 to 2034
Figure 82: Western Europe Market Volume (Units) Analysis by Material Type, 2019 to 2034
Figure 83: Western Europe Market Value Share (%) and BPS Analysis by Material Type, 2024 to 2034
Figure 84: Western Europe Market Y-o-Y Growth (%) Projections by Material Type, 2024 to 2034
Figure 85: Western Europe Market Value (US$ Million) Analysis by Distribution Channel, 2019 to 2034
Figure 86: Western Europe Market Volume (Units) Analysis by Distribution Channel, 2019 to 2034
Figure 87: Western Europe Market Value Share (%) and BPS Analysis by Distribution Channel, 2024 to 2034
Figure 88: Western Europe Market Y-o-Y Growth (%) Projections by Distribution Channel, 2024 to 2034
Figure 89: Western Europe Market Value (US$ Million) Analysis by Primary Usage, 2019 to 2034
Figure 90: Western Europe Market Volume (Units) Analysis by Primary Usage, 2019 to 2034
Figure 91: Western Europe Market Value Share (%) and BPS Analysis by Primary Usage, 2024 to 2034
Figure 92: Western Europe Market Y-o-Y Growth (%) Projections by Primary Usage, 2024 to 2034
Figure 93: Western Europe Market Attractiveness by Material Type, 2024 to 2034
Figure 94: Western Europe Market Attractiveness by Distribution Channel, 2024 to 2034
Figure 95: Western Europe Market Attractiveness by Primary Usage, 2024 to 2034
Figure 96: Western Europe Market Attractiveness by Country, 2024 to 2034
Figure 97: Eastern Europe Market Value (US$ Million) by Material Type, 2024 to 2034
Figure 98: Eastern Europe Market Value (US$ Million) by Distribution Channel, 2024 to 2034
Figure 99: Eastern Europe Market Value (US$ Million) by Primary Usage, 2024 to 2034
Figure 100: Eastern Europe Market Value (US$ Million) by Country, 2024 to 2034
Figure 101: Eastern Europe Market Value (US$ Million) Analysis by Country, 2019 to 2034
Figure 102: Eastern Europe Market Volume (Units) Analysis by Country, 2019 to 2034
Figure 103: Eastern Europe Market Value Share (%) and BPS Analysis by Country, 2024 to 2034
Figure 104: Eastern Europe Market Y-o-Y Growth (%) Projections by Country, 2024 to 2034
Figure 105: Eastern Europe Market Value (US$ Million) Analysis by Material Type, 2019 to 2034
Figure 106: Eastern Europe Market Volume (Units) Analysis by Material Type, 2019 to 2034
Figure 107: Eastern Europe Market Value Share (%) and BPS Analysis by Material Type, 2024 to 2034
Figure 108: Eastern Europe Market Y-o-Y Growth (%) Projections by Material Type, 2024 to 2034
Figure 109: Eastern Europe Market Value (US$ Million) Analysis by Distribution Channel, 2019 to 2034
Figure 110: Eastern Europe Market Volume (Units) Analysis by Distribution Channel, 2019 to 2034
Figure 111: Eastern Europe Market Value Share (%) and BPS Analysis by Distribution Channel, 2024 to 2034
Figure 112: Eastern Europe Market Y-o-Y Growth (%) Projections by Distribution Channel, 2024 to 2034
Figure 113: Eastern Europe Market Value (US$ Million) Analysis by Primary Usage, 2019 to 2034
Figure 114: Eastern Europe Market Volume (Units) Analysis by Primary Usage, 2019 to 2034
Figure 115: Eastern Europe Market Value Share (%) and BPS Analysis by Primary Usage, 2024 to 2034
Figure 116: Eastern Europe Market Y-o-Y Growth (%) Projections by Primary Usage, 2024 to 2034
Figure 117: Eastern Europe Market Attractiveness by Material Type, 2024 to 2034
Figure 118: Eastern Europe Market Attractiveness by Distribution Channel, 2024 to 2034
Figure 119: Eastern Europe Market Attractiveness by Primary Usage, 2024 to 2034
Figure 120: Eastern Europe Market Attractiveness by Country, 2024 to 2034
Figure 121: South Asia and Pacific Market Value (US$ Million) by Material Type, 2024 to 2034
Figure 122: South Asia and Pacific Market Value (US$ Million) by Distribution Channel, 2024 to 2034
Figure 123: South Asia and Pacific Market Value (US$ Million) by Primary Usage, 2024 to 2034
Figure 124: South Asia and Pacific Market Value (US$ Million) by Country, 2024 to 2034
Figure 125: South Asia and Pacific Market Value (US$ Million) Analysis by Country, 2019 to 2034
Figure 126: South Asia and Pacific Market Volume (Units) Analysis by Country, 2019 to 2034
Figure 127: South Asia and Pacific Market Value Share (%) and BPS Analysis by Country, 2024 to 2034
Figure 128: South Asia and Pacific Market Y-o-Y Growth (%) Projections by Country, 2024 to 2034
Figure 129: South Asia and Pacific Market Value (US$ Million) Analysis by Material Type, 2019 to 2034
Figure 130: South Asia and Pacific Market Volume (Units) Analysis by Material Type, 2019 to 2034
Figure 131: South Asia and Pacific Market Value Share (%) and BPS Analysis by Material Type, 2024 to 2034
Figure 132: South Asia and Pacific Market Y-o-Y Growth (%) Projections by Material Type, 2024 to 2034
Figure 133: South Asia and Pacific Market Value (US$ Million) Analysis by Distribution Channel, 2019 to 2034
Figure 134: South Asia and Pacific Market Volume (Units) Analysis by Distribution Channel, 2019 to 2034
Figure 135: South Asia and Pacific Market Value Share (%) and BPS Analysis by Distribution Channel, 2024 to 2034
Figure 136: South Asia and Pacific Market Y-o-Y Growth (%) Projections by Distribution Channel, 2024 to 2034
Figure 137: South Asia and Pacific Market Value (US$ Million) Analysis by Primary Usage, 2019 to 2034
Figure 138: South Asia and Pacific Market Volume (Units) Analysis by Primary Usage, 2019 to 2034
Figure 139: South Asia and Pacific Market Value Share (%) and BPS Analysis by Primary Usage, 2024 to 2034
Figure 140: South Asia and Pacific Market Y-o-Y Growth (%) Projections by Primary Usage, 2024 to 2034
Figure 141: South Asia and Pacific Market Attractiveness by Material Type, 2024 to 2034
Figure 142: South Asia and Pacific Market Attractiveness by Distribution Channel, 2024 to 2034
Figure 143: South Asia and Pacific Market Attractiveness by Primary Usage, 2024 to 2034
Figure 144: South Asia and Pacific Market Attractiveness by Country, 2024 to 2034
Figure 145: East Asia Market Value (US$ Million) by Material Type, 2024 to 2034
Figure 146: East Asia Market Value (US$ Million) by Distribution Channel, 2024 to 2034
Figure 147: East Asia Market Value (US$ Million) by Primary Usage, 2024 to 2034
Figure 148: East Asia Market Value (US$ Million) by Country, 2024 to 2034
Figure 149: East Asia Market Value (US$ Million) Analysis by Country, 2019 to 2034
Figure 150: East Asia Market Volume (Units) Analysis by Country, 2019 to 2034
Figure 151: East Asia Market Value Share (%) and BPS Analysis by Country, 2024 to 2034
Figure 152: East Asia Market Y-o-Y Growth (%) Projections by Country, 2024 to 2034
Figure 153: East Asia Market Value (US$ Million) Analysis by Material Type, 2019 to 2034
Figure 154: East Asia Market Volume (Units) Analysis by Material Type, 2019 to 2034
Figure 155: East Asia Market Value Share (%) and BPS Analysis by Material Type, 2024 to 2034
Figure 156: East Asia Market Y-o-Y Growth (%) Projections by Material Type, 2024 to 2034
Figure 157: East Asia Market Value (US$ Million) Analysis by Distribution Channel, 2019 to 2034
Figure 158: East Asia Market Volume (Units) Analysis by Distribution Channel, 2019 to 2034
Figure 159: East Asia Market Value Share (%) and BPS Analysis by Distribution Channel, 2024 to 2034
Figure 160: East Asia Market Y-o-Y Growth (%) Projections by Distribution Channel, 2024 to 2034
Figure 161: East Asia Market Value (US$ Million) Analysis by Primary Usage, 2019 to 2034
Figure 162: East Asia Market Volume (Units) Analysis by Primary Usage, 2019 to 2034
Figure 163: East Asia Market Value Share (%) and BPS Analysis by Primary Usage, 2024 to 2034
Figure 164: East Asia Market Y-o-Y Growth (%) Projections by Primary Usage, 2024 to 2034
Figure 165: East Asia Market Attractiveness by Material Type, 2024 to 2034
Figure 166: East Asia Market Attractiveness by Distribution Channel, 2024 to 2034
Figure 167: East Asia Market Attractiveness by Primary Usage, 2024 to 2034
Figure 168: East Asia Market Attractiveness by Country, 2024 to 2034
Figure 169: Middle East and Africa Market Value (US$ Million) by Material Type, 2024 to 2034
Figure 170: Middle East and Africa Market Value (US$ Million) by Distribution Channel, 2024 to 2034
Figure 171: Middle East and Africa Market Value (US$ Million) by Primary Usage, 2024 to 2034
Figure 172: Middle East and Africa Market Value (US$ Million) by Country, 2024 to 2034
Figure 173: Middle East and Africa Market Value (US$ Million) Analysis by Country, 2019 to 2034
Figure 174: Middle East and Africa Market Volume (Units) Analysis by Country, 2019 to 2034
Figure 175: Middle East and Africa Market Value Share (%) and BPS Analysis by Country, 2024 to 2034
Figure 176: Middle East and Africa Market Y-o-Y Growth (%) Projections by Country, 2024 to 2034
Figure 177: Middle East and Africa Market Value (US$ Million) Analysis by Material Type, 2019 to 2034
Figure 178: Middle East and Africa Market Volume (Units) Analysis by Material Type, 2019 to 2034
Figure 179: Middle East and Africa Market Value Share (%) and BPS Analysis by Material Type, 2024 to 2034
Figure 180: Middle East and Africa Market Y-o-Y Growth (%) Projections by Material Type, 2024 to 2034
Figure 181: Middle East and Africa Market Value (US$ Million) Analysis by Distribution Channel, 2019 to 2034
Figure 182: Middle East and Africa Market Volume (Units) Analysis by Distribution Channel, 2019 to 2034
Figure 183: Middle East and Africa Market Value Share (%) and BPS Analysis by Distribution Channel, 2024 to 2034
Figure 184: Middle East and Africa Market Y-o-Y Growth (%) Projections by Distribution Channel, 2024 to 2034
Figure 185: Middle East and Africa Market Value (US$ Million) Analysis by Primary Usage, 2019 to 2034
Figure 186: Middle East and Africa Market Volume (Units) Analysis by Primary Usage, 2019 to 2034
Figure 187: Middle East and Africa Market Value Share (%) and BPS Analysis by Primary Usage, 2024 to 2034
Figure 188: Middle East and Africa Market Y-o-Y Growth (%) Projections by Primary Usage, 2024 to 2034
Figure 189: Middle East and Africa Market Attractiveness by Material Type, 2024 to 2034
Figure 190: Middle East and Africa Market Attractiveness by Distribution Channel, 2024 to 2034
Figure 191: Middle East and Africa Market Attractiveness by Primary Usage, 2024 to 2034
Figure 192: Middle East and Africa Market Attractiveness by Country, 2024 to 2034
The reusable water bottle market is projected to expand at a CAGR of 2.8% between 2024 and 2034.
The metal segment dominates the industry.
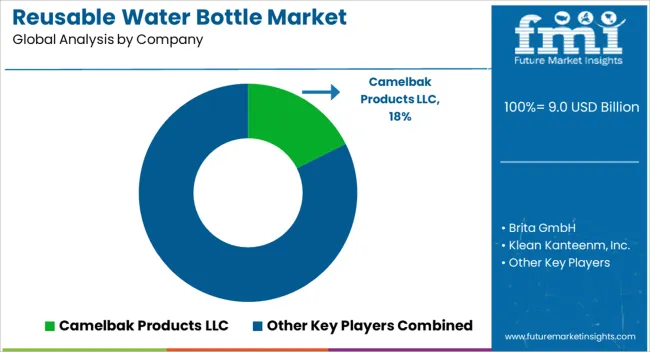
The top 3 reusable water bottle manufacturers are Camelbak Products LLC, Brita GmbH, and Klean Kanteenm, Inc.
The reusable water bottle market is anticipated to surpass USD 11.5 billion by 2034.
Growing environmental consciousness and the desire to reduce plastic waste are driving the demand for reusable water bottles.
Explore Similar Insights
Thank you!
You will receive an email from our Business Development Manager. Please be sure to check your SPAM/JUNK folder too.