Tray Packing Machine Market – Overview
Tray packing machine is a fully automatic machine which is designed for in-line operation. The primary function of tray packing machine is to collate the product into desired format, and load it onto preformed cardboard tray, then eject it into the infeed of tray shrink wrapper. Tray packing machines are used in various industries such as food & beverages, consumer goods, pharmaceuticals, industrial goods, and the manufacturing industry.
Need of optimization and increase productivity by utilizing automated tray packing machines is one of the ongoing trends observed in various industries. Tray packing machines make efficient use of material & energy and minimize the production of waste. Tray packing machines are used for high capacity applications. The tray packing machine is suitable for medium to large commercial production environments due to its extra wide seal area which accommodates up to four rows of large size trays.
The tray packing machine has different cycle times for different task such as up to 7 cycles/min for vacuum bags, 8.5 cycles/min for gas flush mode, and 10 cycles/min for seal only mode. Tray packing machines are easy and cost effective to maintain. Tray packing machine is formed by a fully mechanical tray forming section and a new infeed formation section.
The tray packing machine consists of step motor driven shafts which govern the various operation sequences and up until the actual positioning of the products bundle on the carton blank.
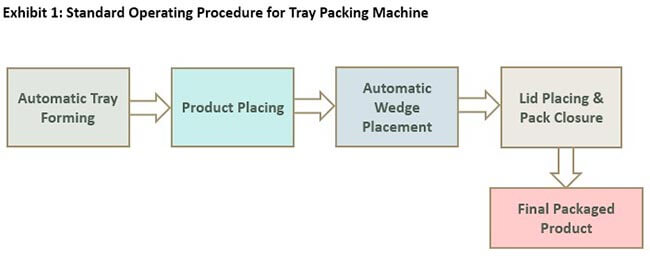
The standard operating procedure for tray packing machine includes automatic tray forming where multiple depth trays are formed with the help of glue and tucks. Tray is loaded on a conveyer and then products are placed inside it. After that wedge is formed and it is dispensed. The packed products are secured by the wedge. After wedge placement, lids and closures are placed over the tray and final packaged product is obtained.
The global tray packaging machine market is expected to draw growth due to numerous multinational and domestic organization. These organization are operating in different industries around the world that adopt tray packing machine as a part of their business strategies.
Tray packing machine is a cost effective and feasible packaging solution. Manufacturers of tray packing machine offers various advance features which includes product presence and positioning by means of camera, leaflet insertion, inkjet printing & data verification, rejection of tray at discharge, and closing with glue or tucking.
Tray packing machine is widely used in food & beverages industry. Tray packing machine is an ideal solution for take away food and drinks.
Tray Packing Machine Market – Regional Outlook:
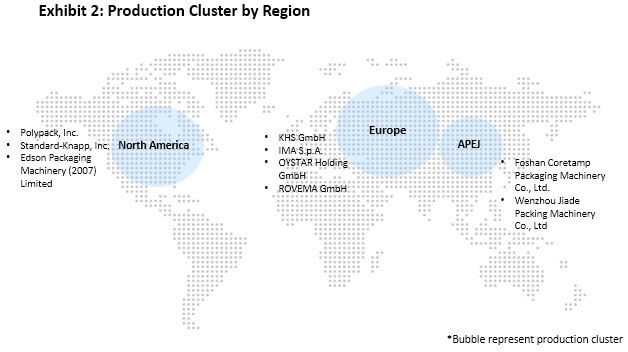
On the basis of geography, global tray packing machine market region is segmented into North America, Latin America, Asia-Pacific excluding Japan (APEJ), Eastern Europe, Western Europe, Middle East & Africa (MEA), and Japan. Among these regions, North America is presently leading the global tray packing machine market due to a large population which prefers ready-to-eat packaged food.
Along with North America, Asia Pacific tray packing machine market is projected to grow at a significant rate during the forecast period due to major investments in the food & beverage sector. The demand for tray packing machines is also anticipated to register high growth in global manufacturing hubs such as Europe and Latin America region.
Tray Packing Machine Market – Key Players
Some of the key players operating in the global tray packing machine market are segmented into three tiers as tier 1, tier 2, and tier 3.
Tier 1: KHS GmbH and IMA S.p.A.
Tier 2: OYSTAR Holding GmbH, ROVEMA GmbH, SMI S.p.A., CAMA Group.
Tier 3: Ossid, LLC, ARPAC LLC, BVM Brunner GmbH & Co KGCurti Costruzioni Meccaniche SpA, , Meypack Verpackungssystemtechnik GmbH, Polypack, Inc., Standard-Knapp, Inc., Edson Packaging Machinery (2007) Limited, and Brenton, LLC.
Some of the major Chinese key players operating in global tray packing machine market are Foshan Coretamp Packaging Machinery Co., Ltd., Guangzhou Mingyue Packaging Machine Co., Ltd., Wenzhou Jiade Packing Machinery Co., Ltd., Longkou Zhuyou Fulong Machinery Component, Hangzhou Yibao Machinery, and Wenzhou Anbo Machinery Co., Ltd.
Tray Packing Machine Market – Key Developments
The global tray packing machine market is characterized by several new design level trends. Therefore, the competition is in terms of packaging optimization
- For instance, the Hot Water Tunnel 500 HWT by Ossid, LLC provides hot water shrink to maximize package integrity.
- The Leak Resistant Overwrapper 500E by the same company reduces the use of films by 36 – 41%, as compared to standard equipment.
The research report presents a comprehensive assessment of the market and contains thoughtful insights, facts, historical data, and statistically supported and industry-validated market data. It also contains projections using a suitable set of assumptions and methodologies. The research report provides analysis and information according to market segments such as geographies, application, and industry.
The report covers exhaust analysis on
- Market Segments
- Market Dynamics
- Market Size
- Supply & Demand
- Current Trends/Issues/Challenges
- Competition & Companies involved
- Technology
- Value Chain
Regional analysis includes
- North America (U.S., Canada)
- Latin America (Mexico. Brazil)
- Western Europe (Germany, Italy, France, U.K, Spain)
- Eastern Europe (Poland, Russia)
- Asia Pacific (China, India, ASEAN, Australia & New Zealand)
- Japan
- Middle East and Africa (GCC Countries, S. Africa, Northern Africa)
The report is a compilation of first-hand information, qualitative and quantitative assessment by industry analysts, inputs from industry experts and industry participants across the value chain. The report provides in-depth analysis of parent market trends, macro-economic indicators and governing factors along with market attractiveness as per segments. The report also maps the qualitative impact of various market factors on market segments and geographies.
Tray Packing Machine Market – Segmentation
The global tray packing machine market is segmented on the basis of product type, and by application type. The pricing analysis of the tray packing machine market can be done on the basis of product type segment.
On the basis of Modularity, FTIR gas analysers market is segmented into:
- Rack mount
- Portable
On the basis of product type, the global tray packing market is segmented as follows:
- Food & Beverages
- Pharmaceutical
- Chemical and Fertilizers
- Automotive
- Consumer Packaged goods
- Textile
- Others
Table of Content
- Executive Summary
- Global Market Outlook
- Demand-side Trends
- Supply-side Trends
- Technology Roadmap Analysis
- Analysis and Recommendations
- Market Overview
- Market Coverage / Taxonomy
- Market Definition / Scope / Limitations
Read More...
- Market Background
- Market Dynamics
- Drivers
- Restraints
- Opportunity
- Trends
- Scenario Forecast
- Demand in Optimistic Scenario
- Demand in Likely Scenario
- Demand in Conservative Scenario
- Opportunity Map Analysis
- Product Life Cycle Analysis
- Supply Chain Analysis
- Investment Feasibility Matrix
- Value Chain Analysis
- PESTLE and Porter’s Analysis
- Regulatory Landscape
- Regional Parent Market Outlook
- Production and Consumption Statistics
- Import and Export Statistics
- Market Dynamics
- Global Market Analysis 2021 to 2025 and Forecast, 2026 to 2036
- Historical Market Size Value (USD Million) Analysis, 2021 to 2025
- Current and Future Market Size Value (USD Million) Projections, 2026 to 2036
- Y-o-Y Growth Trend Analysis
- Absolute $ Opportunity Analysis
- Global Market Pricing Analysis 2021 to 2025 and Forecast 2026 to 2036
- Global Market Analysis 2021 to 2025 and Forecast 2026 to 2036, By Product
- Introduction / Key Findings
- Historical Market Size Value (USD Million) Analysis By Product , 2021 to 2025
- Current and Future Market Size Value (USD Million) Analysis and Forecast By Product , 2026 to 2036
- EZ-IO
- B.I.G
- FAST1
- FASTR
- IO Needles
- Others
- EZ-IO
- Y-o-Y Growth Trend Analysis By Product , 2021 to 2025
- Absolute $ Opportunity Analysis By Product , 2026 to 2036
- Global Market Analysis 2021 to 2025 and Forecast 2026 to 2036, By Route of Administration
- Introduction / Key Findings
- Historical Market Size Value (USD Million) Analysis By Route of Administration, 2021 to 2025
- Current and Future Market Size Value (USD Million) Analysis and Forecast By Route of Administration, 2026 to 2036
- Sternum
- Distal & Proximal Tibia
- Distal Femur
- Calcaneus
- Head of Humerus
- Sternum
- Y-o-Y Growth Trend Analysis By Route of Administration, 2021 to 2025
- Absolute $ Opportunity Analysis By Route of Administration, 2026 to 2036
- Global Market Analysis 2021 to 2025 and Forecast 2026 to 2036, By End User
- Introduction / Key Findings
- Historical Market Size Value (USD Million) Analysis By End User, 2021 to 2025
- Current and Future Market Size Value (USD Million) Analysis and Forecast By End User, 2026 to 2036
- EMS
- Hospitals
- Ambulatory Surgical Centers
- Cardiac Care Centers
- EMS
- Y-o-Y Growth Trend Analysis By End User, 2021 to 2025
- Absolute $ Opportunity Analysis By End User, 2026 to 2036
- Global Market Analysis 2021 to 2025 and Forecast 2026 to 2036, By Region
- Introduction
- Historical Market Size Value (USD Million) Analysis By Region, 2021 to 2025
- Current Market Size Value (USD Million) Analysis and Forecast By Region, 2026 to 2036
- North America
- Latin America
- Western Europe
- Eastern Europe
- East Asia
- South Asia and Pacific
- Middle East & Africa
- Market Attractiveness Analysis By Region
- North America Market Analysis 2021 to 2025 and Forecast 2026 to 2036, By Country
- Historical Market Size Value (USD Million) Trend Analysis By Market Taxonomy, 2021 to 2025
- Market Size Value (USD Million) Forecast By Market Taxonomy, 2026 to 2036
- By Country
- USA
- Canada
- Mexico
- By Product
- By Route of Administration
- By End User
- By Country
- Market Attractiveness Analysis
- By Country
- By Product
- By Route of Administration
- By End User
- Key Takeaways
- Latin America Market Analysis 2021 to 2025 and Forecast 2026 to 2036, By Country
- Historical Market Size Value (USD Million) Trend Analysis By Market Taxonomy, 2021 to 2025
- Market Size Value (USD Million) Forecast By Market Taxonomy, 2026 to 2036
- By Country
- Brazil
- Chile
- Rest of Latin America
- By Product
- By Route of Administration
- By End User
- By Country
- Market Attractiveness Analysis
- By Country
- By Product
- By Route of Administration
- By End User
- Key Takeaways
- Western Europe Market Analysis 2021 to 2025 and Forecast 2026 to 2036, By Country
- Historical Market Size Value (USD Million) Trend Analysis By Market Taxonomy, 2021 to 2025
- Market Size Value (USD Million) Forecast By Market Taxonomy, 2026 to 2036
- By Country
- Germany
- UK
- Italy
- Spain
- France
- Nordic
- BENELUX
- Rest of Western Europe
- By Product
- By Route of Administration
- By End User
- By Country
- Market Attractiveness Analysis
- By Country
- By Product
- By Route of Administration
- By End User
- Key Takeaways
- Eastern Europe Market Analysis 2021 to 2025 and Forecast 2026 to 2036, By Country
- Historical Market Size Value (USD Million) Trend Analysis By Market Taxonomy, 2021 to 2025
- Market Size Value (USD Million) Forecast By Market Taxonomy, 2026 to 2036
- By Country
- Russia
- Poland
- Hungary
- Balkan & Baltic
- Rest of Eastern Europe
- By Product
- By Route of Administration
- By End User
- By Country
- Market Attractiveness Analysis
- By Country
- By Product
- By Route of Administration
- By End User
- Key Takeaways
- East Asia Market Analysis 2021 to 2025 and Forecast 2026 to 2036, By Country
- Historical Market Size Value (USD Million) Trend Analysis By Market Taxonomy, 2021 to 2025
- Market Size Value (USD Million) Forecast By Market Taxonomy, 2026 to 2036
- By Country
- China
- Japan
- South Korea
- By Product
- By Route of Administration
- By End User
- By Country
- Market Attractiveness Analysis
- By Country
- By Product
- By Route of Administration
- By End User
- Key Takeaways
- South Asia and Pacific Market Analysis 2021 to 2025 and Forecast 2026 to 2036, By Country
- Historical Market Size Value (USD Million) Trend Analysis By Market Taxonomy, 2021 to 2025
- Market Size Value (USD Million) Forecast By Market Taxonomy, 2026 to 2036
- By Country
- India
- ASEAN
- Australia & New Zealand
- Rest of South Asia and Pacific
- By Product
- By Route of Administration
- By End User
- By Country
- Market Attractiveness Analysis
- By Country
- By Product
- By Route of Administration
- By End User
- Key Takeaways
- Middle East & Africa Market Analysis 2021 to 2025 and Forecast 2026 to 2036, By Country
- Historical Market Size Value (USD Million) Trend Analysis By Market Taxonomy, 2021 to 2025
- Market Size Value (USD Million) Forecast By Market Taxonomy, 2026 to 2036
- By Country
- Kingdom of Saudi Arabia
- Other GCC Countries
- Turkiye
- South Africa
- Other African Union
- Rest of Middle East & Africa
- By Product
- By Route of Administration
- By End User
- By Country
- Market Attractiveness Analysis
- By Country
- By Product
- By Route of Administration
- By End User
- Key Takeaways
- Key Countries Market Analysis
- USA
- Pricing Analysis
- Market Share Analysis, 2025
- By Product
- By Route of Administration
- By End User
- Canada
- Pricing Analysis
- Market Share Analysis, 2025
- By Product
- By Route of Administration
- By End User
- Mexico
- Pricing Analysis
- Market Share Analysis, 2025
- By Product
- By Route of Administration
- By End User
- Brazil
- Pricing Analysis
- Market Share Analysis, 2025
- By Product
- By Route of Administration
- By End User
- Chile
- Pricing Analysis
- Market Share Analysis, 2025
- By Product
- By Route of Administration
- By End User
- Germany
- Pricing Analysis
- Market Share Analysis, 2025
- By Product
- By Route of Administration
- By End User
- UK
- Pricing Analysis
- Market Share Analysis, 2025
- By Product
- By Route of Administration
- By End User
- Italy
- Pricing Analysis
- Market Share Analysis, 2025
- By Product
- By Route of Administration
- By End User
- Spain
- Pricing Analysis
- Market Share Analysis, 2025
- By Product
- By Route of Administration
- By End User
- France
- Pricing Analysis
- Market Share Analysis, 2025
- By Product
- By Route of Administration
- By End User
- India
- Pricing Analysis
- Market Share Analysis, 2025
- By Product
- By Route of Administration
- By End User
- ASEAN
- Pricing Analysis
- Market Share Analysis, 2025
- By Product
- By Route of Administration
- By End User
- Australia & New Zealand
- Pricing Analysis
- Market Share Analysis, 2025
- By Product
- By Route of Administration
- By End User
- China
- Pricing Analysis
- Market Share Analysis, 2025
- By Product
- By Route of Administration
- By End User
- Japan
- Pricing Analysis
- Market Share Analysis, 2025
- By Product
- By Route of Administration
- By End User
- South Korea
- Pricing Analysis
- Market Share Analysis, 2025
- By Product
- By Route of Administration
- By End User
- Russia
- Pricing Analysis
- Market Share Analysis, 2025
- By Product
- By Route of Administration
- By End User
- Poland
- Pricing Analysis
- Market Share Analysis, 2025
- By Product
- By Route of Administration
- By End User
- Hungary
- Pricing Analysis
- Market Share Analysis, 2025
- By Product
- By Route of Administration
- By End User
- Kingdom of Saudi Arabia
- Pricing Analysis
- Market Share Analysis, 2025
- By Product
- By Route of Administration
- By End User
- Turkiye
- Pricing Analysis
- Market Share Analysis, 2025
- By Product
- By Route of Administration
- By End User
- South Africa
- Pricing Analysis
- Market Share Analysis, 2025
- By Product
- By Route of Administration
- By End User
- USA
- Market Structure Analysis
- Competition Dashboard
- Competition Benchmarking
- Market Share Analysis of Top Players
- By Regional
- By Product
- By Route of Administration
- By End User
- Competition Analysis
- Competition Deep Dive
- Teleflex
- Overview
- Product Portfolio
- Profitability by Market Segments (Product/Age /Sales Channel/Region)
- Sales Footprint
- Strategy Overview
- Marketing Strategy
- Product Strategy
- Channel Strategy
- Smiths Medical
- Becton Dickinson (BD)
- ICU Medical
- Zhejiang Shanshan Broadmed
- Teleflex
- Competition Deep Dive
- Assumptions & Acronyms Used
- Research Methodology
List of Tables
- Table 1: Global Market Value (USD Million) Forecast by Region, 2021 to 2036
- Table 2: Global Market Value (USD Million) Forecast by Product , 2021 to 2036
- Table 3: Global Market Value (USD Million) Forecast by Route of Administration, 2021 to 2036
- Table 4: Global Market Value (USD Million) Forecast by End User, 2021 to 2036
- Table 5: North America Market Value (USD Million) Forecast by Country, 2021 to 2036
- Table 6: North America Market Value (USD Million) Forecast by Product , 2021 to 2036
- Table 7: North America Market Value (USD Million) Forecast by Route of Administration, 2021 to 2036
- Table 8: North America Market Value (USD Million) Forecast by End User, 2021 to 2036
- Table 9: Latin America Market Value (USD Million) Forecast by Country, 2021 to 2036
- Table 10: Latin America Market Value (USD Million) Forecast by Product , 2021 to 2036
- Table 11: Latin America Market Value (USD Million) Forecast by Route of Administration, 2021 to 2036
- Table 12: Latin America Market Value (USD Million) Forecast by End User, 2021 to 2036
- Table 13: Western Europe Market Value (USD Million) Forecast by Country, 2021 to 2036
- Table 14: Western Europe Market Value (USD Million) Forecast by Product , 2021 to 2036
- Table 15: Western Europe Market Value (USD Million) Forecast by Route of Administration, 2021 to 2036
- Table 16: Western Europe Market Value (USD Million) Forecast by End User, 2021 to 2036
- Table 17: Eastern Europe Market Value (USD Million) Forecast by Country, 2021 to 2036
- Table 18: Eastern Europe Market Value (USD Million) Forecast by Product , 2021 to 2036
- Table 19: Eastern Europe Market Value (USD Million) Forecast by Route of Administration, 2021 to 2036
- Table 20: Eastern Europe Market Value (USD Million) Forecast by End User, 2021 to 2036
- Table 21: East Asia Market Value (USD Million) Forecast by Country, 2021 to 2036
- Table 22: East Asia Market Value (USD Million) Forecast by Product , 2021 to 2036
- Table 23: East Asia Market Value (USD Million) Forecast by Route of Administration, 2021 to 2036
- Table 24: East Asia Market Value (USD Million) Forecast by End User, 2021 to 2036
- Table 25: South Asia and Pacific Market Value (USD Million) Forecast by Country, 2021 to 2036
- Table 26: South Asia and Pacific Market Value (USD Million) Forecast by Product , 2021 to 2036
- Table 27: South Asia and Pacific Market Value (USD Million) Forecast by Route of Administration, 2021 to 2036
- Table 28: South Asia and Pacific Market Value (USD Million) Forecast by End User, 2021 to 2036
- Table 29: Middle East & Africa Market Value (USD Million) Forecast by Country, 2021 to 2036
- Table 30: Middle East & Africa Market Value (USD Million) Forecast by Product , 2021 to 2036
- Table 31: Middle East & Africa Market Value (USD Million) Forecast by Route of Administration, 2021 to 2036
- Table 32: Middle East & Africa Market Value (USD Million) Forecast by End User, 2021 to 2036
List of Figures
- Figure 1: Global Market Pricing Analysis
- Figure 2: Global Market Value (USD Million) Forecast 2021-2036
- Figure 3: Global Market Value Share and BPS Analysis by Product , 2026 and 2036
- Figure 4: Global Market Y-o-Y Growth Comparison by Product , 2026-2036
- Figure 5: Global Market Attractiveness Analysis by Product
- Figure 6: Global Market Value Share and BPS Analysis by Route of Administration, 2026 and 2036
- Figure 7: Global Market Y-o-Y Growth Comparison by Route of Administration, 2026-2036
- Figure 8: Global Market Attractiveness Analysis by Route of Administration
- Figure 9: Global Market Value Share and BPS Analysis by End User, 2026 and 2036
- Figure 10: Global Market Y-o-Y Growth Comparison by End User, 2026-2036
- Figure 11: Global Market Attractiveness Analysis by End User
- Figure 12: Global Market Value (USD Million) Share and BPS Analysis by Region, 2026 and 2036
- Figure 13: Global Market Y-o-Y Growth Comparison by Region, 2026-2036
- Figure 14: Global Market Attractiveness Analysis by Region
- Figure 15: North America Market Incremental Dollar Opportunity, 2026-2036
- Figure 16: Latin America Market Incremental Dollar Opportunity, 2026-2036
- Figure 17: Western Europe Market Incremental Dollar Opportunity, 2026-2036
- Figure 18: Eastern Europe Market Incremental Dollar Opportunity, 2026-2036
- Figure 19: East Asia Market Incremental Dollar Opportunity, 2026-2036
- Figure 20: South Asia and Pacific Market Incremental Dollar Opportunity, 2026-2036
- Figure 21: Middle East & Africa Market Incremental Dollar Opportunity, 2026-2036
- Figure 22: North America Market Value Share and BPS Analysis by Country, 2026 and 2036
- Figure 23: North America Market Value Share and BPS Analysis by Product , 2026 and 2036
- Figure 24: North America Market Y-o-Y Growth Comparison by Product , 2026-2036
- Figure 25: North America Market Attractiveness Analysis by Product
- Figure 26: North America Market Value Share and BPS Analysis by Route of Administration, 2026 and 2036
- Figure 27: North America Market Y-o-Y Growth Comparison by Route of Administration, 2026-2036
- Figure 28: North America Market Attractiveness Analysis by Route of Administration
- Figure 29: North America Market Value Share and BPS Analysis by End User, 2026 and 2036
- Figure 30: North America Market Y-o-Y Growth Comparison by End User, 2026-2036
- Figure 31: North America Market Attractiveness Analysis by End User
- Figure 32: Latin America Market Value Share and BPS Analysis by Country, 2026 and 2036
- Figure 33: Latin America Market Value Share and BPS Analysis by Product , 2026 and 2036
- Figure 34: Latin America Market Y-o-Y Growth Comparison by Product , 2026-2036
- Figure 35: Latin America Market Attractiveness Analysis by Product
- Figure 36: Latin America Market Value Share and BPS Analysis by Route of Administration, 2026 and 2036
- Figure 37: Latin America Market Y-o-Y Growth Comparison by Route of Administration, 2026-2036
- Figure 38: Latin America Market Attractiveness Analysis by Route of Administration
- Figure 39: Latin America Market Value Share and BPS Analysis by End User, 2026 and 2036
- Figure 40: Latin America Market Y-o-Y Growth Comparison by End User, 2026-2036
- Figure 41: Latin America Market Attractiveness Analysis by End User
- Figure 42: Western Europe Market Value Share and BPS Analysis by Country, 2026 and 2036
- Figure 43: Western Europe Market Value Share and BPS Analysis by Product , 2026 and 2036
- Figure 44: Western Europe Market Y-o-Y Growth Comparison by Product , 2026-2036
- Figure 45: Western Europe Market Attractiveness Analysis by Product
- Figure 46: Western Europe Market Value Share and BPS Analysis by Route of Administration, 2026 and 2036
- Figure 47: Western Europe Market Y-o-Y Growth Comparison by Route of Administration, 2026-2036
- Figure 48: Western Europe Market Attractiveness Analysis by Route of Administration
- Figure 49: Western Europe Market Value Share and BPS Analysis by End User, 2026 and 2036
- Figure 50: Western Europe Market Y-o-Y Growth Comparison by End User, 2026-2036
- Figure 51: Western Europe Market Attractiveness Analysis by End User
- Figure 52: Eastern Europe Market Value Share and BPS Analysis by Country, 2026 and 2036
- Figure 53: Eastern Europe Market Value Share and BPS Analysis by Product , 2026 and 2036
- Figure 54: Eastern Europe Market Y-o-Y Growth Comparison by Product , 2026-2036
- Figure 55: Eastern Europe Market Attractiveness Analysis by Product
- Figure 56: Eastern Europe Market Value Share and BPS Analysis by Route of Administration, 2026 and 2036
- Figure 57: Eastern Europe Market Y-o-Y Growth Comparison by Route of Administration, 2026-2036
- Figure 58: Eastern Europe Market Attractiveness Analysis by Route of Administration
- Figure 59: Eastern Europe Market Value Share and BPS Analysis by End User, 2026 and 2036
- Figure 60: Eastern Europe Market Y-o-Y Growth Comparison by End User, 2026-2036
- Figure 61: Eastern Europe Market Attractiveness Analysis by End User
- Figure 62: East Asia Market Value Share and BPS Analysis by Country, 2026 and 2036
- Figure 63: East Asia Market Value Share and BPS Analysis by Product , 2026 and 2036
- Figure 64: East Asia Market Y-o-Y Growth Comparison by Product , 2026-2036
- Figure 65: East Asia Market Attractiveness Analysis by Product
- Figure 66: East Asia Market Value Share and BPS Analysis by Route of Administration, 2026 and 2036
- Figure 67: East Asia Market Y-o-Y Growth Comparison by Route of Administration, 2026-2036
- Figure 68: East Asia Market Attractiveness Analysis by Route of Administration
- Figure 69: East Asia Market Value Share and BPS Analysis by End User, 2026 and 2036
- Figure 70: East Asia Market Y-o-Y Growth Comparison by End User, 2026-2036
- Figure 71: East Asia Market Attractiveness Analysis by End User
- Figure 72: South Asia and Pacific Market Value Share and BPS Analysis by Country, 2026 and 2036
- Figure 73: South Asia and Pacific Market Value Share and BPS Analysis by Product , 2026 and 2036
- Figure 74: South Asia and Pacific Market Y-o-Y Growth Comparison by Product , 2026-2036
- Figure 75: South Asia and Pacific Market Attractiveness Analysis by Product
- Figure 76: South Asia and Pacific Market Value Share and BPS Analysis by Route of Administration, 2026 and 2036
- Figure 77: South Asia and Pacific Market Y-o-Y Growth Comparison by Route of Administration, 2026-2036
- Figure 78: South Asia and Pacific Market Attractiveness Analysis by Route of Administration
- Figure 79: South Asia and Pacific Market Value Share and BPS Analysis by End User, 2026 and 2036
- Figure 80: South Asia and Pacific Market Y-o-Y Growth Comparison by End User, 2026-2036
- Figure 81: South Asia and Pacific Market Attractiveness Analysis by End User
- Figure 82: Middle East & Africa Market Value Share and BPS Analysis by Country, 2026 and 2036
- Figure 83: Middle East & Africa Market Value Share and BPS Analysis by Product , 2026 and 2036
- Figure 84: Middle East & Africa Market Y-o-Y Growth Comparison by Product , 2026-2036
- Figure 85: Middle East & Africa Market Attractiveness Analysis by Product
- Figure 86: Middle East & Africa Market Value Share and BPS Analysis by Route of Administration, 2026 and 2036
- Figure 87: Middle East & Africa Market Y-o-Y Growth Comparison by Route of Administration, 2026-2036
- Figure 88: Middle East & Africa Market Attractiveness Analysis by Route of Administration
- Figure 89: Middle East & Africa Market Value Share and BPS Analysis by End User, 2026 and 2036
- Figure 90: Middle East & Africa Market Y-o-Y Growth Comparison by End User, 2026-2036
- Figure 91: Middle East & Africa Market Attractiveness Analysis by End User
- Figure 92: Global Market - Tier Structure Analysis
- Figure 93: Global Market - Company Share Analysis
Frequently Asked Questions
How big is the intraosseous infusion devices market in 2026?
The global intraosseous infusion devices market is estimated to be valued at USD 5,446.2 million in 2026.
What will be the size of intraosseous infusion devices market in 2036?
The market size for the intraosseous infusion devices market is projected to reach USD 11,224.8 million by 2036.
How much will be the intraosseous infusion devices market growth between 2026 and 2036?
The intraosseous infusion devices market is expected to grow at a 7.5% CAGR between 2026 and 2036.
What are the key product types in the intraosseous infusion devices market?
The key product types in intraosseous infusion devices market are ez-io, b.i.g, fast1, fastr, io needles and others.
Which route of administration segment to contribute significant share in the intraosseous infusion devices market in 2026?
In terms of route of administration, sternum segment to command 30.9% share in the intraosseous infusion devices market in 2026.
Preview the report firsthand - request a free sample
Get SampleGet the brochure for pricing and purchase details.
Get PDF