Global Fragmentable Nasal and Ear Dressing Market Size and Share Forecast Snapshot for 2023 to 2033

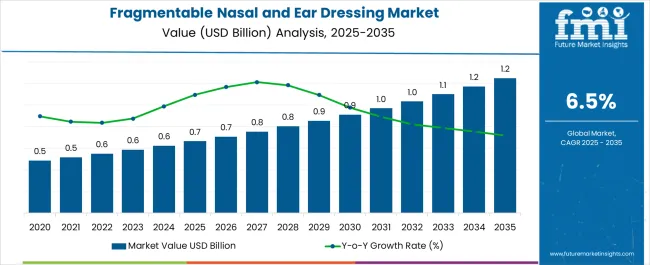
According to Future Market Insights research, during the projected period, the global Fragmentable Nasal And Ear Dressing Market is expected to grow at a CAGR of 6.5%.

The market value is projected to increase from USD 585.8 Million in 2023 to USD 1.1 Billion by 2033. The fragmentable nasal and ear dressing market was valued at USD 550.2 Million at the end of 2022 and is anticipated to exhibit Y-o-Y growth of 6.2% in 2023.

Market Outlook:

Data Points Market Insights
Market Value 2022 USD 550.2 Million
Market Value 2023 USD 585.8 Million
Market Value 2033 USD 1.1 Billion
CAGR 2023 to 2033 6.5%
Market Share of Top 5 Countries 61.3%
Key Market Players Stryker, Smith and Nephew plc., Medtronic, Pfizer Inc., Hemostasis, LLC, Datt Mediproducts Private Limited, First Aid Bandage Company (FABCO), Summit Medical LLC (Innovia Medical), Olympus Corporation, and Lohmann & Rauscher GmbH & Co. KG.

Fragmentable nasal and ear dressings offer several advantages over traditional dressings, making them a preferred choice in the medical field. These advantages contribute to their increasing applications and market demand.

The rising incidence of nasal and ear disorders, such as sinusitis, rhinitis, and otitis media, is driving the demand for fragmentable nasal and ear dressings. These dressings help in wound healing, reduce bleeding, and provide protection to the affected areas.

Also, the rise in awareness among healthcare professionals and patients about the benefits of fragmentable nasal and ear dressings is contributing to the growth of the market. These dressings offer advantages such as easy application, improved patient compliance, and reduced discomfort compared to traditional treatment methods.

Sales Analysis of the Fragmentable Nasal and Ear Dressing Market (2018–2022) vs Outlook for 2023 to 2033

The market value for fragmentable nasal and ear dressing was around 4.8% of the overall USD 11.5 Billion of the global wound care dressings market in 2022. The market for fragmentable nasal and ear dressing expanded at a CAGR of 5.7% from 2018 to 2022, due to the increasing cases of ear and nasal surgeries.

Fragmentable nasal and ear dressings have indeed emerged as a distinct field within the broader domain of wound care and medical dressings. While traditional dressings have been used for various types of wounds, the specific needs and challenges associated with nasal and ear wounds have led to the development of specialized dressings.

The emergence of fragmentable nasal and ear dressings can be attributed to advancements in material science, medical technology, and a better understanding of the unique characteristics of nasal and ear wounds.

These dressings are designed to address the anatomical and physiological considerations of the nasal and ear regions, providing tailored solutions for wound healing and management.

Fragmentable dressings are typically made from materials that can fragment or absorb over time, promoting wound healing and minimizing the need for dressing removal.

These materials may include bioabsorbable substances such as collagen, gelatin, or synthetic polymers that gradually degrade and integrate with the body's tissues. This points to the increase adoption of these types of dressing which boosts the market growth.

Key Opportunities for Fragmentable Nasal and Ear Dressing Manufacturers to Drive Market Growth

There is ample of opportunity for manufacturers to innovate and develop new fragmentable nasal and ear dressing products. This can involve the exploration of new materials, improved designs, and enhanced functionalities.

By introducing innovative products that address specific needs, manufacturers can differentiate themselves and capture market share.

Apart from this, collaborations with healthcare professionals, such as ENT specialists, surgeons, and wound care specialists, can lead to valuable partnerships.

By understanding the specific requirements and challenges faced by healthcare professionals in nasal and ear wound care, manufacturers can develop tailored solutions and gain insights for product improvements.

Adhering to regulatory requirements and obtaining necessary certifications is crucial for fragmentable nasal and ear dressing manufacturers. Ensuring compliance with quality standards and regulations can enhance trust and credibility among healthcare professionals and regulatory authorities, facilitating market entry and acceptance.

This can create opportunities for the manufacturers in the fragmentable nasal and ear dressing market.

Restraining Factors Impacting the Demand for Fragmentable Nasal and Ear Dressings Globally

Higher costs associated with fragmentable ear and nasal dressings compared to traditional dressings may result in limited adoption by healthcare providers and patients.

If the pricing of these specialized dressings is perceived as too high, healthcare facilities or individuals with budget constraints may opt for more affordable alternatives, thereby reducing the demand for fragmentable dressings.

Also, insurance coverage and reimbursement policies can significantly influence the affordability of medical products. If fragmentable ear and nasal dressings are not adequately covered by insurance plans or if reimbursement rates are low, patients may face out-of-pocket expenses that they may find difficult to afford.

This can discourage patients from opting for fragmentable dressings, leading to lower market demand.
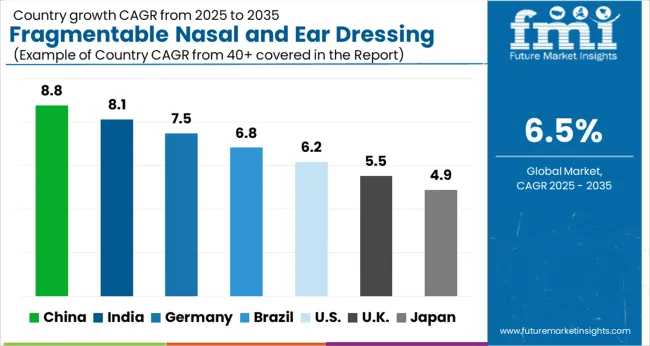
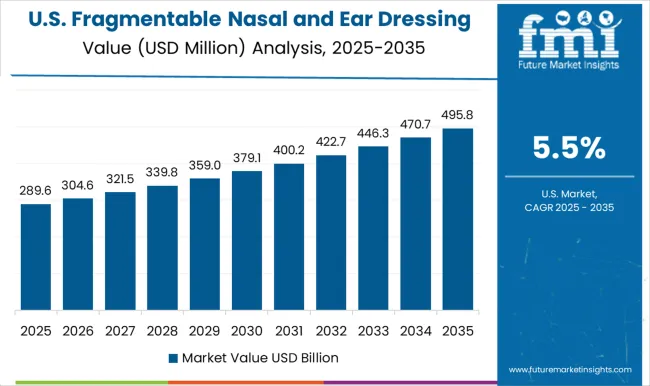
Analysis of Top Countries Enhancing Adoption of Fragmentable Nasal and Ear Dressings in Healthcare Settings

Why is the USA a Prominent Market for Fragmentable Nasal and Ear Dressing in North America region?

The USA occupies leading share in North America market contributing around USD 193.2 Million in 2022. The United States has one of the most significant and advanced healthcare markets globally.

With a vast network of healthcare facilities, hospitals, and clinics, there is a significant demand for various medical products, including dressings for nasal and ear injuries or surgical procedures.

Also, this country is known for its cutting-edge medical research and technological advancements. This environment fosters innovation, leading to the development of new and advanced medical products, including novel dressings for nasal and ear applications.

What Makes China a Highly Lucrative Market for Fragmentable Nasal and Ear Dressings?

China’s revenue generation on fragmentable nasal and ear dressing market in 2022 was USD 47.2 Million. The high population density, environmental factors, and lifestyle changes in China contribute to the prevalence of ear, nose, and throat (ENT) conditions.

The increased prevalence can lead to a considerable demand for medical products catering to these health issues.

Even, China has been investing heavily in its healthcare infrastructure, building new hospitals, clinics, and medical centers. The expansion of healthcare facilities further boosts the demand for medical products across the country.
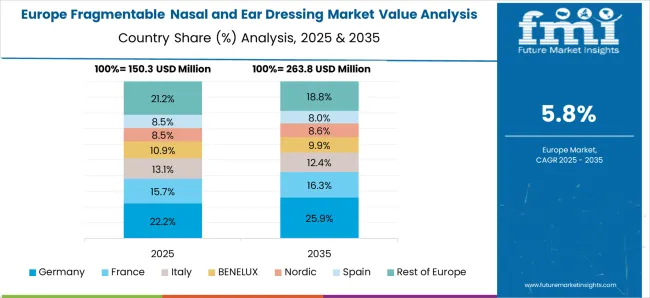
What Makes Germany a Large Market for Fragmentable Nasal and Ear Dressings?

In 2022, Germany held a dominant share in the Europe market and contributed around USD 33.7 Million. Germany is a leader in medical research and technology. The country is home to several innovative medical device manufacturers, and it is known for producing high-quality and advanced medical products.

Germany has a well-established and robust healthcare system, known for its high-quality medical care and accessibility. This creates a significant demand for various medical products, including dressings for nasal and ear injuries or surgical procedures.

Fragmentable Nasal and Ear Dressing Market Insights by Dressing Type and Application Category

Why Nasal Dressings are Preferred Majorly in Fragmentable Nasal and Ear Dressing Market?

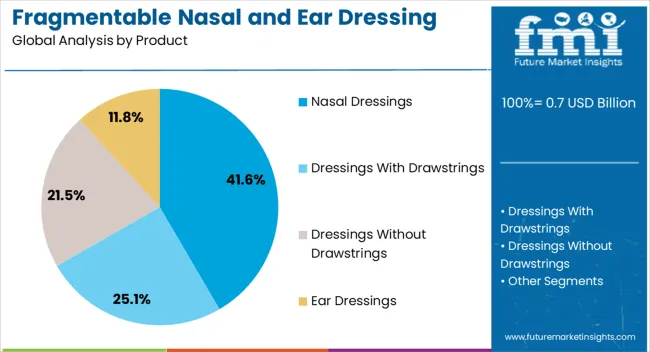
The market value of nasal dressings was around USD 525.6 Million in 2022, representing a sizable 95.5% global market share in 2022. Nasal injuries, such as nosebleeds or nasal fractures, are relatively common compared to ear injuries.

Also, there are numerous nasal surgical procedures, including functional endoscopic sinus surgery (FESS) and nasal septoplasty. The higher incidence of nasal issues and procedures results in a higher demand for nasal dressings.

Which Size of Fragmentable Nasal and Ear Dressings Garnered Significant Value Share in 2022?

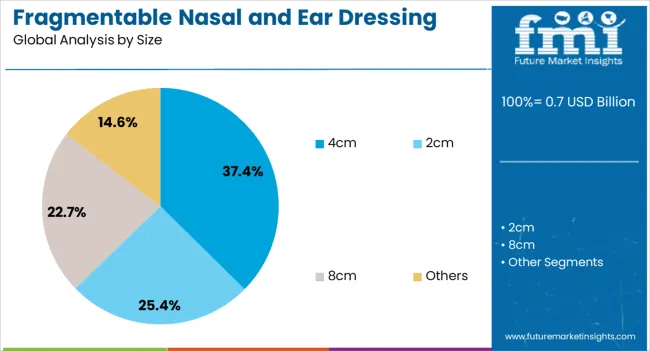
Others segment of fragmentable nasal and ear dressing market contributed about 38.8% market share in 2022 and is expected to grow with a CAGR of 8.7%.

The others segment includes the dressings that are more than 8 cm and less than 2 cm in size. Smaller sizes may be suitable for certain injuries or surgical sites, while larger sizes may be required for more extensive procedures.

The type and extent of the surgical procedure can influence the size of the dressing needed. Complex surgeries or larger wounds may necessitate larger dressings for adequate coverage and protection. This is why others segment dominate the market.

Which Shape is the Most Frequently Used in Fragmentable Nasal and Ear Dressing Market?

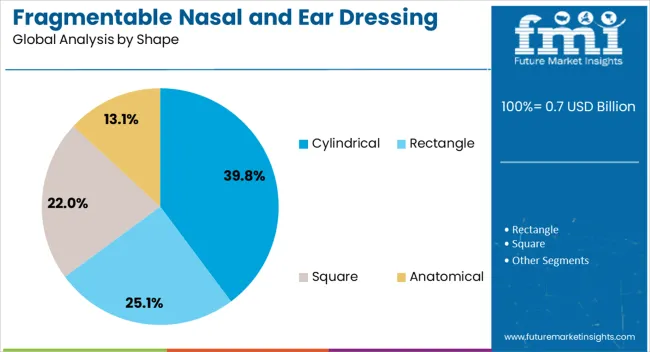
By shape, anatomical segment accounted for a predominant share of the global market, which was around 36.4% in 2022. Anatomically shaped dressings are designed to fit the contours of the nasal and ear areas more accurately. This results in enhanced comfort for patients, as the dressings are less likely to shift or cause discomfort during use.

Also, the pre-shaped design of these dressings can simplify the application process for healthcare providers, saving time and effort during the dressing change procedures.

Which Fragmentable Nasal and Ear Dressing Application Had a Significant Value Share in 2022?

Sinus surgery segment of fragmentable nasal and ear dressing market contributed 50.3% of the market share in 2022. As the number of sinus surgeries increases, it rises the demand for postoperative dressings that aid in wound healing, reduce inflammation, and prevent infections.

Sinus surgery can involve delicate and sensitive areas in the nasal and ear regions. Hence, there might be a growing need for specialized dressings designed to address the specific requirements of these surgical sites.

Which End User is Benefiting the Global Market?

The hospitals have a considerable presence in the fragmentable nasal and ear dressing market, accounted for 32.0% of the global market. Hospitals are significant consumers of medical products, including dressings for nasal and ear injuries. As the number of patients and medical procedures increases, the demand for such dressings also rises.

The medical procedures and surgeries that require specialized dressings for postoperative care is quite high in the hospitals therefore hospitals are a dominant segment. This can drive the need for more advanced and specific nasal and ear dressings.
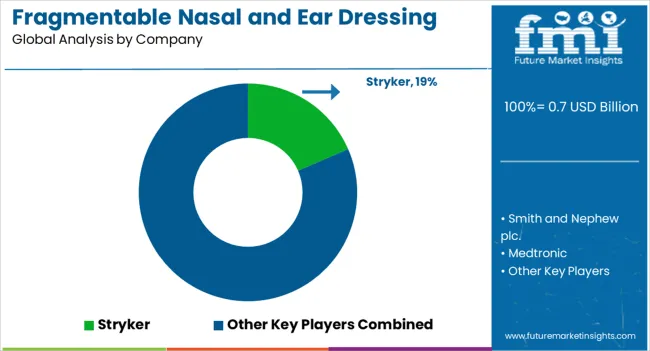
Competitive Landscape of the Fragmentable Nasal and Ear Dressing Industry – Leading Players and Strategic Initiatives

Major manufacturers work to expand the market for both their flagship products and the consumer solutions that they provide. For example, today's leading manufacturers frequently provide tailored solutions based on the requirements of various end users.

Due to the intense competition in the market, many leading competitors are putting a lot of effort into various market consolidation operations such merger, acquisition, supply distribution alliances, and the launch of new products.

Instances of important developmental strategies used among market participants in the fragmentable nasal and ear dressing market are presented below:

  • In May 2023, Medtronic disclosed that it had finalised the purchase of Intersect ENT, adding innovative devices used in sinus operations to enhance post-operative outcomes and treat the polyps in the nasal part, to the company's comprehensive ENT portfolio.
  • Stryker Corporation announced a binding merger agreement to buy Entellus Medical, Inc. in July 2017. Stryker's long-standing dedication to improving healthcare and Entellus' cutting-edge ENT products would continue to give clients the resources they require for affordable solutions.

Similarly, recent developments related to the company’s active within the fragmentable nasal and ear dressing market space have been tracked by the team at Future Market Insights, which are available in the full report.

Report Scope Based on Fragmentable Nasal and Ear Dressing Market Coverage and Research Focus

Attribute Details
Forecast Period 2023 to 2033
Historical Data Available for 2018 to 2022
Market Analysis USD Million for Value, Units for Volume
Key Regions Covered North America; Latin America; Europe; East Asia; South Asia; Middle East and Africa (MEA)
Key Countries Covered USA, Canada, Brazil, Mexico, Argentina, Germany, Italy, France, UK, Spain, BENELUX, Russia, India, Thailand, Indonesia, Malaysia, China, Japan, South Korea, Australia, New Zealand, GCC countries, Türkiye, Northern Africa and South Africa.
Key Market Segments Covered Product, Size, Shape, Application, End User and Region
Key Companies Profiled Stryker; Smith and Nephew plc; Medtronic; Pfizer Inc.; MP MEDITECH; Datt Mediproducts Private Limited; First Aid Bandage Company (FABCO); Summit Medical LLC (Innovia Medical); Olympus Corporation; Lohmann & Rauscher GmbH & Co. KG
Report Coverage Market Forecast, Competition Intelligence, DROT Analysis, Market Dynamics and Challenges, Strategic Growth Initiatives
Pricing Available upon Request

Key Market Segments Covered in the Fragmentable Nasal and Ear Dressing Industry Research by Product Type, End Use, and Region

By Product:

  • Nasal Dressings
  • Dressings With Drawstrings
  • Dressings Without Drawstrings
  • Ear Dressings

By Size:

  • 2cm
  • 4cm
  • 8cm
  • Others

By Shape:

  • Rectangle
  • Square
  • Cylindrical
  • Anatomical

By Application:

  • Sinus Surgery
  • Septorhinoplasty
  • Middle Ear Surgery

By End User:

  • Hospitals
  • Ambulatory Surgical Centers
  • ENT Clinics
  • Aesthetic Clinics

By Region:

  • North America
  • Latin America
  • Europe
  • South Asia
  • East Asia
  • Oceania
  • Middle East and Africa (MEA)

Table of Content

  • 1. Executive Summary
  • 2. Market Overview
  • 3. Key Market Trends
  • 4. Value Added Insights
  • 5. Market Background
  • 6. Global Market Volume (000’ Units) Analysis 2018 to 2022 and Forecast, 2023 to 2033
  • 7. Global Market - Pricing Analysis
  • 8. Global Market Demand (in Value or Size in USD Million) Analysis 2018 to 2022 and Forecast, 2023 to 2033
  • 9. Global Market Analysis 2018 to 2022 and Forecast 2023 to 2033, By Product
    • 9.1. Nasal Dressings
      • 9.1.1. Dressings with Drawstrings
      • 9.1.2. Dressings without Drawstrings
    • 9.2. Ear Dressings
  • 10. Global Market Analysis 2018 to 2022 and Forecast 2023 to 2033, By Size
    • 10.1. 2cm
    • 10.2. 4cm
    • 10.3. 8cm
    • 10.4. Others
  • 11. Global Market Analysis 2018 to 2022 and Forecast 2023 to 2033, By Shape
    • 11.1. Rectangle
    • 11.2. Square
    • 11.3. Cylindrical
    • 11.4. Anatomical
  • 12. Global Market Analysis 2018 to 2022 and Forecast 2023 to 2033, By Application
    • 12.1. Sinus Surgery
    • 12.2. Septorhinoplasty
    • 12.3. Middle Ear Surgery
  • 13. Global Market Analysis 2018 to 2022 and Forecast 2023 to 2033, By End User
    • 13.1. Hospitals
    • 13.2. Ambulatory Surgical Centers
    • 13.3. ENT Clinics
    • 13.4. Aesthetic Clinics
  • 14. Global Market Analysis 2018 to 2022 and Forecast 2023 to 2033, by Region
    • 14.1. North America
    • 14.2. Latin America
    • 14.3. Europe
    • 14.4. South Asia
    • 14.5. East Asia
    • 14.6. Oceania
    • 14.7. Middle East and Africa
  • 15. North America Market Analysis 2018 to 2022 and Forecast 2023 to 2033
  • 16. Latin America Market Analysis 2018 to 2022 and Forecast 2023 to 2033
  • 17. Europe Market Analysis 2018 to 2022 and Forecast 2023 to 2033
  • 18. East Asia Market Analysis 2018 to 2022 and Forecast 2023 to 2033
  • 19. South Asia Market Analysis 2018 to 2022 and Forecast 2023 to 2033
  • 20. Oceania Market Analysis 2018 to 2022 and Forecast 2023 to 2033
  • 21. Middle East and Africa Market Analysis 2018 to 2022 and Forecast 2023 to 2033
  • 22. Market Structure Analysis
  • 23. Competition Analysis
    • 23.1. Stryker
    • 23.2. Smith and Nephew plc.
    • 23.3. Medtronic
    • 23.4. Pfizer Inc.
    • 23.5. Hemostasis, LLC
    • 23.6. Datt Mediproducts Private Limited
    • 23.7. First Aid Bandage Company (FABCO)
    • 23.8. Summit Medical LLC (Innovia Medical)
    • 23.9. Olympus Corporation
    • 23.10. Lohmann & Rauscher GmbH & Co. KG
  • 24. Assumptions and Acronyms Used
  • 25. Research Methodology

List of Tables

Table 01A: Global Market Value (US$ Million) Analysis and Forecast 2018 to 2033, By Product

Table 01B: Global Market Volume (000’ Units) Analysis and Forecast 2018 to 2033, By Product

Table 02: Global Market Value (US$ Million) Analysis and Forecast 2018 to 2033, By Size

Table 03: Global Market Value (US$ Million) Analysis and Forecast 2018 to 2033, By Shape

Table 04: Global Market Value (US$ Million) Analysis and Forecast 2018 to 2033, By Application

Table 05: Global Market Value (US$ Million) Analysis and Forecast 2018 to 2033, by End User

Table 06: Global Market Value (US$ Million) Analysis and Forecast 2018 to 2033, by Region

Table 07: North America Market Value (US$ Million) Analysis 2018-2022 and Forecast 2023 to 2033, by Country

Table 08: North America Market Value (US$ Million) Analysis and Forecast 2018 to 2033, By Product

Table 09: North America Market Volume (000’ Units) Analysis and Forecast 2018 to 2033, By Product

Table 10: North America Market Value (US$ Million) Analysis and Forecast 2018 to 2033, By Size

Table 11: North America Market Value (US$ Million) Analysis and Forecast 2018 to 2033, By Shape

Table 12: North America Market Value (US$ Million) Analysis and Forecast 2018 to 2033, By Application

Table 13: North America Market Value (US$ Million) Analysis and Forecast 2018 to 2033, by End User

Table 14: Latin America Market Value (US$ Million) Analysis 2018-2022 and Forecast 2023 to 2033, by Country

Table 15: Latin America Market Value (US$ Million) Analysis and Forecast 2018 to 2033, By Product

Table 16: Latin America Market Volume (000’ Units) Analysis and Forecast 2018 to 2033, By Product

Table 17: Latin America Market Value (US$ Million) Analysis and Forecast 2018 to 2033, By Size

Table 18: Latin America Market Value (US$ Million) Analysis and Forecast 2018 to 2033, By Shape

Table 19: Latin America Market Value (US$ Million) Analysis and Forecast 2018 to 2033, By Application

Table 20: Latin America Market Value (US$ Million) Analysis and Forecast 2018 to 2033, by End User

Table 21: Europe Market Value (US$ Million) Analysis 2018-2022 and Forecast 2023 to 2033, by Country

Table 22: Europe Market Value (US$ Million) Analysis and Forecast 2018 to 2033, By Product

Table 23: Europe Market Volume (000’ Units) Analysis and Forecast 2018 to 2033, By Product

Table 24: Europe Market Value (US$ Million) Analysis and Forecast 2018 to 2033, By Size

Table 25: Europe Market Value (US$ Million) Analysis and Forecast 2018 to 2033, By Shape

Table 26: Europe Market Value (US$ Million) Analysis and Forecast 2018 to 2033, By Application

Table 27: Europe Market Value (US$ Million) Analysis and Forecast 2018 to 2033, by End User

Table 28: East Asia Market Value (US$ Million) Analysis 2018-2022 and Forecast 2023 to 2033, by Country

Table 29: East Asia Market Value (US$ Million) Analysis and Forecast 2018 to 2033, By Product

Table 30: East Asia Market Volume (000’ Units) Analysis and Forecast 2018 to 2033, By Product

Table 31: East Asia Market Value (US$ Million) Analysis and Forecast 2018 to 2033, By Size

Table 32: East Asia Market Value (US$ Million) Analysis and Forecast 2018 to 2033, By Shape

Table 33: East Asia Market Value (US$ Million) Analysis and Forecast 2018 to 2033, By Application

Table 34: East Asia Market Value (US$ Million) Analysis and Forecast 2018 to 2033, by End User

Table 35: South Asia Market Value (US$ Million) Analysis 2018-2022 and Forecast 2023 to 2033, by Country

Table 36: South Asia Market Value (US$ Million) Analysis and Forecast 2018 to 2033, By Product

Table 37: South Asia Market Volume (000’ Units) Analysis and Forecast 2018 to 2033, By Product

Table 38: South Asia Market Value (US$ Million) Analysis and Forecast 2018 to 2033, By Size

Table 39: South Asia Market Value (US$ Million) Analysis and Forecast 2018 to 2033, By Shape

Table 40: South Asia Market Value (US$ Million) Analysis and Forecast 2018 to 2033, By Application

Table 41: South Asia Market Value (US$ Million) Analysis and Forecast 2018 to 2033, by End User

Table 42: Oceania Market Value (US$ Million) Analysis 2018-2022 and Forecast 2023 to 2033, by Country

Table 43: Oceania Market Value (US$ Million) Analysis and Forecast 2018 to 2033, By Product

Table 44: Oceania Market Volume (000’ Units) Analysis and Forecast 2018 to 2033, By Product

Table 45: Oceania Market Value (US$ Million) Analysis and Forecast 2018 to 2033, By Size

Table 46: Oceania Market Value (US$ Million) Analysis and Forecast 2018 to 2033, By Shape

Table 47: Oceania Market Value (US$ Million) Analysis and Forecast 2018 to 2033, By Application

Table 48: Oceania Market Value (US$ Million) Analysis and Forecast 2018 to 2033, by End User

Table 49: Middle East and Africa Market Value (US$ Million) Analysis 2018-2022 and Forecast 2023 to 2033, by Country

Table 50: Middle East and Africa Market Value (US$ Million) Analysis and Forecast 2018 to 2033, By Product

Table 51: Middle East and Africa Market Volume (000’ Units) Analysis and Forecast 2018 to 2033, By Product

Table 52: Middle East and Africa Market Value (US$ Million) Analysis and Forecast 2018 to 2033, By Size

Table 53: Middle East and Africa Market Value (US$ Million) Analysis and Forecast 2018 to 2033, By Shape

Table 54: Middle East and Africa Market Value (US$ Million) Analysis and Forecast 2018 to 2033, By Application

Table 55: Middle East and Africa Market Value (US$ Million) Analysis and Forecast 2018 to 2033, by End User

List of Figures

Figure 01: Global Market Volume (000’ Units), 2018 to 2022

Figure 02: Global Market Volume (000’ Units) & Y-o-Y Growth (%) Analysis, 2023 to 2033

Figure 03: Nasal Dressing with Drawstring, Pricing Analysis per unit (US$), in 2022

Figure 04: Nasal Dressing without Drawstring, Pricing Forecast per unit (US$), in 2022

Figure 05: Global Market Value (US$ Million) Analysis, 2018 to 2022

Figure 06: Global Market Forecast & Y-o-Y Growth, 2023 to 2033

Figure 07: Global Market Absolute $ Opportunity (US$ Million) Analysis, 2023 to 2033

Figure 08: Global Market Value Share (%) Analysis 2023 and 2033, By Product

Figure 09: Global Market Y-o-Y Growth (%) Analysis 2022-2033, By Product

Figure 10: Global Market Attractiveness Analysis 2023 to 2033, By Product

Figure 11: Global Market Value Share (%) Analysis 2023 and 2033, By Size

Figure 12: Global Market Y-o-Y Growth (%) Analysis 2022-2033, By Size

Figure 13: Global Market Attractiveness Analysis 2023 to 2033, By Size

Figure 14: Global Market Value Share (%) Analysis 2023 and 2033, By Shape

Figure 15: Global Market Y-o-Y Growth (%) Analysis 2022-2033, By Shape

Figure 16: Global Market Attractiveness Analysis 2023 to 2033, By Shape

Figure 17: Global Market Value Share (%) Analysis 2023 and 2033, By Application

Figure 18: Global Market Y-o-Y Growth (%) Analysis 2022-2033, By Application

Figure 19: Global Market Attractiveness Analysis 2023 to 2033, By Application

Figure 20: Global Market Value Share (%) Analysis 2023 and 2033, by End User

Figure 21: Global Market Y-o-Y Growth (%) Analysis 2022-2033, by End User

Figure 22: Global Market Attractiveness Analysis 2023 to 2033, by End User

Figure 23: Global Market Value Share (%) Analysis 2023 and 2033, by Region

Figure 24: Global Market Y-o-Y Growth (%) Analysis 2022-2033, by Region

Figure 25: Global Market Attractiveness Analysis 2023 to 2033, by Region

Figure 26: North America Market Value (US$ Million) Analysis, 2018 to 2022

Figure 27: North America Market Value (US$ Million) Forecast, 2023-2033

Figure 28: North America Market Value Share, By Product (2023 E)

Figure 29: North America Market Value Share, By Size (2023 E)

Figure 30: North America Market Value Share, By Shape (2023 E)

Figure 31: North America Market Value Share, By Application (2023 E)

Figure 32: North America Market Value Share, by End User (2023 E)

Figure 33: North America Market Value Share, by Country (2023 E)

Figure 34: North America Market Attractiveness Analysis By Product, 2023 to 2033

Figure 35: North America Market Attractiveness Analysis By Size, 2023 to 2033

Figure 36: North America Market Attractiveness Analysis By Shape, 2023 to 2033

Figure 37: North America Market Attractiveness Analysis By Application, 2023 to 2033

Figure 38: North America Market Attractiveness Analysis by End User, 2023 to 2033

Figure 39: North America Market Attractiveness Analysis by Country, 2023 to 2033

Figure 40: USA Market Value Proportion Analysis, 2022

Figure 41: Global Vs. USA Growth Comparison

Figure 42: USA Market Share Analysis (%) By Product, 2023 & 2033

Figure 43: USA Market Share Analysis (%) By Size, 2023 & 2033

Figure 44: USA Market Share Analysis (%) By Shape, 2023 & 2033

Figure 45: USA Market Share Analysis (%) By Application, 2023 & 2033

Figure 46: USA Market Share Analysis (%) by End User, 2023 & 2033

Figure 47: Canada Market Value Proportion Analysis, 2022

Figure 48: Global Vs. Canada. Growth Comparison

Figure 49: Canada Market Share Analysis (%) By Product, 2023 & 2033

Figure 50: Canada Market Share Analysis (%) By Size, 2023 & 2033

Figure 51: Canada Market Share Analysis (%) By Shape, 2023 & 2033

Figure 52: Canada Market Share Analysis (%) By Application, 2023 & 2033

Figure 53: Canada Market Share Analysis (%) by End User, 2023 & 2033

Figure 54: Latin America Market Value (US$ Million) Analysis, 2018 to 2022

Figure 55: Latin America Market Value (US$ Million) Forecast, 2023-2033

Figure 56: Latin America Market Value Share, By Product (2023 E)

Figure 57: Latin America Market Value Share, By Size (2023 E)

Figure 58: Latin America Market Value Share, By Shape (2023 E)

Figure 59: Latin America Market Value Share, By Application (2023 E)

Figure 60: Latin America Market Value Share, by End User (2023 E)

Figure 61: Latin America Market Value Share, by Country (2023 E)

Figure 62: Latin America Market Attractiveness Analysis By Product, 2023 to 2033

Figure 63: Latin America Market Attractiveness Analysis By Size, 2023 to 2033

Figure 64: Latin America Market Attractiveness Analysis By Shape, 2023 to 2033

Figure 65: Latin America Market Attractiveness Analysis By Application, 2023 to 2033

Figure 66: Latin America Market Attractiveness Analysis by End User, 2023 to 2033

Figure 67: Latin America Market Attractiveness Analysis by Country, 2023 to 2033

Figure 68: Brazil Market Value Proportion Analysis, 2022

Figure 69: Global Vs. Brazil. Growth Comparison

Figure 70: Brazil Market Share Analysis (%) By Product, 2023 & 2033

Figure 71: Brazil Market Share Analysis (%) By Size, 2023 & 2033

Figure 72: Brazil Market Share Analysis (%) By Shape, 2023 & 2033

Figure 73: Brazil Market Share Analysis (%) By Application, 2023 & 2033

Figure 74: Brazil Market Share Analysis (%) by End User, 2023 & 2033

Figure 75: Mexico Market Value Proportion Analysis, 2022

Figure 76: Global Vs Mexico Growth Comparison

Figure 77: Mexico Market Share Analysis (%) By Product, 2023 & 2033

Figure 78: Mexico Market Share Analysis (%) By Size, 2023 & 2033

Figure 79: Mexico Market Share Analysis (%) By Shape, 2023 & 2033

Figure 80: Mexico Market Share Analysis (%) By Application, 2023 & 2033

Figure 81: Mexico Market Share Analysis (%) by End User, 2023 & 2033

Figure 82: Argentina Market Value Proportion Analysis, 2022

Figure 83: Global Vs Argentina Growth Comparison

Figure 84: Argentina Market Share Analysis (%) By Product, 2023 & 2033

Figure 85: Argentina Market Share Analysis (%) By Size, 2023 & 2033

Figure 86: Argentina Market Share Analysis (%) By Shape, 2023 & 2033

Figure 87: Argentina Market Share Analysis (%) By Application, 2023 & 2033

Figure 88: Argentina Market Share Analysis (%) by End User, 2023 & 2033

Figure 89: Europe Market Value (US$ Million) Analysis, 2018 to 2022

Figure 90: Europe Market Value (US$ Million) Forecast, 2023-2033

Figure 91: Europe Market Value Share, By Product (2023 E)

Figure 92: Europe Market Value Share, By Size (2023 E)

Figure 93: Europe Market Value Share, By Shape (2023 E)

Figure 94: Europe Market Value Share, By Application (2023 E)

Figure 95: Europe Market Value Share, by End User (2023 E)

Figure 96: Europe Market Value Share, by Country (2023 E)

Figure 97: Europe Market Attractiveness Analysis By Product, 2023 to 2033

Figure 98: Europe Market Attractiveness Analysis By Size, 2023 to 2033

Figure 99: Europe Market Attractiveness Analysis By Shape, 2023 to 2033

Figure 100: Europe Market Attractiveness Analysis By Application, 2023 to 2033

Figure 101: Europe Market Attractiveness Analysis by End User, 2023 to 2033

Figure 102: Europe Market Attractiveness Analysis by Country, 2023 to 2033

Figure 103: UK Market Value Proportion Analysis, 2022

Figure 104: Global Vs. UK Growth Comparison

Figure 105: UK Market Share Analysis (%) By Product, 2023 & 2033

Figure 106: UK Market Share Analysis (%) By Size, 2023 & 2033

Figure 107: UK Market Share Analysis (%) By Shape, 2023 & 2033

Figure 108: UK Market Share Analysis (%) By Application, 2023 & 2033

Figure 109: UK Market Share Analysis (%) by End User, 2023 & 2033

Figure 110: Germany Market Value Proportion Analysis, 2022

Figure 111: Global Vs. Germany Growth Comparison

Figure 112: Germany Market Share Analysis (%) By Product, 2023 & 2033

Figure 113: Germany Market Share Analysis (%) By Size, 2023 & 2033

Figure 114: Germany Market Share Analysis (%) By Shape, 2023 & 2033

Figure 115: Germany Market Share Analysis (%) By Application, 2023 & 2033

Figure 116: Germany Market Share Analysis (%) by End User, 2023 & 2033

Figure 117: Italy Market Value Proportion Analysis, 2022

Figure 118: Global Vs. Italy Growth Comparison

Figure 119: Italy Market Share Analysis (%) By Product, 2023 & 2033

Figure 120: Italy Market Share Analysis (%) By Size, 2023 & 2033

Figure 121: Italy Market Share Analysis (%) By Shape, 2023 & 2033

Figure 122: Italy Market Share Analysis (%) By Application, 2023 & 2033

Figure 123: Italy Market Share Analysis (%) by End User, 2023 & 2033

Figure 124: France Market Value Proportion Analysis, 2022

Figure 125: Global Vs France Growth Comparison

Figure 126: France Market Share Analysis (%) By Product, 2023 & 2033

Figure 127: France Market Share Analysis (%) By Size, 2023 & 2033

Figure 128: France Market Share Analysis (%) By Shape, 2023 & 2033

Figure 129: France Market Share Analysis (%) By Application, 2023 & 2033

Figure 130: France Market Share Analysis (%) by End User, 2023 & 2033

Figure 131: Spain Market Value Proportion Analysis, 2022

Figure 132: Global Vs Spain Growth Comparison

Figure 133: Spain Market Share Analysis (%) By Product, 2023 & 2033

Figure 134: Spain Market Share Analysis (%) By Size, 2023 & 2033

Figure 135: Spain Market Share Analysis (%) By Shape, 2023 & 2033

Figure 136: Spain Market Share Analysis (%) By Application, 2023 & 2033

Figure 137: Spain Market Share Analysis (%) by End User, 2023 & 2033

Figure 138: Russia Market Value Proportion Analysis, 2022

Figure 139: Global Vs Russia Growth Comparison

Figure 140: Russia Market Share Analysis (%) By Product, 2023 & 2033

Figure 141: Russia Market Share Analysis (%) By Size, 2023 & 2033

Figure 142: Russia Market Share Analysis (%) By Shape, 2023 & 2033

Figure 143: Russia Market Share Analysis (%) By Application, 2023 & 2033

Figure 144: Russia Market Share Analysis (%) by End User, 2023 & 2033

Figure 145: BENELUX Market Value Proportion Analysis, 2022

Figure 146: Global Vs BENELUX Growth Comparison

Figure 147: BENELUX Market Share Analysis (%) By Product, 2023 & 2033

Figure 148: BENELUX Market Share Analysis (%) By Size, 2023 & 2033

Figure 149: BENELUX Market Share Analysis (%) By Shape, 2023 & 2033

Figure 150: BENELUX Market Share Analysis (%) By Application, 2023 & 2033

Figure 151: BENELUX Market Share Analysis (%) by End User, 2023 & 2033

Figure 152: East Asia Market Value (US$ Million) Analysis, 2018 to 2022

Figure 153: East Asia Market Value (US$ Million) Forecast, 2023-2033

Figure 154: East Asia Market Value Share, By Product (2023 E)

Figure 155: East Asia Market Value Share, By Size (2023 E)

Figure 156: East Asia Market Value Share, By Shape (2023 E)

Figure 157: East Asia Market Value Share, By Application (2023 E)

Figure 158: East Asia Market Value Share, by End User (2023 E)

Figure 159: East Asia Market Value Share, by Country (2023 E)

Figure 160: East Asia Market Attractiveness Analysis By Product, 2023 to 2033

Figure 161: East Asia Market Attractiveness Analysis By Size, 2023 to 2033

Figure 162: East Asia Market Attractiveness Analysis By Shape, 2023 to 2033

Figure 163: East Asia Market Attractiveness Analysis By Application, 2023 to 2033

Figure 164: East Asia Market Attractiveness Analysis by End User, 2023 to 2033

Figure 165: East Asia Market Attractiveness Analysis by Country, 2023 to 2033

Figure 166: China Market Value Proportion Analysis, 2022

Figure 167: Global Vs. China Growth Comparison

Figure 168: China Market Share Analysis (%) By Product, 2023 & 2033

Figure 169: China Market Share Analysis (%) By Size, 2023 & 2033

Figure 170: China Market Share Analysis (%) By Shape, 2023 & 2033

Figure 171: China Market Share Analysis (%) By Application, 2023 & 2033

Figure 172: China Market Share Analysis (%) by End User, 2023 & 2033

Figure 173: Japan Market Value Proportion Analysis, 2022

Figure 174: Global Vs. Japan Growth Comparison

Figure 175: Japan Market Share Analysis (%) By Product, 2023 & 2033

Figure 176: Japan Market Share Analysis (%) By Size, 2023 & 2033

Figure 177: Japan Market Share Analysis (%) By Shape, 2023 & 2033

Figure 178: Japan Market Share Analysis (%) By Application, 2023 & 2033

Figure 179: Japan Market Share Analysis (%) by End User, 2023 & 2033

Figure 180: South Korea Market Value Proportion Analysis, 2022

Figure 181: Global Vs South Korea Growth Comparison

Figure 182: South Korea Market Share Analysis (%) By Product, 2023 & 2033

Figure 183: South Korea Market Share Analysis (%) By Size, 2023 & 2033

Figure 184: South Korea Market Share Analysis (%) By Shape, 2023 & 2033

Figure 185: South Korea Market Share Analysis (%) By Application, 2023 & 2033

Figure 186: South Korea Market Share Analysis (%) by End User, 2023 & 2033

Figure 187: South Asia Market Value (US$ Million) Analysis, 2018 to 2022

Figure 188: South Asia Market Value (US$ Million) Forecast, 2023-2033

Figure 189: South Asia Market Value Share, By Product (2023 E)

Figure 190: South Asia Market Value Share, By Size (2023 E)

Figure 191: South Asia Market Value Share, By Shape (2023 E)

Figure 192: South Asia Market Value Share, By Application (2023 E)

Figure 193: South Asia Market Value Share, by End User (2023 E)

Figure 194: South Asia Market Value Share, by Country (2023 E)

Figure 195: South Asia Market Attractiveness Analysis By Product, 2023 to 2033

Figure 196: South Asia Market Attractiveness Analysis By Size, 2023 to 2033

Figure 197: South Asia Market Attractiveness Analysis By Shape, 2023 to 2033

Figure 198: South Asia Market Attractiveness Analysis By Application, 2023 to 2033

Figure 199: South Asia Market Attractiveness Analysis by End User, 2023 to 2033

Figure 200: South Asia Market Attractiveness Analysis by Country, 2023 to 2033

Figure 201: India Market Value Proportion Analysis, 2022

Figure 202: Global Vs. India Growth Comparison

Figure 203: India Market Share Analysis (%) By Product, 2023 & 2033

Figure 204: India Market Share Analysis (%) By Size, 2023 & 2033

Figure 205: India Market Share Analysis (%) By Shape, 2023 & 2033

Figure 206: India Market Share Analysis (%) By Application, 2023 & 2033

Figure 207: India Market Share Analysis (%) by End User, 2023 & 2033

Figure 208: Indonesia Market Value Proportion Analysis, 2022

Figure 209: Global Vs. Indonesia Growth Comparison

Figure 210: Indonesia Market Share Analysis (%) By Product, 2023 & 2033

Figure 211: Indonesia Market Share Analysis (%) By Size, 2023 & 2033

Figure 212: Indonesia Market Share Analysis (%) By Shape, 2023 & 2033

Figure 213: Indonesia Market Share Analysis (%) By Application, 2023 & 2033

Figure 214: Indonesia Market Share Analysis (%) by End User, 2023 & 2033

Figure 215: Malaysia Market Value Proportion Analysis, 2022

Figure 216: Global Vs. Malaysia Growth Comparison

Figure 217: Malaysia Market Share Analysis (%) By Product, 2023 & 2033

Figure 218: Malaysia Market Share Analysis (%) By Size, 2023 & 2033

Figure 219: Malaysia Market Share Analysis (%) By Shape, 2023 & 2033

Figure 220: Malaysia Market Share Analysis (%) By Application, 2023 & 2033

Figure 221: Malaysia Market Share Analysis (%) by End User, 2023 & 2033

Figure 222: Thailand Market Value Proportion Analysis, 2022

Figure 223: Global Vs. Thailand Growth Comparison

Figure 224: Thailand Market Share Analysis (%) By Product, 2023 & 2033

Figure 225: Thailand Market Share Analysis (%) By Size, 2023 & 2033

Figure 226: Thailand Market Share Analysis (%) By Shape, 2023 & 2033

Figure 227: Thailand Market Share Analysis (%) By Application, 2023 & 2033

Figure 228: Thailand Market Share Analysis (%) by End User, 2023 & 2033

Figure 229: Oceania Market Value (US$ Million) Analysis, 2018 to 2022

Figure 230: Oceania Market Value (US$ Million) Forecast, 2023-2033

Figure 231: Oceania Market Value Share, By Product (2023 E)

Figure 232: Oceania Market Value Share, By Size (2023 E)

Figure 233: Oceania Market Value Share, By Shape (2023 E)

Figure 234: Oceania Market Value Share, By Application (2023 E)

Figure 235: Oceania Market Value Share, by End User (2023 E)

Figure 236: Oceania Market Value Share, by Country (2023 E)

Figure 237: Oceania Market Attractiveness Analysis By Product, 2023 to 2033

Figure 238: Oceania Market Attractiveness Analysis By Size, 2023 to 2033

Figure 239: Oceania Market Attractiveness Analysis By Shape, 2023 to 2033

Figure 240: Oceania Market Attractiveness Analysis By Application, 2023 to 2033

Figure 241: Oceania Market Attractiveness Analysis by End User, 2023 to 2033

Figure 242: Oceania Market Attractiveness Analysis by Country, 2023 to 2033

Figure 243: Australia Market Value Proportion Analysis, 2022

Figure 244: Global Vs. Australia Growth Comparison

Figure 245: Australia Market Share Analysis (%) By Product, 2023 & 2033

Figure 246: Australia Market Share Analysis (%) By Size, 2023 & 2033

Figure 247: Australia Market Share Analysis (%) By Shape, 2023 & 2033

Figure 248: Australia Market Share Analysis (%) By Application, 2023 & 2033

Figure 249: Australia Market Share Analysis (%) by End User, 2023 & 2033

Figure 250: New Zealand Market Value Proportion Analysis, 2022

Figure 251: Global Vs New Zealand Growth Comparison

Figure 252: New Zealand Market Share Analysis (%) By Product, 2023 & 2033

Figure 253: New Zealand Market Share Analysis (%) By Size, 2023 & 2033

Figure 254: New Zealand Market Share Analysis (%) By Shape, 2023 & 2033

Figure 255: New Zealand Market Share Analysis (%) By Application, 2023 & 2033

Figure 256: New Zealand Market Share Analysis (%) by End User, 2023 & 2033

Figure 257: Middle East & Africa Market Value (US$ Million) Analysis, 2018 to 2022

Figure 258: Middle East & Africa Market Value (US$ Million) Forecast, 2023-2033

Figure 259: Middle East & Africa Market Value Share, By Product (2023 E)

Figure 260: Middle East & Africa Market Value Share, By Size (2023 E)

Figure 261: Middle East & Africa Market Value Share, By Shape (2023 E)

Figure 262: Middle East & Africa Market Value Share, By Application (2023 E)

Figure 263: Middle East & Africa Market Value Share, by End User (2023 E)

Figure 264: Middle East & Africa Market Value Share, by Country (2023 E)

Figure 265: Middle East & Africa Market Attractiveness Analysis By Product, 2023 to 2033

Figure 266: Middle East & Africa Market Attractiveness Analysis By Size, 2023 to 2033

Figure 267: Middle East & Africa Market Attractiveness Analysis By Shape, 2023 to 2033

Figure 268: Middle East & Africa Market Attractiveness Analysis By Application, 2023 to 2033

Figure 269: Middle East & Africa Market Attractiveness Analysis by End User, 2023 to 2033

Figure 270: Middle East & Africa Market Attractiveness Analysis by Country, 2023 to 2033

Figure 271: GCC Countries Market Value Proportion Analysis, 2022

Figure 272: Global Vs GCC Countries Growth Comparison

Figure 273: GCC Countries Market Share Analysis (%) By Product, 2023 & 2033

Figure 274: GCC Countries Market Share Analysis (%) By Size, 2023 & 2033

Figure 275: GCC Countries Market Share Analysis (%) By Shape, 2023 & 2033

Figure 276: GCC Countries Market Share Analysis (%) By Application, 2023 & 2033

Figure 277: GCC Countries Market Share Analysis (%) by End User, 2023 & 2033

Figure 278: Türkiye Market Value Proportion Analysis, 2022

Figure 279: Global Vs. Türkiye Growth Comparison

Figure 280: Türkiye Market Share Analysis (%) By Product, 2023 & 2033

Figure 281: Türkiye Market Share Analysis (%) By Size, 2023 & 2033

Figure 282: Türkiye Market Share Analysis (%) By Shape, 2023 & 2033

Figure 283: Türkiye Market Share Analysis (%) By Application, 2023 & 2033

Figure 284: Türkiye Market Share Analysis (%) by End User, 2023 & 2033

Figure 285: South Africa Market Value Proportion Analysis, 2022

Figure 286: Global Vs. South Africa Growth Comparison

Figure 287: South Africa Market Share Analysis (%) By Product, 2023 & 2033

Figure 288: South Africa Market Share Analysis (%) By Size, 2023 & 2033

Figure 289: South Africa Market Share Analysis (%) By Shape, 2023 & 2033

Figure 290: South Africa Market Share Analysis (%) By Application, 2023 & 2033

Figure 291: South Africa Market Share Analysis (%) by End User, 2023 & 2033

Figure 292: Northern Africa Market Value Proportion Analysis, 2022

Figure 293: Global Vs Northern Africa Growth Comparison

Figure 294: Northern Africa Market Share Analysis (%) By Product, 2023 & 2033

Figure 295: Northern Africa Market Share Analysis (%) By Size, 2023 & 2033

Figure 296: Northern Africa Market Share Analysis (%) By Shape, 2023 & 2033

Figure 297: Northern Africa Market Share Analysis (%) By Application, 2023 & 2033

Figure 298: Northern Africa Market Share Analysis (%) by End User, 2023 & 2033

Frequently Asked Questions

What is the Most Notable Reason for Growing Demand for Motor Generator Sets?

The growing requirement for a reliable energy supply is the main reason.

What is the Current Size of the Fragmentable Nasal and Ear Dressing Market?

The market is expected to secure a valuation of USD 585.8 million in 2023.

What will be the Growth Rate for the Global Fragmentable Nasal and Ear Dressing Market?

The global market is predicted to expand at an impressive 6.5% CAGR until 2033.

Which Region has a Big Share in the Global Fragmentable Nasal and Ear Dressing Market?

The United States market value was valued at USD 193.2 million in 2022.

What is Driving China’s Fragmentable Nasal and Ear Dressing Market?

Heavy investment in healthcare infrastructure is estimated to drive China’s market

Explore Therapeutic Device Insights

Future Market Insights

Fragmentable Nasal and Ear Dressing Market