Nasal Congestion Treatment Devices Market Size and Share Forecast Outlook 2025 to 2035

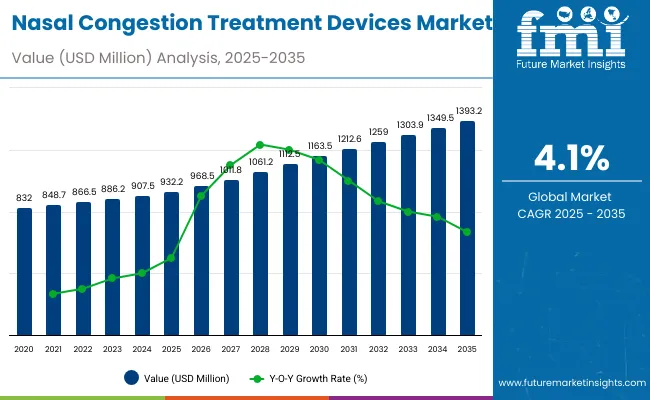
The global nasal congestion treatment devices market is projected to reach a valuation of USD 932.2 million by 2025 and USD 1,393.2 million by 2035. This indicates a decade-long increase of USD 461.0 million between 2025 and 2035. The market is expected to expand at a compound annual growth rate (CAGR) of 4.1%, representing a 1.49X increase over the ten-year period.
Quick Stats for Nasal Congestion Treatment Devices Market

  • Industry Value (2025): USD 932.2 million
  • Forecast Value (2035): USD 1,393.2 million
  • Forecast CAGR: 4.1%
  • Leading Segment in 2025 (Dosage Type): Sprays (55.2% market share)
  • Key Growth Region:Asia Pacific and Europe
  • Top Key Players: GlaxoSmithKline (GSK), Pfizer, Teva, Bayer, Johnson & Johnson, NeilMed, Naväge

Nasal Congestion Treatment Devices Market

Metric Value
Industry Size (2025E) USD 932.2 million
Industry Value (2035F) USD 1,393.2 million
CAGR (2025 to 2035) 4.1%

During the first five-year period from 2025 to 2030, the total market value is projected to expand from USD 932.2 million to USD 1,163.5 million, adding USD 231.3million which contributes50.2% of the total decade growth. Sprays segment will remain dominant holding around 55.0% share of the category by 2030 due to strong consumer preference for multi-dose OTC formulations and ease of retail access. Drops & Liquids will account for nearly 18.0% share by 2030, while powders and dry-powder devices will remain niche.

The second half from 2030 to 2035 contributes USD 229.7million, equal to 49.8% of the total growth, as the market jumps from USD 1,163.5 million to USD 1,393.2 million. This acceleration is powered by rising digital distribution and stronger adoption in emerging markets such as China and India.

Sprays and Drops & Liquids together capture a large share of above 72% by the end of the decade. Powders and dry-powder devices are likely to expand steadily to around 6.5% share, reflecting consumer openness to alternative delivery formats.

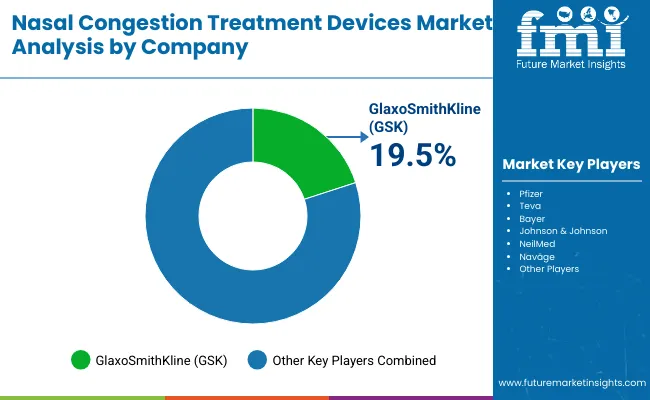
From 2020 to 2024, the overall Nasal Congestion Treatment Devices Market grew from USD 832.0 million to USD 905.7 million. Leading players such as GlaxoSmithKline (GSK), Pfizer, Teva, Bayer, Johnson & Johnson, NeilMed, and Naväge together account for a significant share of global revenues, with GSK alone holding 19.5% market share in 2024. Key strategies deployed by these companies include expanding OTC spray portfolios, introducing consumer-friendly nasal irrigation systems, and leveraging direct-to-consumer distribution channels, including online pharmacies and retail partnerships.

In 2025, the Nasal Congestion Treatment Devices Market is expected to reach a value of approximately USD 932.2 million, driven by sustained dominance of spray-based formulations and the rising adoption of multi-dose systems.

Growth will be propelled by consumer demand for quick-acting, non-prescription solutions for allergic rhinitis and chronic sinusitis, alongside the growing role of e-commerce channels, which are projected to account for over 20% of distribution share by 2025. Manufacturers are increasingly investing in ergonomically designed applicators, advanced powder-delivery devices, and refillable multi-dose sprays to enhance usability and compliance. In addition, heightened awareness of drug-free options such as irrigation devices and powered aspirators is creating incremental opportunities, especially in pediatric and home-care segments.

Why Is This Market Growing?

The Nasal Congestion Treatment Devices Market is seeing strong growth because consumers worldwide face rising prevalence of allergic rhinitis, sinusitis, and upper respiratory infections. Major drivers include the growing demand for quick-relief, non-prescription therapies, wider awareness of self-care, and expansion of e-commerce channels that make devices easily accessible. Innovations such as multi-dose spray systems with ergonomic nozzles, advanced dry-powder devices, and powered nasal irrigation kits are enhancing compliance, reducing symptom recurrence, and providing measurable improvement in patient quality of life.

The pandemic amplified the need for drug-free, at-home respiratory relief solutions, accelerating adoption of nasal irrigation systems and OTC sprays. As household budgets prioritize affordable and convenient healthcare, manufacturers who deliver user-friendly formats, hygienic delivery mechanisms, and digitally enabled distribution are achieving robust sales. In countries with expanding middle-class populations particularly in Asia Pacific markets such as China and India rising consumer health awareness and modern retail infrastructure are further boosting demand.

Segmental Analysis

The market is segmented by dosage type, dose configuration, distribution channel, and region. Dosage type includes Sprays, Drops & Liquids, Gels, Powders/Dry-powder devices, and Others, highlighting the primary formats preferred by patients for nasal congestion relief. Based on dose configuration, the segmentation covers Multi-dose systems, Bi-dose systems, and Unit-dose (single-use) systems, reflecting consumer choice between refillable, dual, and single-use delivery mechanisms.

Distribution channels encompass Retail Pharmacies, Online Pharmacies/E-commerce, Hospital Pharmacies, and Others, representing the mix of traditional and digital pathways through which devices reach end users. Regionally, the scope spans North America, Latin America, Western and Eastern Europe, East Asia, South Asia and Pacific, and the Middle East and Africa.
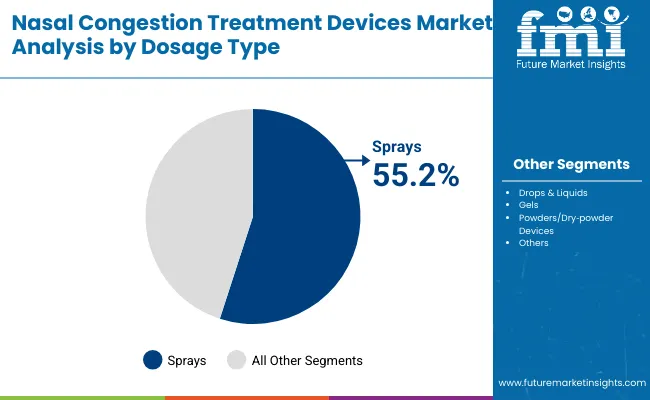
Insights into the Product Segment with Sprays Leading in Market Share

Nasal Congestion Treatment Devices Market By Dosage

By Dosage Type Market Share (%)
Sprays 55.2%
Drops & Liquids 18.6%
Gels 6.9%
Powders / Dry powder devices 4.7%
Others 14.6%

Sprays are expected to retain a dominant position, contributing 55.2% in 2025, owing to their convenience, rapid action, and widespread availability across retail and online channels. Their adoption has been driven by the rising global incidence of allergic rhinitis and sinusitis, coupled with consumer preference for non-invasive, easy-to-use formulations.

Preference has been increasingly shown for multi-dose spray systems due to their cost-effectiveness, portability, and ability to provide consistent dosing across extended use. Market penetration has also been supported by leading pharmaceutical companies expanding OTC nasal spray portfolios under trusted brand names. These factors have collectively contributed to the sustained demand for sprays over alternative dosage formats such as gels and powders in both mature and emerging healthcare markets.
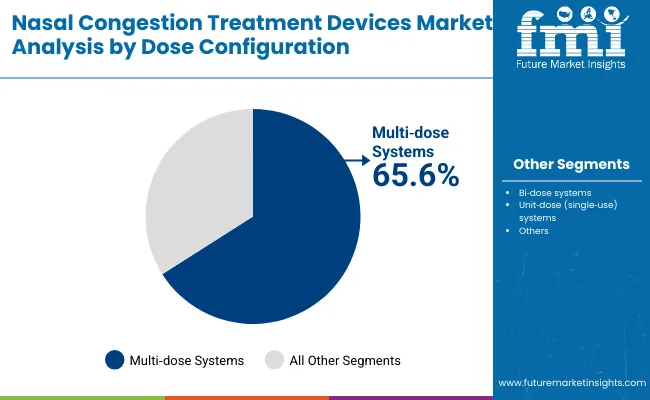
Insights into the Dose Configuration Segment with Multi-dose Systems Dominating the Demand

Nasal Congestion Treatment Devices Market By Dose

By Dose Configuration Market Share (%)
Multi dose systems 65.6%
Bi dose systems 20.9%
Unit dose (single use) systems 13.5%

Multi-dose systems have emerged as the leading configuration and are projected to hold around 65.6% share in 2025, driven by strong consumer preference for reusable and cost-effective nasal spray formats. Their dominance is supported by the widespread use of OTC decongestant sprays for allergic rhinitis and sinusitis, where patients require multiple doses over extended treatment durations. Regulatory agencies have allowed multi-dose packaging with built-in preservatives and metered pumps, ensuring product safety while extending shelf life, further cementing their adoption.

Additionally, the convenience of multi-dose formats aligns well with retail and e-commerce distribution, where patients prioritize affordability and longevity of use. In contrast, bi-dose systems at 20.9% and unit-dose systems at 13.5% serve niche needs particularly in sensitive populations such as pediatrics or patients requiring preservative-free formulations. Collectively, these dynamics have established multi-dose systems as the preferred configuration across both developed and emerging markets.
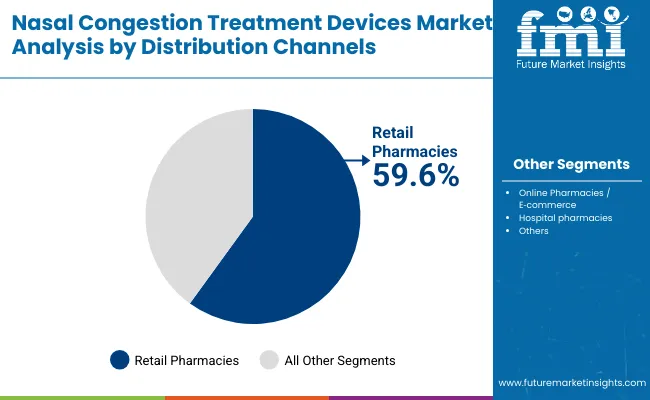
Insights into the Distribution Channel Segment with Highest Sales Through Retail Pharmacies

Nasal Congestion Treatment Devices Market By Distribution

Distribution channels Market Share (%)
Retail pharmacies 59.6%
Online pharmacies / e commerce 20.1%
Hospital pharmacies 15.3%
Others 5.0%

Retail pharmacies are expected to remain the largest distribution channel, contributing around 59.6% of sales in 2025, due to their ability to provide immediate access to OTC nasal sprays, drops, and gels. Consumers continue to prefer pharmacies for congestion relief products because of convenience, professional guidance from pharmacists, and the presence of well-recognized brands. This channel has also benefited from strong foot traffic and in-store promotions, reinforcing its role as the primary point of purchase.

Online pharmacies and e-commerce platforms, holding 20.1% share in 2025, are rapidly expanding as patients increasingly shift toward digital health solutions and home delivery services. Subscription models, bundled offerings, and discounts are making this channel especially appealing to chronic allergy sufferers. Hospital pharmacies, accounting for 15.3% of the market, remain relevant for prescription-based nasal treatments and specialized post-operative congestion relief, while the “Others” category at 5.0% includes smaller outlets and alternative sales channels. Overall, this distribution mix highlights the dominance of retail access while underscoring the accelerating role of digital commerce in shaping consumer buying behavior.

Drivers, Restraints, and Key Trends of the Nasal Congestion Treatment Devices Market

Rising Prevalence of Allergic Rhinitis and Sinus Disorders

The most significant growth driver in the Nasal Congestion Treatment Devices Market is the rising global prevalence of allergic rhinitis, chronic sinusitis, and upper respiratory infections. Increasing exposure to pollution, climate variability, and lifestyle triggers has led to a sustained rise in nasal congestion cases across both developed and emerging economies. Consumers are increasingly seeking immediate relief through user-friendly and non-prescription solutions such as sprays and nasal irrigation devices.

Retail pharmacies, which contribute nearly 60.0% of sales, remain the primary access point, while the rapid growth of online channels is expanding the market’s reach. Manufacturers are responding with innovations in spray formulations, preservative-free multi-dose systems, and ergonomically designed applicators that improve dosing accuracy and compliance. Collectively, these factors are reinforcing the demand trajectory of nasal congestion devices as a staple of self-care and household medicine cabinets.

Cost Sensitivities and Safety Concerns in Device Use

Despite rising demand, cost sensitivity and safety concerns remain significant restraints. Frequent use of decongestant sprays can lead to rebound congestion (rhinitis medicamentosa), which has made regulators and healthcare providers more cautious about long-term consumer dependence. Additionally, device misuse, particularly in pediatric populations, raises concerns around dosing consistency and product safety.

While nasal irrigation systems and powered aspirators offer drug-free alternatives, they often require higher upfront costs and careful cleaning, which can discourage adoption among cost-sensitive consumers in developing markets. Hospital pharmacies and prescribers still tend to favor conventional drug-based treatment in many cases, creating hurdles for broader device adoption. Moreover, in low-resource settings, limited awareness and distribution infrastructure restrict penetration, especially for advanced dry-powder or powered irrigation devices.

Digital Commerce and Consumerization of Nasal Care

A key trend shaping the market is the rapid consumerization of nasal care, driven by the convergence of device innovation and digital sales platforms. Online pharmacies and e-commerce channels are projected to increase their share from 20.1% in 2025 to 22.0% by 2035, as subscription models, bundled seasonal allergy kits, and doorstep delivery resonate with chronic users. At the same time, device manufacturers are aligning nasal congestion products with broader digital health ecosystems.

Emerging models include mobile app-linked smart sprays or acoustic therapy devices that allow usage tracking and symptom monitoring. Furthermore, the integration of drug-free alternatives such as saline sprays, phototherapy aids, and oscillation devices into mainstream retail channels reflects a consumer shift toward holistic and preventive care. In mature markets like the USA and Europe, demand is increasingly tied to brand trust and clinical validation, while in Asia Pacific, rapid urbanization and digital retail adoption are opening up new growth opportunities.
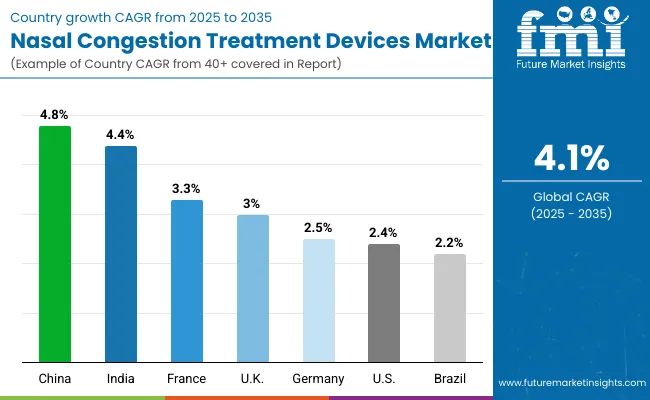
Analysis of Nasal Congestion Treatment Devices Market By Key Countries

Nasal Congestion Treatment Devices Market By Country

Countries CAGR
USA 2.4%
Brazil 2.2%
China 4.8%
India 4.4%
Europe 2.8%
Germany 2.5%
France 3.3%
UK 3.0%

Asia Pacific is emerging as the fastest-growing region in the Nasal Congestion Treatment Devices Market, projected to grow at a CAGR of 4.4% in India and 4.8% in China between 2025 and 2035. Growth in these countries is being driven by rising prevalence of allergic rhinitis, increasing pollution levels, and higher adoption of OTC sprays and nasal irrigation devices.

China benefits from large-scale e-commerce penetration and expanding retail pharmacy networks, while India is witnessing rapid uptake of cost-effective multi-dose sprays and saline solutions as consumer health spending rises. The region’s momentum also stems from expanding middle-class populations in Tier 1 and Tier 2 cities, increased awareness of self-care products, and government-backed healthcare infrastructure modernization that indirectly supports OTC device adoption.

Europe is expected to grow steadily at a CAGR of 2.8% through 2035. Germany, holding a 22.4% share in 2025, is projected to moderate slightly by 2035, while the UK is expected to rise from 18.1% in 2025 to 19.4% in 2035, supported by NHS-backed digital health expansion and consumer preference for preservative-free sprays. France, forecasted at a CAGR of 3.3%, will see demand tempered by pricing pressures in the public health system.

Italy and Spain show stable but moderate growth, while the Rest of Western Europe is expected to increase its collective share to 21.1% by 2035, reflecting broader market adoption across mid-sized countries. Europe’s growth is supported by harmonized regulatory standards for OTC nasal devices, rising preference for natural saline-based formulations, and expansion of online pharmacies.

North America remains a mature but innovation-led market, with the USA projected to grow at a CAGR of 2.4% between 2025 and 2035. Growth is driven by continuous consumer reliance on OTC nasal sprays and the gradual uptake of alternative options such as dry-powder devices and powered irrigation systems.

Replacement of legacy decongestant sprays with preservative-free, multi-dose variants is a key trend. Furthermore, digital distribution channels are expanding rapidly, with online sales contributing over 20% by 2025 and set to rise further by 2035. Federal awareness campaigns around allergy management and the widespread use of nasal devices for pediatric congestion also reinforce steady adoption.
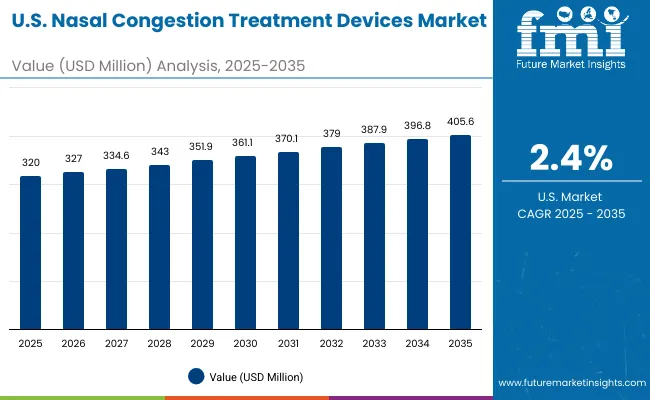
Sales Outlook for Nasal Congestion Treatment Devices in the United States

Nasal Congestion Treatment Devices Market Usa

The nasal congestion treatment devices market in the USA is forecasted to grow at a 2.4% CAGR, primarily driven by the rising prevalence of allergic rhinitis and chronic sinusitis, which affects a large portion of the population. Consumers are increasingly turning to OTC sprays and multi-dose delivery systems for rapid relief, supported by strong availability across retail pharmacies that capture nearly 60.0% of sales. Growth is being further fueled by digital distribution, with online pharmacies holding over 20.0% share in 2025 and expanding steadily through 2035. Manufacturers are responding with preservative-free spray innovations and ergonomic applicator designs to meet consumer safety and compliance needs.

  • Retail pharmacies remain the primary sales channel, offering immediate access to OTC sprays and drops.
  • Online platforms are accelerating sales growth with subscription models and bundled seasonal allergy packages.
  • Hospital pharmacies support prescription-based nasal care and post-surgical congestion relief, particularly in urban centers.

Growth and Expansion Outlook for Nasal Congestion Treatment Devices Market in the United Kingdom

The Nasal Congestion Treatment Devices Market in the UK is projected to grow at a 3.0% CAGR through 2035, supported by NHS modernization projects that emphasize accessible and preventive respiratory care. The UK market share is forecasted to increase from 18.1% in 2025 to 19.4% by 2035, highlighting steady adoption. Demand is being driven by widespread seasonal allergies and growing consumer preference for preservative-free sprays and saline-based formulations. A strong digital health ecosystem, along with NHS-backed e-pharmacy services, is accelerating online distribution, making products more accessible to both urban and rural populations.

  • NHS-supported e-pharmacy frameworks are expanding consumer access to OTC sprays.
  • Day-care and community health clinics promote saline irrigation devices as part of allergy management programs.
  • Retailers and online pharmacies are diversifying product portfolios to meet demand for natural and drug-free nasal relief solutions.

In-depth Analysis of Nasal Congestion Treatment Devices in Germany

The Nasal Congestion Treatment Devices Market in Germany is forecast to grow at a 2.5% CAGR, supported by strong consumer adoption of multi-dose sprays and a shift toward saline-based and preservative-free formulations. Germany held 22.4% of the European market in 2025 but is expected to moderate slightly to 21.6% by 2035 due to competitive pricing pressures and growing adoption in the rest of Western Europe. German consumers show a strong inclination for clinically validated and pharmacy-recommended nasal devices, reinforcing the dominance of branded OTC sprays. Additionally, the integration of e-commerce platforms and digital pharmacies is helping manufacturers reach chronic users more effectively.
  • University hospitals and large pharmacy chains play a critical role in consumer trust and distribution.
  • Independent e-pharmacies are gaining traction with discount pricing and subscription options for sprays and drops.
  • Retail pharmacy groups are prioritizing shelf space for leading brands such as GSK and Bayer, alongside growing domestic saline irrigation brands.

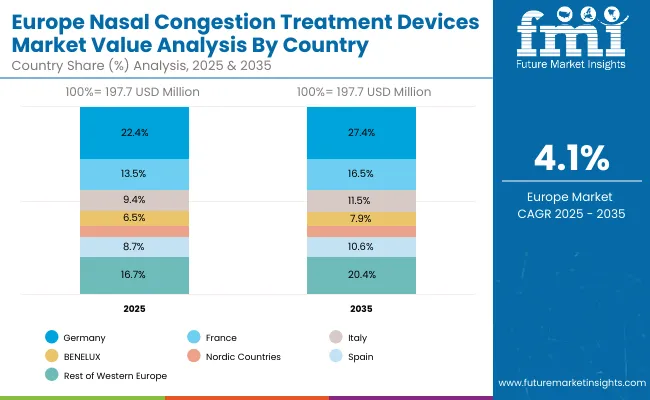
Europe Nasal Congestion Treatment Devices Market Value Analysis By Country

Nasal Congestion Treatment Devices Market Europe

Europe Countries 2025
Germany 22.4%
France 13.5%
Italy 9.4%
BENELUX 6.5%
Nordic Countries 4.7%
Spain 8.7%
Rest of Western Europe 16.7%
Europe Countries 2035
Germany 24.0%
France 16.3%
Italy 12.5%
BENELUX 9.3%
Nordic Countries 6.8%
Spain 11.0%
Rest of Western Europe 20.1%

Market Expansion Outlook for Nasal Congestion Treatment Devices Market in India

The Nasal Congestion Treatment Devices Market in India is expected to grow at a CAGR of 4.4%, making it one of the fastest-growing markets globally. Growth is fueled by rising prevalence of allergic rhinitis and pollution-related sinus conditions, combined with increasing consumer spending on OTC healthcare. Expanding urban populations in Tier 1 and Tier 2 cities are boosting sales of sprays and saline-based drops through retail and e-commerce platforms. Local and multinational companies are offering cost-effective multi-dose sprays and nasal irrigation kits, tailored for Indian price sensitivity and distribution infrastructure.

  • Private hospital pharmacies are stocking branded sprays for post-operative congestion care.
  • E-commerce channels such as pharmacy apps are driving subscription-based sales of saline sprays and drops.
  • Chain pharmacies in Tier 2 cities are expanding availability of NeilMed and other saline irrigation devices.

Sales Outlook for Nasal Congestion Treatment Devices Market in China

The Nasal Congestion Treatment Devices Market in China is projected to grow at a CAGR of 4.8% through 2035, supported by aggressive expansion of retail and digital healthcare channels. Rising seasonal allergy incidence in densely populated cities, coupled with increasing consumer preference for saline sprays and dry-powder devices, is driving demand. Under the “Healthy China 2030” initiative, awareness campaigns are promoting safe OTC solutions, accelerating adoption. Domestic manufacturers are scaling production of cost-effective sprays, while premium brands are gaining traction in Tier 1 markets through online pharmacies.
  • Urban hospitals and clinics recommend preservative-free sprays, reinforcing pharmacy demand.
  • Digital health platforms like JD Health and AliHealth are fueling online sales of OTC sprays and irrigation devices.
  • Domestic brands are introducing competitively priced multi-dose sprays to challenge global players.

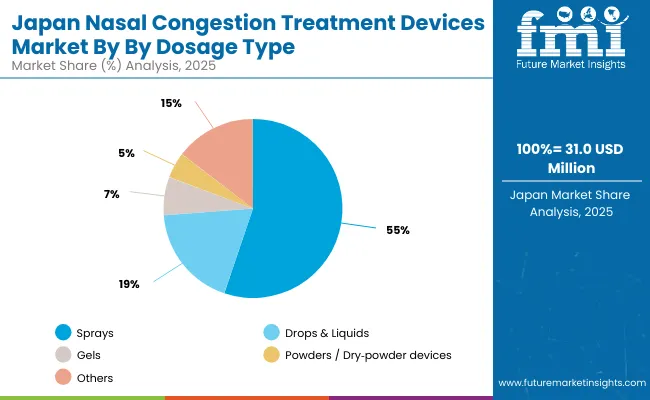
Growth Outlook of Nasal Congestion Treatment Devices Market in Japan

Nasal Congestion Treatment Devices Market Japan

The Nasal Congestion Treatment Devices Market in Japan is projected to reach USD 31.0 million by 2035, growing at a CAGR of 3.0%. In dosage types, Sprays holds around 55.3% in 2025. Growth is driven by Japan’s aging population, where chronic sinusitis and rhinitis incidence is rising. Consumers show high preference for preservative-free, ergonomically designed sprays that align with strict quality and safety standards. Hospital pharmacies play a key role in driving adoption of unit-dose and bi-dose systems, particularly for elderly patients.
  • Market in Japan accounts for 3.3% of global share in 2025.
  • Sprays dominate, but gels and saline solutions are gaining traction for long-term management.
  • Growth is reinforced by consumer demand for high-quality, clinically validated devices.

Opportunity Analysis of South Korea in Nasal Congestion Treatment Devices Market

Nasal Congestion Treatment Devices Market South Korea

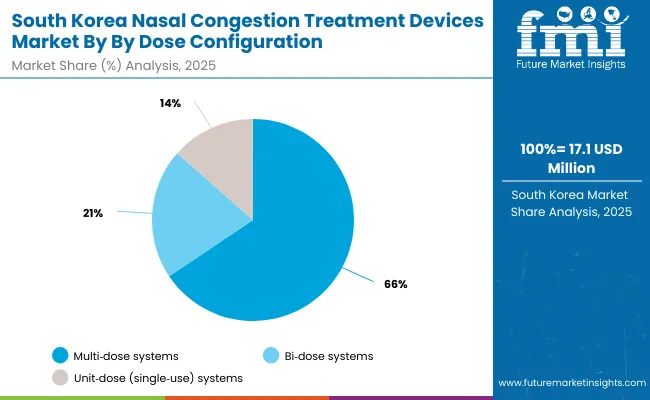
The Nasal Congestion Treatment Devices Market in South Korea is estimated at USD 17.1 million in 2025. Multi‑dose Systems to contribute a revenue share of 62.6% in 2025. Strong consumer awareness of respiratory health, coupled with widespread use of e-commerce platforms, is fueling sales of sprays and nasal irrigation systems. The younger population segment is adopting powered nasal aspirators and advanced saline delivery devices, while hospital pharmacies contribute to demand through prescription-based congestion relief.
  • South Korea holds 1.8% of the global market in 2025.
  • Retail pharmacies dominate, but online channels are rapidly expanding with bundled seasonal allergy kits.
  • Growth is driven by tech-savvy consumers adopting innovative products like Naväge-powered irrigation devices.

Competition Landscape

Nasal Congestion Treatment Devices Market By Company

The Nasal Congestion Treatment Devices Market is moderately consolidated, with global pharmaceutical leaders, established OTC healthcare brands, and specialized device manufacturers competing across sprays, drops, irrigation systems, and powered delivery devices. GlaxoSmithKline (GSK) holds the largest share at 19.5% in 2024, driven by its strong OTC nasal spray portfolio under widely recognized brands. GSK continues to leverage its global retail and e-commerce presence, emphasizing preservative-free sprays, consumer education, and multi-dose system dominance.

Established healthcare companies such as Pfizer, Bayer, Johnson & Johnson, and Teva maintain competitive positions through diversified respiratory portfolios that include nasal sprays and drops integrated into broader allergy and cold-relief product lines. These players focus on leveraging distribution scale, pharmacist engagement, and digital marketing to capture consumer trust. Johnson & Johnson and Bayer are particularly active in promoting saline-based and natural formulations, aligning with the growing consumer preference for non-drug congestion relief.

Specialized device players such as NeilMed and Naväge cater to niche but expanding categories. NeilMed dominates the saline irrigation market with a wide range of neti pots, squeeze bottles, and powered rinse systems, supported by strong physician recommendations. Naväge has differentiated itself by introducing powered nasal irrigation devices with proprietary saline pods, gaining traction in North America and increasingly in Asia Pacific. Their strategies revolve around convenience, patented delivery mechanisms, and premium product positioning in online and specialty retail channels.

Emerging regional players and private-label brands are strengthening competition by offering cost-effective sprays, gels, and drops tailored for local markets. These entrants often compete on affordability, portability, and availability through fast-growing e-commerce platforms.

As the market evolves, competitive differentiation is shifting from basic OTC decongestants toward ergonomic spray applicators, drug-free alternatives, powered irrigation devices, and integration with digital retail ecosystems. Players that successfully align innovation with consumer trust, safety, and accessibility are expected to lead growth through 2035.

Key Development

  • In October 2024, Aptar Pharma announced the acquisition of all device technology assets fromSipNose Nasal Delivery Systems, strengthening its intranasal drug delivery portfolio. The deal expands Aptar’s capabilities in liquid and dry-powder nasal delivery, enhances its nose-to-brain expertise, and supports innovation in CNS-targeted therapies and patient-centric drug delivery solutions.
  • In May 2025, Paratek Pharmaceuticals completed its $330 million acquisition of Optinose, adding the chronic rhinosinusitis therapy XHANCE® to its portfolio alongside antibiotic NUZYRA®. The deal strengthens Paratek’s specialty therapeutics platform, diversifies revenue, and positions the company for future product expansion across respiratory and specialty care markets.

Scope of the Report

Item Value
Mar ket Value USD 932.2 million
Dosage type Sprays, Drops & Liquids, Gels, Powders/Dry-powder devices, and Others
dose configuration Multi-dose systems, Bi-dose systems, and Unit-dose (single-use) systems, reflecting consumer choice between refillable, dual, and single-use delivery systems
Distribution channels Retail Pharmacies, Online Pharmacies/E-commerce, Hospital Pharmacies, and Others
Regions Covered North America, Latin America, Western & Eastern Europe, East Asia, South Asia & Pacific, Middle East & Africa
Countries Covered USA, Brazil, China, India, Germany, France, UK etc.
Key Companies Profiled GlaxoSmithKline (GSK), Pfizer, Teva, Bayer, Johnson & Johnson, NeilMed, Naväge, Others
Additional Attributes Dollar sales by application and regions, adoption trends of Nasal Irrigation Devices and Decongestant Delivery Systems, Rising demand in Homecare Settings, Growing demand across Pharmacies and Retail Clinics, and Increasing adoption in Hospitals & Specialty ENT Clinics

Key Segments

By Dosage Type:

  • Sprays
  • Drops & Liquids
  • Gels
  • Powders / Dry powder devices
  • Others

By Dose Configuration:

  • Multi dose systems
  • Bi dose systems
  • Value (USD Million) & Volume (Units) dose (single use) systems

By Distribution channels:

  • Retail pharmacies
  • Online pharmacies / e commerce
  • Hospital pharmacies
  • Others

By Region:

  • North America
  • Latin America
  • East Asia
  • South Asia & Pacific
  • Western Europe
  • Eastern Europe
  • Middle East & Africa

Table of Content

  1. Executive Summary
    • Global Market Outlook
    • Demand-side Trends
    • Supply-side Trends
    • Technology Roadmap Analysis
    • Analysis and Recommendations
  2. Market Overview
    • Market Coverage / Taxonomy
    • Market Definition / Scope / Limitations
  3. Market Background
    • Market Dynamics
      • Drivers
      • Restraints
      • Opportunity
      • Trends
    • Scenario Forecast
      • Demand in Optimistic Scenario
      • Demand in Likely Scenario
      • Demand in Conservative Scenario
    • Opportunity Map Analysis
    • Product Life Cycle Analysis
    • Supply Chain Analysis
      • Supply Side Participants and their Roles
        • Producers
        • Mid-Level Participants (Traders/ Agents/ Brokers)
        • Wholesalers and Distributors
      • Value Added and Value Created at Node in the Supply Chain
      • List of Raw Material Suppliers
      • List of Existing and Potential Buyer’s
    • Investment Feasibility Matrix
    • Value Chain Analysis
      • Profit Margin Analysis
      • Wholesalers and Distributors
      • Retailers
    • PESTLE and Porter’s Analysis
    • Regulatory Landscape
      • By Key Regions
      • By Key Countries
    • Regional Parent Market Outlook
    • Production and Consumption Statistics
    • Import and Export Statistics
  4. Global Market Analysis 2020 to 2024 and Forecast, 2025 to 2035
    • Historical Market Size Value (USD Million) & Volume (Units) Analysis, 2020 to 2024
    • Current and Future Market Size Value (USD Million) & Volume (Units) Projections, 2025 to 2035
      • Y-o-Y Growth Trend Analysis
      • Absolute $ Opportunity Analysis
  5. Global Market Analysis 2020 to 2024 and Forecast 2025 to 2035, By Dosage Type
    • Introduction / Key Findings
    • Historical Market Size Value (USD Million) & Volume (Units) Analysis By Dosage Type, 2020 to 2024
    • Current and Future Market Size Value (USD Million) & Volume (Units) Analysis and Forecast By Dosage Type, 2025 to 2035
      • Sprays
      • Drops & Liquids
      • Gels
      • Powders / Dry powder devices
      • Others
    • Y-o-Y Growth Trend Analysis By Dosage Type, 2020 to 2024
    • Absolute $ Opportunity Analysis By Dosage Type, 2025 to 2035
  6. Global Market Analysis 2020 to 2024 and Forecast 2025 to 2035, By Dose Configuration
    • Introduction / Key Findings
    • Historical Market Size Value (USD Million) & Volume (Units) Analysis By Dose Configuration, 2020 to 2024
    • Current and Future Market Size Value (USD Million) & Volume (Units) Analysis and Forecast By Dose Configuration, 2025 to 2035
      • Multi dose systems
      • Bi dose systems
      • Value (USD Million) & Volume (Units) dose (single use) systems
    • Y-o-Y Growth Trend Analysis By Dose Configuration, 2020 to 2024
    • Absolute $ Opportunity Analysis By Dose Configuration, 2025 to 2035
  7. Global Market Analysis 2020 to 2024 and Forecast 2025 to 2035, By Distribution channels
    • Introduction / Key Findings
    • Historical Market Size Value (USD Million) & Volume (Units) Analysis By Distribution channels, 2020 to 2024
    • Current and Future Market Size Value (USD Million) & Volume (Units) Analysis and Forecast By Distribution channels, 2025 to 2035
      • Retail pharmacies
      • Online pharmacies / e commerce
      • Hospital pharmacies
      • Others
    • Y-o-Y Growth Trend Analysis By Distribution channels, 2020 to 2024
    • Absolute $ Opportunity Analysis By Distribution channels, 2025 to 2035
  8. Global Market Analysis 2020 to 2024 and Forecast 2025 to 2035, By Region
    • Introduction
    • Historical Market Size Value (USD Million) & Volume (Units) Analysis By Region, 2020 to 2024
    • Current Market Size Value (USD Million) & Volume (Units) Analysis and Forecast By Region, 2025 to 2035
      • North America
      • Latin America
      • East Asia
      • South Asia & Pacific
      • Western Europe
      • Eastern Europe
      • Middle East & Africa
    • Market Attractiveness Analysis By Region
  9. North America Market Analysis 2020 to 2024 and Forecast 2025 to 2035, By Country
    • Historical Market Size Value (USD Million) & Volume (Units) Trend Analysis By Market Taxonomy, 2020 to 2024
    • Market Size Value (USD Million) & Volume (Units) Forecast By Market Taxonomy, 2025 to 2035
      • By Country
        • USA
        • Canada
        • Mexico
      • By Dosage Type
      • By Dose Configuration
      • By Distribution channels
    • Market Attractiveness Analysis
      • By Country
      • By Dosage Type
      • By Dose Configuration
      • By Distribution channels
    • Key Takeaways
  10. Latin America Market Analysis 2020 to 2024 and Forecast 2025 to 2035, By Country
    • Historical Market Size Value (USD Million) & Volume (Units) Trend Analysis By Market Taxonomy, 2020 to 2024
    • Market Size Value (USD Million) & Volume (Units) Forecast By Market Taxonomy, 2025 to 2035
      • By Country
        • Brazil
        • Argentina
        • Rest of Latin America
      • By Dosage Type
      • By Dose Configuration
      • By Distribution channels
    • Market Attractiveness Analysis
      • By Country
      • By Dosage Type
      • By Dose Configuration
      • By Distribution channels
    • Key Takeaways
  11. East Asia Market Analysis 2020 to 2024 and Forecast 2025 to 2035, By Country
    • Historical Market Size Value (USD Million) & Volume (Units) Trend Analysis By Market Taxonomy, 2020 to 2024
    • Market Size Value (USD Million) & Volume (Units) Forecast By Market Taxonomy, 2025 to 2035
      • By Country
        • China
        • Japan
        • South Korea
      • By Dosage Type
      • By Dose Configuration
      • By Distribution channels
    • Market Attractiveness Analysis
      • By Country
      • By Dosage Type
      • By Dose Configuration
      • By Distribution channels
    • Key Takeaways
  12. South Asia & Pacific Market Analysis 2020 to 2024 and Forecast 2025 to 2035, By Country
    • Historical Market Size Value (USD Million) & Volume (Units) Trend Analysis By Market Taxonomy, 2020 to 2024
    • Market Size Value (USD Million) & Volume (Units) Forecast By Market Taxonomy, 2025 to 2035
      • By Country
        • India
        • ASEAN Countries
        • Australia& New Zealand
        • Rest of South Asia
      • By Dosage Type
      • By Dose Configuration
      • By Distribution channels
    • Market Attractiveness Analysis
      • By Country
      • By Dosage Type
      • By Dose Configuration
      • By Distribution channels
    • Key Takeaways
  13. Western Europe Market Analysis 2020 to 2024 and Forecast 2025 to 2035, By Country
    • Historical Market Size Value (USD Million) & Volume (Units) Trend Analysis By Market Taxonomy, 2020 to 2024
    • Market Size Value (USD Million) & Volume (Units) Forecast By Market Taxonomy, 2025 to 2035
      • By Country
        • Germany
        • UK
        • France
        • Italy
        • Spain
        • BENELUX
        • Nordic Countries
        • Rest of Western Europe
      • By Dosage Type
      • By Dose Configuration
      • By Distribution channels
    • Market Attractiveness Analysis
      • By Country
      • By Dosage Type
      • By Dose Configuration
      • By Distribution channels
    • Key Takeaways
  14. Eastern Europe Market Analysis 2020 to 2024 and Forecast 2025 to 2035, By Country
    • Historical Market Size Value (USD Million) & Volume (Units) Trend Analysis By Market Taxonomy, 2020 to 2024
    • Market Size Value (USD Million) & Volume (Units) Forecast By Market Taxonomy, 2025 to 2035
      • By Country
        • Russia
        • Hungary
        • Poland
        • Rest of Eastern Europe
      • By Dosage Type
      • By Dose Configuration
      • By Distribution channels
    • Market Attractiveness Analysis
      • By Country
      • By Dosage Type
      • By Dose Configuration
      • By Distribution channels
    • Key Takeaways
  15. Middle East & Africa Market Analysis 2020 to 2024 and Forecast 2025 to 2035, By Country
    • Historical Market Size Value (USD Million) & Volume (Units) Trend Analysis By Market Taxonomy, 2020 to 2024
    • Market Size Value (USD Million) & Volume (Units) Forecast By Market Taxonomy, 2025 to 2035
      • By Country
        • Saudi Arabia
        • Türkiye
        • South Africa
        • Other African Union
        • Rest of Middle East & Africa
      • By Dosage Type
      • By Dose Configuration
      • By Distribution channels
    • Market Attractiveness Analysis
      • By Country
      • By Dosage Type
      • By Dose Configuration
      • By Distribution channels
    • Key Takeaways
  16. Key Countries Market Analysis
    • USA
      • Pricing Analysis
      • Market Share Analysis, 2024
        • By Dosage Type
        • By Dose Configuration
        • By Distribution channels
    • Brazil
      • Pricing Analysis
      • Market Share Analysis, 2024
        • By Dosage Type
        • By Dose Configuration
        • By Distribution channels
    • China
      • Pricing Analysis
      • Market Share Analysis, 2024
        • By Dosage Type
        • By Dose Configuration
        • By Distribution channels
    • India
      • Pricing Analysis
      • Market Share Analysis, 2024
        • By Dosage Type
        • By Dose Configuration
        • By Distribution channels
    • Europe
      • Pricing Analysis
      • Market Share Analysis, 2024
        • By Dosage Type
        • By Dose Configuration
        • By Distribution channels
    • Germany
      • Pricing Analysis
      • Market Share Analysis, 2024
        • By Dosage Type
        • By Dose Configuration
        • By Distribution channels
    • France
      • Pricing Analysis
      • Market Share Analysis, 2024
        • By Dosage Type
        • By Dose Configuration
        • By Distribution channels
    • UK
      • Pricing Analysis
      • Market Share Analysis, 2024
        • By Dosage Type
        • By Dose Configuration
        • By Distribution channels
  17. Market Structure Analysis
    • Competition Dashboard
    • Competition Benchmarking
    • Market Share Analysis of Top Players
      • By Regional
      • By Dosage Type
      • By Dose Configuration
      • By Distribution channels
  18. Competition Analysis
    • Competition Deep Dive
      • GlaxoSmithKline (GSK)
        • Overview
        • Product Portfolio
        • Profitability by Market Segments (Product/Age /Sales Channel/Region)
        • Sales Footprint
        • Strategy Overview
          • Marketing Strategy
          • Product Strategy
          • Channel Strategy
      • Pfizer
        • Overview
        • Product Portfolio
        • Profitability by Market Segments (Product/Age /Sales Channel/Region)
        • Sales Footprint
        • Strategy Overview
          • Marketing Strategy
          • Product Strategy
          • Channel Strategy
      • Teva
        • Overview
        • Product Portfolio
        • Profitability by Market Segments (Product/Age /Sales Channel/Region)
        • Sales Footprint
        • Strategy Overview
          • Marketing Strategy
          • Product Strategy
          • Channel Strategy
      • Bayer
        • Overview
        • Product Portfolio
        • Profitability by Market Segments (Product/Age /Sales Channel/Region)
        • Sales Footprint
        • Strategy Overview
          • Marketing Strategy
          • Product Strategy
          • Channel Strategy
      • Johnson & Johnson
        • Overview
        • Product Portfolio
        • Profitability by Market Segments (Product/Age /Sales Channel/Region)
        • Sales Footprint
        • Strategy Overview
          • Marketing Strategy
          • Product Strategy
          • Channel Strategy
      • NeilMed
        • Overview
        • Product Portfolio
        • Profitability by Market Segments (Product/Age /Sales Channel/Region)
        • Sales Footprint
        • Strategy Overview
          • Marketing Strategy
          • Product Strategy
          • Channel Strategy
      • Naväge
        • Overview
        • Product Portfolio
        • Profitability by Market Segments (Product/Age /Sales Channel/Region)
        • Sales Footprint
        • Strategy Overview
          • Marketing Strategy
          • Product Strategy
          • Channel Strategy
      • Others
        • Overview
        • Product Portfolio
        • Profitability by Market Segments (Product/Age /Sales Channel/Region)
        • Sales Footprint
        • Strategy Overview
          • Marketing Strategy
          • Product Strategy
          • Channel Strategy
  19. Assumptions & Acronyms Used
  20. Research Methodology

List of Tables

  • Table 1: Global Market Value (USD Million) Forecast by Region, 2020-2035
  • Table 2: Global Market Volume (Units) Forecast by Region, 2020-2035
  • Table 3: Global Market Value (USD Million) Forecast by Dosage Type, 2020-2035
  • Table 4: Global Market Volume (Units) Forecast by Dosage Type, 2020-2035
  • Table 5: Global Market Value (USD Million) Forecast by Dose Configuration, 2020-2035
  • Table 6: Global Market Volume (Units) Forecast by Dose Configuration, 2020-2035
  • Table 7: Global Market Value (USD Million) Forecast by Distribution channels, 2020-2035
  • Table 8: Global Market Volume (Units) Forecast by Distribution channels, 2020-2035
  • Table 9: North America Market Value (USD Million) Forecast by Country, 2020-2035
  • Table 10: North America Market Volume (Units) Forecast by Country, 2020-2035
  • Table 11: North America Market Value (USD Million) Forecast by Dosage Type, 2020-2035
  • Table 12: North America Market Volume (Units) Forecast by Dosage Type, 2020-2035
  • Table 13: North America Market Value (USD Million) Forecast by Dose Configuration, 2020-2035
  • Table 14: North America Market Volume (Units) Forecast by Dose Configuration, 2020-2035
  • Table 15: North America Market Value (USD Million) Forecast by Distribution channels, 2020-2035
  • Table 16: North America Market Volume (Units) Forecast by Distribution channels, 2020-2035
  • Table 17: Latin America Market Value (USD Million) Forecast by Country, 2020-2035
  • Table 18: Latin America Market Volume (Units) Forecast by Country, 2020-2035
  • Table 19: Latin America Market Value (USD Million) Forecast by Dosage Type, 2020-2035
  • Table 20: Latin America Market Volume (Units) Forecast by Dosage Type, 2020-2035
  • Table 21: Latin America Market Value (USD Million) Forecast by Dose Configuration, 2020-2035
  • Table 22: Latin America Market Volume (Units) Forecast by Dose Configuration, 2020-2035
  • Table 23: Latin America Market Value (USD Million) Forecast by Distribution channels, 2020-2035
  • Table 24: Latin America Market Volume (Units) Forecast by Distribution channels, 2020-2035
  • Table 25: East Asia Market Value (USD Million) Forecast by Country, 2020-2035
  • Table 26: East Asia Market Volume (Units) Forecast by Country, 2020-2035
  • Table 27: East Asia Market Value (USD Million) Forecast by Dosage Type, 2020-2035
  • Table 28: East Asia Market Volume (Units) Forecast by Dosage Type, 2020-2035
  • Table 29: East Asia Market Value (USD Million) Forecast by Dose Configuration, 2020-2035
  • Table 30: East Asia Market Volume (Units) Forecast by Dose Configuration, 2020-2035
  • Table 31: East Asia Market Value (USD Million) Forecast by Distribution channels, 2020-2035
  • Table 32: East Asia Market Volume (Units) Forecast by Distribution channels, 2020-2035
  • Table 33: South Asia & Pacific Market Value (USD Million) Forecast by Country, 2020-2035
  • Table 34: South Asia & Pacific Market Volume (Units) Forecast by Country, 2020-2035
  • Table 35: South Asia & Pacific Market Value (USD Million) Forecast by Dosage Type, 2020-2035
  • Table 36: South Asia & Pacific Market Volume (Units) Forecast by Dosage Type, 2020-2035
  • Table 37: South Asia & Pacific Market Value (USD Million) Forecast by Dose Configuration, 2020-2035
  • Table 38: South Asia & Pacific Market Volume (Units) Forecast by Dose Configuration, 2020-2035
  • Table 39: South Asia & Pacific Market Value (USD Million) Forecast by Distribution channels, 2020-2035
  • Table 40: South Asia & Pacific Market Volume (Units) Forecast by Distribution channels, 2020-2035
  • Table 41: Western Europe Market Value (USD Million) Forecast by Country, 2020-2035
  • Table 42: Western Europe Market Volume (Units) Forecast by Country, 2020-2035
  • Table 43: Western Europe Market Value (USD Million) Forecast by Dosage Type, 2020-2035
  • Table 44: Western Europe Market Volume (Units) Forecast by Dosage Type, 2020-2035
  • Table 45: Western Europe Market Value (USD Million) Forecast by Dose Configuration, 2020-2035
  • Table 46: Western Europe Market Volume (Units) Forecast by Dose Configuration, 2020-2035
  • Table 47: Western Europe Market Value (USD Million) Forecast by Distribution channels, 2020-2035
  • Table 48: Western Europe Market Volume (Units) Forecast by Distribution channels, 2020-2035
  • Table 49: Eastern Europe Market Value (USD Million) Forecast by Country, 2020-2035
  • Table 50: Eastern Europe Market Volume (Units) Forecast by Country, 2020-2035
  • Table 51: Eastern Europe Market Value (USD Million) Forecast by Dosage Type, 2020-2035
  • Table 52: Eastern Europe Market Volume (Units) Forecast by Dosage Type, 2020-2035
  • Table 53: Eastern Europe Market Value (USD Million) Forecast by Dose Configuration, 2020-2035
  • Table 54: Eastern Europe Market Volume (Units) Forecast by Dose Configuration, 2020-2035
  • Table 55: Eastern Europe Market Value (USD Million) Forecast by Distribution channels, 2020-2035
  • Table 56: Eastern Europe Market Volume (Units) Forecast by Distribution channels, 2020-2035
  • Table 57: Middle East & Africa Market Value (USD Million) Forecast by Country, 2020-2035
  • Table 58: Middle East & Africa Market Volume (Units) Forecast by Country, 2020-2035
  • Table 59: Middle East & Africa Market Value (USD Million) Forecast by Dosage Type, 2020-2035
  • Table 60: Middle East & Africa Market Volume (Units) Forecast by Dosage Type, 2020-2035
  • Table 61: Middle East & Africa Market Value (USD Million) Forecast by Dose Configuration, 2020-2035
  • Table 62: Middle East & Africa Market Volume (Units) Forecast by Dose Configuration, 2020-2035
  • Table 63: Middle East & Africa Market Value (USD Million) Forecast by Distribution channels, 2020-2035
  • Table 64: Middle East & Africa Market Volume (Units) Forecast by Distribution channels, 2020-2035

List of Figures

  • Figure 1: Global Market Value (USD Million) by Dosage Type, 2025-2035
  • Figure 2: Global Market Value (USD Million) by Dose Configuration, 2025-2035
  • Figure 3: Global Market Value (USD Million) by Distribution channels, 2025-2035
  • Figure 4: Global Market Value (USD Million) by Region, 2025-2035
  • Figure 5: Global Market Value (USD Million) Analysis by Region, 2020-2035
  • Figure 6: Global Market Volume (Units) Analysis by Region, 2020-2035
  • Figure 7: Global Market Value Share (%) and BPS Analysis by Region, 2025-2035
  • Figure 8: Global Market Y-o-Y Growth (%) Projections by Region, 2025-2035
  • Figure 9: Global Market Value (USD Million) Analysis by Dosage Type, 2020-2035
  • Figure 10: Global Market Volume (Units) Analysis by Dosage Type, 2020-2035
  • Figure 11: Global Market Value Share (%) and BPS Analysis by Dosage Type, 2025-2035
  • Figure 12: Global Market Y-o-Y Growth (%) Projections by Dosage Type, 2025-2035
  • Figure 13: Global Market Value (USD Million) Analysis by Dose Configuration, 2020-2035
  • Figure 14: Global Market Volume (Units) Analysis by Dose Configuration, 2020-2035
  • Figure 15: Global Market Value Share (%) and BPS Analysis by Dose Configuration, 2025-2035
  • Figure 16: Global Market Y-o-Y Growth (%) Projections by Dose Configuration, 2025-2035
  • Figure 17: Global Market Value (USD Million) Analysis by Distribution channels, 2020-2035
  • Figure 18: Global Market Volume (Units) Analysis by Distribution channels, 2020-2035
  • Figure 19: Global Market Value Share (%) and BPS Analysis by Distribution channels, 2025-2035
  • Figure 20: Global Market Y-o-Y Growth (%) Projections by Distribution channels, 2025-2035
  • Figure 21: Global Market Attractiveness by Dosage Type, 2025-2035
  • Figure 22: Global Market Attractiveness by Dose Configuration, 2025-2035
  • Figure 23: Global Market Attractiveness by Distribution channels, 2025-2035
  • Figure 24: Global Market Attractiveness by Region, 2025-2035
  • Figure 25: North America Market Value (USD Million) by Dosage Type, 2025-2035
  • Figure 26: North America Market Value (USD Million) by Dose Configuration, 2025-2035
  • Figure 27: North America Market Value (USD Million) by Distribution channels, 2025-2035
  • Figure 28: North America Market Value (USD Million) by Country, 2025-2035
  • Figure 29: North America Market Value (USD Million) Analysis by Country, 2020-2035
  • Figure 30: North America Market Volume (Units) Analysis by Country, 2020-2035
  • Figure 31: North America Market Value Share (%) and BPS Analysis by Country, 2025-2035
  • Figure 32: North America Market Y-o-Y Growth (%) Projections by Country, 2025-2035
  • Figure 33: North America Market Value (USD Million) Analysis by Dosage Type, 2020-2035
  • Figure 34: North America Market Volume (Units) Analysis by Dosage Type, 2020-2035
  • Figure 35: North America Market Value Share (%) and BPS Analysis by Dosage Type, 2025-2035
  • Figure 36: North America Market Y-o-Y Growth (%) Projections by Dosage Type, 2025-2035
  • Figure 37: North America Market Value (USD Million) Analysis by Dose Configuration, 2020-2035
  • Figure 38: North America Market Volume (Units) Analysis by Dose Configuration, 2020-2035
  • Figure 39: North America Market Value Share (%) and BPS Analysis by Dose Configuration, 2025-2035
  • Figure 40: North America Market Y-o-Y Growth (%) Projections by Dose Configuration, 2025-2035
  • Figure 41: North America Market Value (USD Million) Analysis by Distribution channels, 2020-2035
  • Figure 42: North America Market Volume (Units) Analysis by Distribution channels, 2020-2035
  • Figure 43: North America Market Value Share (%) and BPS Analysis by Distribution channels, 2025-2035
  • Figure 44: North America Market Y-o-Y Growth (%) Projections by Distribution channels, 2025-2035
  • Figure 45: North America Market Attractiveness by Dosage Type, 2025-2035
  • Figure 46: North America Market Attractiveness by Dose Configuration, 2025-2035
  • Figure 47: North America Market Attractiveness by Distribution channels, 2025-2035
  • Figure 48: North America Market Attractiveness by Country, 2025-2035
  • Figure 49: Latin America Market Value (USD Million) by Dosage Type, 2025-2035
  • Figure 50: Latin America Market Value (USD Million) by Dose Configuration, 2025-2035
  • Figure 51: Latin America Market Value (USD Million) by Distribution channels, 2025-2035
  • Figure 52: Latin America Market Value (USD Million) by Country, 2025-2035
  • Figure 53: Latin America Market Value (USD Million) Analysis by Country, 2020-2035
  • Figure 54: Latin America Market Volume (Units) Analysis by Country, 2020-2035
  • Figure 55: Latin America Market Value Share (%) and BPS Analysis by Country, 2025-2035
  • Figure 56: Latin America Market Y-o-Y Growth (%) Projections by Country, 2025-2035
  • Figure 57: Latin America Market Value (USD Million) Analysis by Dosage Type, 2020-2035
  • Figure 58: Latin America Market Volume (Units) Analysis by Dosage Type, 2020-2035
  • Figure 59: Latin America Market Value Share (%) and BPS Analysis by Dosage Type, 2025-2035
  • Figure 60: Latin America Market Y-o-Y Growth (%) Projections by Dosage Type, 2025-2035
  • Figure 61: Latin America Market Value (USD Million) Analysis by Dose Configuration, 2020-2035
  • Figure 62: Latin America Market Volume (Units) Analysis by Dose Configuration, 2020-2035
  • Figure 63: Latin America Market Value Share (%) and BPS Analysis by Dose Configuration, 2025-2035
  • Figure 64: Latin America Market Y-o-Y Growth (%) Projections by Dose Configuration, 2025-2035
  • Figure 65: Latin America Market Value (USD Million) Analysis by Distribution channels, 2020-2035
  • Figure 66: Latin America Market Volume (Units) Analysis by Distribution channels, 2020-2035
  • Figure 67: Latin America Market Value Share (%) and BPS Analysis by Distribution channels, 2025-2035
  • Figure 68: Latin America Market Y-o-Y Growth (%) Projections by Distribution channels, 2025-2035
  • Figure 69: Latin America Market Attractiveness by Dosage Type, 2025-2035
  • Figure 70: Latin America Market Attractiveness by Dose Configuration, 2025-2035
  • Figure 71: Latin America Market Attractiveness by Distribution channels, 2025-2035
  • Figure 72: Latin America Market Attractiveness by Country, 2025-2035
  • Figure 73: East Asia Market Value (USD Million) by Dosage Type, 2025-2035
  • Figure 74: East Asia Market Value (USD Million) by Dose Configuration, 2025-2035
  • Figure 75: East Asia Market Value (USD Million) by Distribution channels, 2025-2035
  • Figure 76: East Asia Market Value (USD Million) by Country, 2025-2035
  • Figure 77: East Asia Market Value (USD Million) Analysis by Country, 2020-2035
  • Figure 78: East Asia Market Volume (Units) Analysis by Country, 2020-2035
  • Figure 79: East Asia Market Value Share (%) and BPS Analysis by Country, 2025-2035
  • Figure 80: East Asia Market Y-o-Y Growth (%) Projections by Country, 2025-2035
  • Figure 81: East Asia Market Value (USD Million) Analysis by Dosage Type, 2020-2035
  • Figure 82: East Asia Market Volume (Units) Analysis by Dosage Type, 2020-2035
  • Figure 83: East Asia Market Value Share (%) and BPS Analysis by Dosage Type, 2025-2035
  • Figure 84: East Asia Market Y-o-Y Growth (%) Projections by Dosage Type, 2025-2035
  • Figure 85: East Asia Market Value (USD Million) Analysis by Dose Configuration, 2020-2035
  • Figure 86: East Asia Market Volume (Units) Analysis by Dose Configuration, 2020-2035
  • Figure 87: East Asia Market Value Share (%) and BPS Analysis by Dose Configuration, 2025-2035
  • Figure 88: East Asia Market Y-o-Y Growth (%) Projections by Dose Configuration, 2025-2035
  • Figure 89: East Asia Market Value (USD Million) Analysis by Distribution channels, 2020-2035
  • Figure 90: East Asia Market Volume (Units) Analysis by Distribution channels, 2020-2035
  • Figure 91: East Asia Market Value Share (%) and BPS Analysis by Distribution channels, 2025-2035
  • Figure 92: East Asia Market Y-o-Y Growth (%) Projections by Distribution channels, 2025-2035
  • Figure 93: East Asia Market Attractiveness by Dosage Type, 2025-2035
  • Figure 94: East Asia Market Attractiveness by Dose Configuration, 2025-2035
  • Figure 95: East Asia Market Attractiveness by Distribution channels, 2025-2035
  • Figure 96: East Asia Market Attractiveness by Country, 2025-2035
  • Figure 97: South Asia & Pacific Market Value (USD Million) by Dosage Type, 2025-2035
  • Figure 98: South Asia & Pacific Market Value (USD Million) by Dose Configuration, 2025-2035
  • Figure 99: South Asia & Pacific Market Value (USD Million) by Distribution channels, 2025-2035
  • Figure 100: South Asia & Pacific Market Value (USD Million) by Country, 2025-2035
  • Figure 101: South Asia & Pacific Market Value (USD Million) Analysis by Country, 2020-2035
  • Figure 102: South Asia & Pacific Market Volume (Units) Analysis by Country, 2020-2035
  • Figure 103: South Asia & Pacific Market Value Share (%) and BPS Analysis by Country, 2025-2035
  • Figure 104: South Asia & Pacific Market Y-o-Y Growth (%) Projections by Country, 2025-2035
  • Figure 105: South Asia & Pacific Market Value (USD Million) Analysis by Dosage Type, 2020-2035
  • Figure 106: South Asia & Pacific Market Volume (Units) Analysis by Dosage Type, 2020-2035
  • Figure 107: South Asia & Pacific Market Value Share (%) and BPS Analysis by Dosage Type, 2025-2035
  • Figure 108: South Asia & Pacific Market Y-o-Y Growth (%) Projections by Dosage Type, 2025-2035
  • Figure 109: South Asia & Pacific Market Value (USD Million) Analysis by Dose Configuration, 2020-2035
  • Figure 110: South Asia & Pacific Market Volume (Units) Analysis by Dose Configuration, 2020-2035
  • Figure 111: South Asia & Pacific Market Value Share (%) and BPS Analysis by Dose Configuration, 2025-2035
  • Figure 112: South Asia & Pacific Market Y-o-Y Growth (%) Projections by Dose Configuration, 2025-2035
  • Figure 113: South Asia & Pacific Market Value (USD Million) Analysis by Distribution channels, 2020-2035
  • Figure 114: South Asia & Pacific Market Volume (Units) Analysis by Distribution channels, 2020-2035
  • Figure 115: South Asia & Pacific Market Value Share (%) and BPS Analysis by Distribution channels, 2025-2035
  • Figure 116: South Asia & Pacific Market Y-o-Y Growth (%) Projections by Distribution channels, 2025-2035
  • Figure 117: South Asia & Pacific Market Attractiveness by Dosage Type, 2025-2035
  • Figure 118: South Asia & Pacific Market Attractiveness by Dose Configuration, 2025-2035
  • Figure 119: South Asia & Pacific Market Attractiveness by Distribution channels, 2025-2035
  • Figure 120: South Asia & Pacific Market Attractiveness by Country, 2025-2035
  • Figure 121: Western Europe Market Value (USD Million) by Dosage Type, 2025-2035
  • Figure 122: Western Europe Market Value (USD Million) by Dose Configuration, 2025-2035
  • Figure 123: Western Europe Market Value (USD Million) by Distribution channels, 2025-2035
  • Figure 124: Western Europe Market Value (USD Million) by Country, 2025-2035
  • Figure 125: Western Europe Market Value (USD Million) Analysis by Country, 2020-2035
  • Figure 126: Western Europe Market Volume (Units) Analysis by Country, 2020-2035
  • Figure 127: Western Europe Market Value Share (%) and BPS Analysis by Country, 2025-2035
  • Figure 128: Western Europe Market Y-o-Y Growth (%) Projections by Country, 2025-2035
  • Figure 129: Western Europe Market Value (USD Million) Analysis by Dosage Type, 2020-2035
  • Figure 130: Western Europe Market Volume (Units) Analysis by Dosage Type, 2020-2035
  • Figure 131: Western Europe Market Value Share (%) and BPS Analysis by Dosage Type, 2025-2035
  • Figure 132: Western Europe Market Y-o-Y Growth (%) Projections by Dosage Type, 2025-2035
  • Figure 133: Western Europe Market Value (USD Million) Analysis by Dose Configuration, 2020-2035
  • Figure 134: Western Europe Market Volume (Units) Analysis by Dose Configuration, 2020-2035
  • Figure 135: Western Europe Market Value Share (%) and BPS Analysis by Dose Configuration, 2025-2035
  • Figure 136: Western Europe Market Y-o-Y Growth (%) Projections by Dose Configuration, 2025-2035
  • Figure 137: Western Europe Market Value (USD Million) Analysis by Distribution channels, 2020-2035
  • Figure 138: Western Europe Market Volume (Units) Analysis by Distribution channels, 2020-2035
  • Figure 139: Western Europe Market Value Share (%) and BPS Analysis by Distribution channels, 2025-2035
  • Figure 140: Western Europe Market Y-o-Y Growth (%) Projections by Distribution channels, 2025-2035
  • Figure 141: Western Europe Market Attractiveness by Dosage Type, 2025-2035
  • Figure 142: Western Europe Market Attractiveness by Dose Configuration, 2025-2035
  • Figure 143: Western Europe Market Attractiveness by Distribution channels, 2025-2035
  • Figure 144: Western Europe Market Attractiveness by Country, 2025-2035
  • Figure 145: Eastern Europe Market Value (USD Million) by Dosage Type, 2025-2035
  • Figure 146: Eastern Europe Market Value (USD Million) by Dose Configuration, 2025-2035
  • Figure 147: Eastern Europe Market Value (USD Million) by Distribution channels, 2025-2035
  • Figure 148: Eastern Europe Market Value (USD Million) by Country, 2025-2035
  • Figure 149: Eastern Europe Market Value (USD Million) Analysis by Country, 2020-2035
  • Figure 150: Eastern Europe Market Volume (Units) Analysis by Country, 2020-2035
  • Figure 151: Eastern Europe Market Value Share (%) and BPS Analysis by Country, 2025-2035
  • Figure 152: Eastern Europe Market Y-o-Y Growth (%) Projections by Country, 2025-2035
  • Figure 153: Eastern Europe Market Value (USD Million) Analysis by Dosage Type, 2020-2035
  • Figure 154: Eastern Europe Market Volume (Units) Analysis by Dosage Type, 2020-2035
  • Figure 155: Eastern Europe Market Value Share (%) and BPS Analysis by Dosage Type, 2025-2035
  • Figure 156: Eastern Europe Market Y-o-Y Growth (%) Projections by Dosage Type, 2025-2035
  • Figure 157: Eastern Europe Market Value (USD Million) Analysis by Dose Configuration, 2020-2035
  • Figure 158: Eastern Europe Market Volume (Units) Analysis by Dose Configuration, 2020-2035
  • Figure 159: Eastern Europe Market Value Share (%) and BPS Analysis by Dose Configuration, 2025-2035
  • Figure 160: Eastern Europe Market Y-o-Y Growth (%) Projections by Dose Configuration, 2025-2035
  • Figure 161: Eastern Europe Market Value (USD Million) Analysis by Distribution channels, 2020-2035
  • Figure 162: Eastern Europe Market Volume (Units) Analysis by Distribution channels, 2020-2035
  • Figure 163: Eastern Europe Market Value Share (%) and BPS Analysis by Distribution channels, 2025-2035
  • Figure 164: Eastern Europe Market Y-o-Y Growth (%) Projections by Distribution channels, 2025-2035
  • Figure 165: Eastern Europe Market Attractiveness by Dosage Type, 2025-2035
  • Figure 166: Eastern Europe Market Attractiveness by Dose Configuration, 2025-2035
  • Figure 167: Eastern Europe Market Attractiveness by Distribution channels, 2025-2035
  • Figure 168: Eastern Europe Market Attractiveness by Country, 2025-2035
  • Figure 169: Middle East & Africa Market Value (USD Million) by Dosage Type, 2025-2035
  • Figure 170: Middle East & Africa Market Value (USD Million) by Dose Configuration, 2025-2035
  • Figure 171: Middle East & Africa Market Value (USD Million) by Distribution channels, 2025-2035
  • Figure 172: Middle East & Africa Market Value (USD Million) by Country, 2025-2035
  • Figure 173: Middle East & Africa Market Value (USD Million) Analysis by Country, 2020-2035
  • Figure 174: Middle East & Africa Market Volume (Units) Analysis by Country, 2020-2035
  • Figure 175: Middle East & Africa Market Value Share (%) and BPS Analysis by Country, 2025-2035
  • Figure 176: Middle East & Africa Market Y-o-Y Growth (%) Projections by Country, 2025-2035
  • Figure 177: Middle East & Africa Market Value (USD Million) Analysis by Dosage Type, 2020-2035
  • Figure 178: Middle East & Africa Market Volume (Units) Analysis by Dosage Type, 2020-2035
  • Figure 179: Middle East & Africa Market Value Share (%) and BPS Analysis by Dosage Type, 2025-2035
  • Figure 180: Middle East & Africa Market Y-o-Y Growth (%) Projections by Dosage Type, 2025-2035
  • Figure 181: Middle East & Africa Market Value (USD Million) Analysis by Dose Configuration, 2020-2035
  • Figure 182: Middle East & Africa Market Volume (Units) Analysis by Dose Configuration, 2020-2035
  • Figure 183: Middle East & Africa Market Value Share (%) and BPS Analysis by Dose Configuration, 2025-2035
  • Figure 184: Middle East & Africa Market Y-o-Y Growth (%) Projections by Dose Configuration, 2025-2035
  • Figure 185: Middle East & Africa Market Value (USD Million) Analysis by Distribution channels, 2020-2035
  • Figure 186: Middle East & Africa Market Volume (Units) Analysis by Distribution channels, 2020-2035
  • Figure 187: Middle East & Africa Market Value Share (%) and BPS Analysis by Distribution channels, 2025-2035
  • Figure 188: Middle East & Africa Market Y-o-Y Growth (%) Projections by Distribution channels, 2025-2035
  • Figure 189: Middle East & Africa Market Attractiveness by Dosage Type, 2025-2035
  • Figure 190: Middle East & Africa Market Attractiveness by Dose Configuration, 2025-2035
  • Figure 191: Middle East & Africa Market Attractiveness by Distribution channels, 2025-2035
  • Figure 192: Middle East & Africa Market Attractiveness by Country, 2025-2035

Frequently Asked Questions

How big is the Nasal Congestion Treatment Devices Market in 2025?

The global Nasal Congestion Treatment Devices Market is estimated to be valued at USD 932.2 million in 2025.

What will be the size of the Nasal Congestion Treatment Devices Market in 2035?

The market size for Nasal Congestion Treatment Devices is projected to reach USD 1,393.2million by 2035.

How much will the Nasal Congestion Treatment Devices Market grow between 2025 and 2035?

The Nasal Congestion Treatment Devices Market is expected to grow at a CAGR of 4.1% during this period.

What are the key product types in the Nasal Congestion Treatment Devices Market?

Key product types include Sprays, Drops & Liquids, Gels, Powders / Dry-powder devices, and Others.

Which distribution channel will contribute a significant share in the Nasal Congestion Treatment Devices Market in 2025?

Retail pharmacies are projected to command 59.6% of the market in 2025, followed by online pharmacies / e-commerce at 20.1%.

Explore Similar Insights

Future Market Insights

Nasal Congestion Treatment Devices Market