Methodology

Nuclear Powered Merchant Vessel Market Size and Share Forecast Outlook 2025 to 2035

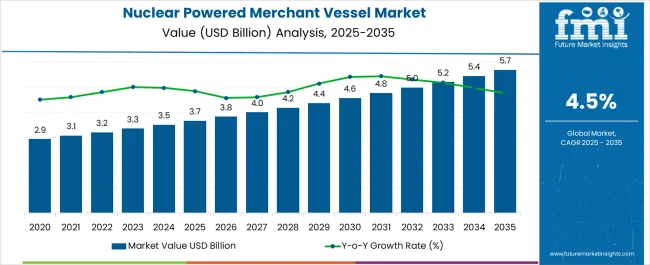
The Nuclear Powered Merchant Vessel Market is estimated to be valued at USD 3.7 billion in 2025 and is projected to reach USD 5.7 billion by 2035, registering a compound annual growth rate (CAGR) of 4.5% over the forecast period.
Quick Stats for Nuclear Powered Merchant Vessel Market

  • Nuclear Powered Merchant Vessel Market Value (2025): USD 3.7 billion
  • Nuclear Powered Merchant Vessel Market Forecast Value (2035): USD 5.7 billion
  • Nuclear Powered Merchant Vessel Market Forecast CAGR: 4.5%
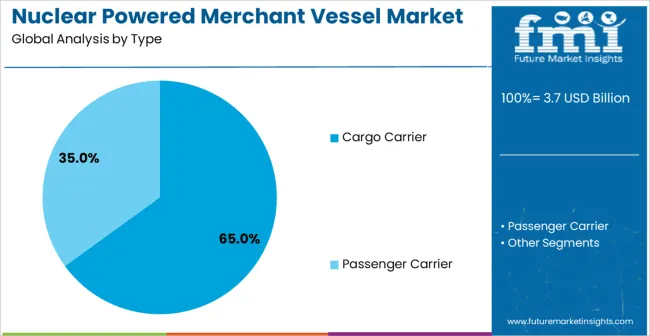
  • Leading Segment in Nuclear Powered Merchant Vessel Market in 2025: Cargo Carrier (65.0%)
  • Key Growth Regions in Nuclear Powered Merchant Vessel Market: North America, Asia-Pacific, Europe
  • Top Key Players in Nuclear Powered Merchant Vessel Market: Babcock & Wilcox, Adams Atomic Engines, Howaldtswerke Deutsche Werft AG, Yokosuka Naval Arsenal, United Shipbuilding Corporation (USC), Austal

Nuclear Powered Merchant Vessel Market Market Value Analysis

Nuclear Powered Merchant Vessel Market Key Takeaways

Metric Value
Nuclear Powered Merchant Vessel Market Estimated Value in (2025 E) USD 3.7 billion
Nuclear Powered Merchant Vessel Market Forecast Value in (2035 F) USD 5.7 billion
Forecast CAGR (2025 to 2035) 4.5%

Why is the Nuclear Powered Merchant Vessel Market Growing?

The Nuclear Powered Merchant Vessel market is experiencing significant growth driven by the increasing need for sustainable and long-range maritime transportation solutions. The market outlook is shaped by advancements in nuclear propulsion technology, which offer higher efficiency, reduced carbon emissions, and extended operational range compared to conventional fuel-powered vessels. Rising environmental regulations and international maritime policies aimed at reducing greenhouse gas emissions are encouraging the adoption of nuclear-powered merchant vessels.

Investments in infrastructure and research for safe nuclear marine propulsion are also fueling market expansion. The demand for large cargo carriers capable of transporting massive volumes across long distances without frequent refueling supports the market growth.

Additionally, the adoption of nuclear-powered vessels is influenced by the need to optimize fuel costs and enhance operational efficiency in global trade and logistics As global trade volumes continue to rise and sustainability becomes a critical priority, nuclear-powered merchant vessels are poised to play a vital role in the future of maritime transportation, with continued growth expected in both developed and emerging regions.

Segmental Analysis

The nuclear powered merchant vessel market is segmented by type, horsepower, size, load, and geographic regions. By type, nuclear powered merchant vessel market is divided into Cargo Carrier and Passenger Carrier. In terms of horsepower, nuclear powered merchant vessel market is classified into More Than 20,000 HP and Less Than 20,000 HP. Based on size, nuclear powered merchant vessel market is segmented into More 250 Mts (Nuclear Powered Merchant Vessel) and <250 Mts (Nuclear Powered Merchant Vessel). By load, nuclear powered merchant vessel market is segmented into More 50,000 Tons (Nuclear Powered Merchant Vessel) and <50,000 Tons (Nuclear Powered Merchant Vessel). Regionally, the nuclear powered merchant vessel industry is classified into North America, Latin America, Western Europe, Eastern Europe, Balkan & Baltic Countries, Russia & Belarus, Central Asia, East Asia, South Asia & Pacific, and the Middle East & Africa.
Insights into the Cargo Carrier Type Segment

Nuclear Powered Merchant Vessel Market Analysis By Type

The cargo carrier type segment is projected to hold 65.0% of the Nuclear Powered Merchant Vessel market revenue share in 2025, establishing it as the leading type. This dominance is attributed to the high demand for transporting large volumes of goods over long distances efficiently. Cargo carriers benefit from nuclear propulsion by reducing refueling stops, lowering operational costs, and ensuring uninterrupted service on global shipping routes.

The ability to integrate advanced navigation and propulsion systems further enhances their operational reliability and safety. The growth of international trade and the need for sustainable and energy-efficient transportation solutions have strengthened the prominence of cargo carriers in this market.

Additionally, regulatory incentives and environmental mandates favoring low-emission vessels contribute to their widespread adoption The segment’s adaptability to different shipping routes and cargo types ensures its sustained leadership in the nuclear-powered merchant vessel market.
Insights into the More Than 20,000 HP Horsepower Segment

Nuclear Powered Merchant Vessel Market Analysis By Horsepower

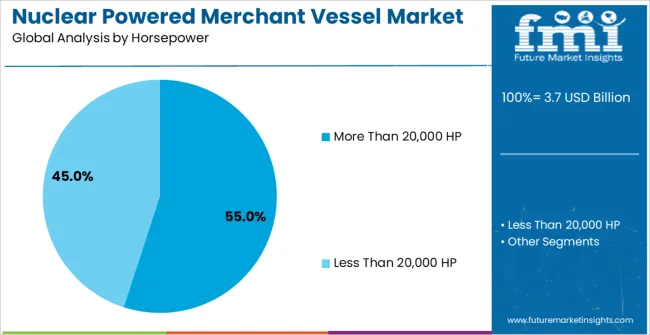
The more than 20,000 HP horsepower segment is expected to capture 55.0% of the market revenue share in 2025, making it the leading horsepower class. This growth is driven by the increasing requirement for high-powered vessels capable of transporting heavy loads efficiently over long distances.

Higher horsepower enables nuclear-powered vessels to maintain consistent speeds, navigate challenging maritime conditions, and optimize fuel consumption. The demand for operational efficiency, coupled with the ability to cover vast oceanic routes without refueling, reinforces the adoption of high-powered vessels.

Investments in advanced nuclear propulsion systems that deliver reliable and sustainable energy further support the segment’s growth As global maritime trade continues to expand, vessels with more than 20,000 HP are anticipated to remain a preferred choice for large-scale cargo transportation, ensuring operational excellence and compliance with environmental standards.
Insights into the More Than 250 Mts Size Segment

Nuclear Powered Merchant Vessel Market Analysis By Size

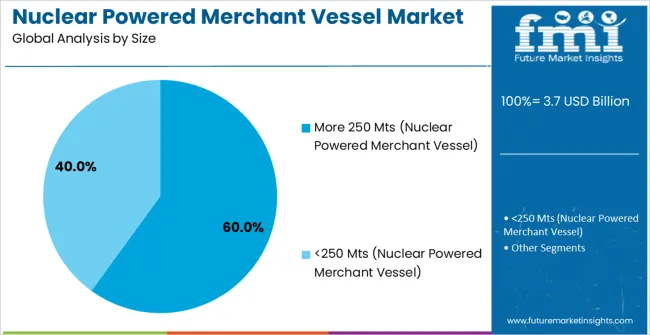
The more than 250 Mts size segment is projected to hold 60.0% of the market revenue share in 2025, establishing it as the leading size category. The growth of this segment is driven by the need for vessels that can accommodate high cargo volumes while ensuring efficiency and stability during long voyages.

Larger vessels benefit from nuclear propulsion by maximizing fuel efficiency, reducing operational costs, and enabling extended travel without frequent stops. The adoption of advanced design and engineering techniques enhances the safety, durability, and reliability of these large nuclear-powered merchant vessels.

The increasing scale of international trade and demand for energy-efficient, low-emission transport solutions have reinforced the prominence of vessels exceeding 250 Mts in length The combination of size, capacity, and nuclear propulsion makes this segment highly attractive for operators seeking to optimize logistics and sustainability in maritime transportation.

Market Overview

Nuclear Powered Merchant Vessel Market: Market Outlook

Nuclear energy has been used to drive a range of of carg ovessels including merchant, military and ice-breaker ships. A trading vessel or merchant vessel is a ship or boat that are used to transport passenger or cargo for hire.

Conventionally, merchant vessel/ships use diesel powered engine to burn the fuel and that drive the turbines. However, with the evaluation of technology the ships are now powered by nuclear reactor to drive the engines. Nuclear powered merchant vessel/ships uses central, internally constrained consumption & storage system instead of storing fluctuating and large quantities of fuels.

In 1950s, the world was introduced to an economical, thimble sized amount of nuclear material powering a vessel.

Most the countries have developed their individual nuclear powered merchant vessel. For instance, USA launched the NS Savannah – passenger cargo ship, Japan manufactured the Mutsu (which was decommissioned after a solo test run), Germany made the Otto Hahn (carried ore for nearly a decade) and Russia made the Sevmorput that carried cargo until 2025.

Henceforth, most the countries have their own nuclear powered merchant vessel to carry the passenger or cargo from place to other
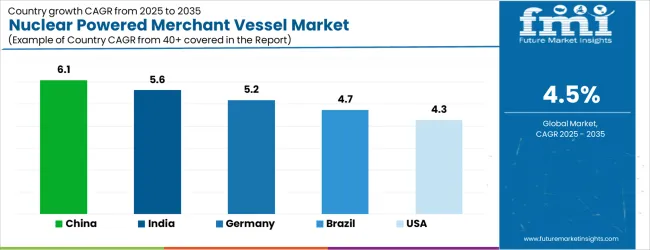
Analysis of Nuclear Powered Merchant Vessel Market By Key Countries

Nuclear Powered Merchant Vessel Market Cagr Analysis By Country

Country CAGR
China 6.1%
India 5.6%
Germany 5.2%
Brazil 4.7%
USA 4.3%
UK 3.8%
Japan 3.4%

Country-wise Analysis

The Nuclear Powered Merchant Vessel Market is expected to register a CAGR of 4.5% during the forecast period, exhibiting varied country level momentum. China leads with the highest CAGR of 6.1%, followed by India at 5.6%. Developed markets such as Germany, France, and the UK continue to expand steadily, while the USA is likely to grow at consistent rates. Japan posts the lowest CAGR at 3.4%, yet still underscores a broadly positive trajectory for the global Nuclear Powered Merchant Vessel Market. In 2024, Germany held a dominant revenue in the Western Europe market and is expected to grow with a CAGR of 5.2%. The USA Nuclear Powered Merchant Vessel Market is estimated to be valued at USD 1.3 billion in 2025 and is anticipated to reach a valuation of USD 1.3 billion by 2035. Sales are projected to rise at a CAGR of 0.0% over the forecast period between 2025 and 2035. While Japan and South Korea markets are estimated to be valued at USD 165.1 million and USD 93.3 million respectively in 2025.
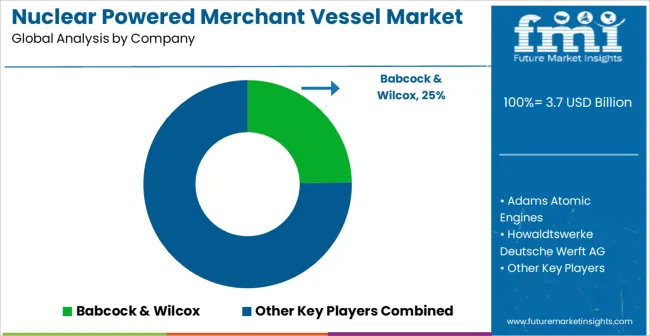
Key Players in the Nuclear Powered Merchant Vessel Market

Nuclear Powered Merchant Vessel Market Analysis By Company

  • Babcock & Wilcox
  • Adams Atomic Engines
  • Howaldtswerke Deutsche Werft AG
  • Yokosuka Naval Arsenal
  • United Shipbuilding Corporation (USC)
  • Austal

Scope of the Report

Item Value
Quantitative Units USD 3.7 Billion
Type Cargo Carrier and Passenger Carrier
Horsepower More Than 20,000 HP and Less Than 20,000 HP
Size More 250 Mts (Nuclear Powered Merchant Vessel) and <250 Mts (Nuclear Powered Merchant Vessel)
Load More 50,000 Tons (Nuclear Powered Merchant Vessel) and <50,000 Tons (Nuclear Powered Merchant Vessel)
Regions Covered North America, Europe, Asia-Pacific, Latin America, Middle East & Africa
Country Covered United States, Canada, Germany, France, United Kingdom, China, Japan, India, Brazil, South Africa
Key Companies Profiled Babcock & Wilcox, Adams Atomic Engines, Howaldtswerke Deutsche Werft AG, Yokosuka Naval Arsenal, United Shipbuilding Corporation (USC), and Austal

Nuclear Powered Merchant Vessel Market by Segments

Type:

  • Cargo Carrier
  • Passenger Carrier

Horsepower:

  • More Than 20,000 HP
  • Less Than 20,000 HP

Size:

  • More 250 Mts (Nuclear Powered Merchant Vessel)
  • <250 Mts (Nuclear Powered Merchant Vessel)

Load:

  • More 50,000 Tons (Nuclear Powered Merchant Vessel)
  • <50,000 Tons (Nuclear Powered Merchant Vessel)

Region:

  • North America
    • USA
    • Canada
    • Mexico
  • Latin America
    • Brazil
    • Chile
    • Rest of Latin America
  • Western Europe
    • Germany
    • UK
    • Italy
    • Spain
    • France
    • Nordic
    • BENELUX
    • Rest of Western Europe
  • Eastern Europe
    • Russia
    • Poland
    • Hungary
    • Balkan & Baltic
    • Rest of Eastern Europe
  • East Asia
    • China
    • Japan
    • South Korea
  • South Asia and Pacific
    • India
    • ASEAN
    • Australia & New Zealand
    • Rest of South Asia and Pacific
  • Middle East & Africa
    • Kingdom of Saudi Arabia
    • Other GCC Countries
    • Turkiye
    • South Africa
    • Other African Union
    • Rest of Middle East & Africa

Frequently Asked Questions

How big is the nuclear powered merchant vessel market in 2025?

The global nuclear powered merchant vessel market is estimated to be valued at USD 3.7 billion in 2025.

What will be the size of nuclear powered merchant vessel market in 2035?

The market size for the nuclear powered merchant vessel market is projected to reach USD 5.7 billion by 2035.

How much will be the nuclear powered merchant vessel market growth between 2025 and 2035?

The nuclear powered merchant vessel market is expected to grow at a 4.5% CAGR between 2025 and 2035.

What are the key product types in the nuclear powered merchant vessel market?

The key product types in nuclear powered merchant vessel market are cargo carrier and passenger carrier.

Which horsepower segment to contribute significant share in the nuclear powered merchant vessel market in 2025?

In terms of horsepower, more than 20,000 hp segment to command 55.0% share in the nuclear powered merchant vessel market in 2025.

Table of Content

  1. Executive Summary
    • Global Market Outlook
    • Demand-side Trends
    • Supply-side Trends
    • Technology Roadmap Analysis
    • Analysis and Recommendations
  2. Market Overview
    • Market Coverage / Taxonomy
    • Market Definition / Scope / Limitations
  3. Market Background
    • Market Dynamics
      • Drivers
      • Restraints
      • Opportunity
      • Trends
    • Scenario Forecast
      • Demand in Optimistic Scenario
      • Demand in Likely Scenario
      • Demand in Conservative Scenario
    • Opportunity Map Analysis
    • Product Life Cycle Analysis
    • Supply Chain Analysis
    • Investment Feasibility Matrix
    • Value Chain Analysis
    • PESTLE and Porter’s Analysis
    • Regulatory Landscape
    • Regional Parent Market Outlook
    • Production and Consumption Statistics
    • Import and Export Statistics
  4. Global Market Analysis 2020 to 2024 and Forecast, 2025 to 2035
    • Historical Market Size Value (USD Million) Analysis, 2020 to 2024
    • Current and Future Market Size Value (USD Million) Projections, 2025 to 2035
      • Y-o-Y Growth Trend Analysis
      • Absolute $ Opportunity Analysis
  5. Global Market Pricing Analysis 2020 to 2024 and Forecast 2025 to 2035
  6. Global Market Analysis 2020 to 2024 and Forecast 2025 to 2035, By Type
    • Introduction / Key Findings
    • Historical Market Size Value (USD Million) Analysis By Type , 2020 to 2024
    • Current and Future Market Size Value (USD Million) Analysis and Forecast By Type , 2025 to 2035
      • Cargo Carrier
      • Passenger Carrier
    • Y-o-Y Growth Trend Analysis By Type , 2020 to 2024
    • Absolute $ Opportunity Analysis By Type , 2025 to 2035
  7. Global Market Analysis 2020 to 2024 and Forecast 2025 to 2035, By Horsepower
    • Introduction / Key Findings
    • Historical Market Size Value (USD Million) Analysis By Horsepower, 2020 to 2024
    • Current and Future Market Size Value (USD Million) Analysis and Forecast By Horsepower, 2025 to 2035
      • More Than 20,000 HP
      • Less Than 20,000 HP
    • Y-o-Y Growth Trend Analysis By Horsepower, 2020 to 2024
    • Absolute $ Opportunity Analysis By Horsepower, 2025 to 2035
  8. Global Market Analysis 2020 to 2024 and Forecast 2025 to 2035, By Size
    • Introduction / Key Findings
    • Historical Market Size Value (USD Million) Analysis By Size, 2020 to 2024
    • Current and Future Market Size Value (USD Million) Analysis and Forecast By Size, 2025 to 2035
      • More 250 Mts ()
      • <250 Mts ()
    • Y-o-Y Growth Trend Analysis By Size, 2020 to 2024
    • Absolute $ Opportunity Analysis By Size, 2025 to 2035
  9. Global Market Analysis 2020 to 2024 and Forecast 2025 to 2035, By Load
    • Introduction / Key Findings
    • Historical Market Size Value (USD Million) Analysis By Load, 2020 to 2024
    • Current and Future Market Size Value (USD Million) Analysis and Forecast By Load, 2025 to 2035
      • More 50,000 Tons ()
      • <50,000 Tons ()
    • Y-o-Y Growth Trend Analysis By Load, 2020 to 2024
    • Absolute $ Opportunity Analysis By Load, 2025 to 2035
  10. Global Market Analysis 2020 to 2024 and Forecast 2025 to 2035, By Region
    • Introduction
    • Historical Market Size Value (USD Million) Analysis By Region, 2020 to 2024
    • Current Market Size Value (USD Million) Analysis and Forecast By Region, 2025 to 2035
      • North America
      • Latin America
      • Western Europe
      • Eastern Europe
      • East Asia
      • South Asia and Pacific
      • Middle East & Africa
    • Market Attractiveness Analysis By Region
  11. North America Market Analysis 2020 to 2024 and Forecast 2025 to 2035, By Country
    • Historical Market Size Value (USD Million) Trend Analysis By Market Taxonomy, 2020 to 2024
    • Market Size Value (USD Million) Forecast By Market Taxonomy, 2025 to 2035
      • By Country
        • USA
        • Canada
        • Mexico
      • By Type
      • By Horsepower
      • By Size
      • By Load
    • Market Attractiveness Analysis
      • By Country
      • By Type
      • By Horsepower
      • By Size
      • By Load
    • Key Takeaways
  12. Latin America Market Analysis 2020 to 2024 and Forecast 2025 to 2035, By Country
    • Historical Market Size Value (USD Million) Trend Analysis By Market Taxonomy, 2020 to 2024
    • Market Size Value (USD Million) Forecast By Market Taxonomy, 2025 to 2035
      • By Country
        • Brazil
        • Chile
        • Rest of Latin America
      • By Type
      • By Horsepower
      • By Size
      • By Load
    • Market Attractiveness Analysis
      • By Country
      • By Type
      • By Horsepower
      • By Size
      • By Load
    • Key Takeaways
  13. Western Europe Market Analysis 2020 to 2024 and Forecast 2025 to 2035, By Country
    • Historical Market Size Value (USD Million) Trend Analysis By Market Taxonomy, 2020 to 2024
    • Market Size Value (USD Million) Forecast By Market Taxonomy, 2025 to 2035
      • By Country
        • Germany
        • UK
        • Italy
        • Spain
        • France
        • Nordic
        • BENELUX
        • Rest of Western Europe
      • By Type
      • By Horsepower
      • By Size
      • By Load
    • Market Attractiveness Analysis
      • By Country
      • By Type
      • By Horsepower
      • By Size
      • By Load
    • Key Takeaways
  14. Eastern Europe Market Analysis 2020 to 2024 and Forecast 2025 to 2035, By Country
    • Historical Market Size Value (USD Million) Trend Analysis By Market Taxonomy, 2020 to 2024
    • Market Size Value (USD Million) Forecast By Market Taxonomy, 2025 to 2035
      • By Country
        • Russia
        • Poland
        • Hungary
        • Balkan & Baltic
        • Rest of Eastern Europe
      • By Type
      • By Horsepower
      • By Size
      • By Load
    • Market Attractiveness Analysis
      • By Country
      • By Type
      • By Horsepower
      • By Size
      • By Load
    • Key Takeaways
  15. East Asia Market Analysis 2020 to 2024 and Forecast 2025 to 2035, By Country
    • Historical Market Size Value (USD Million) Trend Analysis By Market Taxonomy, 2020 to 2024
    • Market Size Value (USD Million) Forecast By Market Taxonomy, 2025 to 2035
      • By Country
        • China
        • Japan
        • South Korea
      • By Type
      • By Horsepower
      • By Size
      • By Load
    • Market Attractiveness Analysis
      • By Country
      • By Type
      • By Horsepower
      • By Size
      • By Load
    • Key Takeaways
  16. South Asia and Pacific Market Analysis 2020 to 2024 and Forecast 2025 to 2035, By Country
    • Historical Market Size Value (USD Million) Trend Analysis By Market Taxonomy, 2020 to 2024
    • Market Size Value (USD Million) Forecast By Market Taxonomy, 2025 to 2035
      • By Country
        • India
        • ASEAN
        • Australia & New Zealand
        • Rest of South Asia and Pacific
      • By Type
      • By Horsepower
      • By Size
      • By Load
    • Market Attractiveness Analysis
      • By Country
      • By Type
      • By Horsepower
      • By Size
      • By Load
    • Key Takeaways
  17. Middle East & Africa Market Analysis 2020 to 2024 and Forecast 2025 to 2035, By Country
    • Historical Market Size Value (USD Million) Trend Analysis By Market Taxonomy, 2020 to 2024
    • Market Size Value (USD Million) Forecast By Market Taxonomy, 2025 to 2035
      • By Country
        • Kingdom of Saudi Arabia
        • Other GCC Countries
        • Turkiye
        • South Africa
        • Other African Union
        • Rest of Middle East & Africa
      • By Type
      • By Horsepower
      • By Size
      • By Load
    • Market Attractiveness Analysis
      • By Country
      • By Type
      • By Horsepower
      • By Size
      • By Load
    • Key Takeaways
  18. Key Countries Market Analysis
    • USA
      • Pricing Analysis
      • Market Share Analysis, 2024
        • By Type
        • By Horsepower
        • By Size
        • By Load
    • Canada
      • Pricing Analysis
      • Market Share Analysis, 2024
        • By Type
        • By Horsepower
        • By Size
        • By Load
    • Mexico
      • Pricing Analysis
      • Market Share Analysis, 2024
        • By Type
        • By Horsepower
        • By Size
        • By Load
    • Brazil
      • Pricing Analysis
      • Market Share Analysis, 2024
        • By Type
        • By Horsepower
        • By Size
        • By Load
    • Chile
      • Pricing Analysis
      • Market Share Analysis, 2024
        • By Type
        • By Horsepower
        • By Size
        • By Load
    • Germany
      • Pricing Analysis
      • Market Share Analysis, 2024
        • By Type
        • By Horsepower
        • By Size
        • By Load
    • UK
      • Pricing Analysis
      • Market Share Analysis, 2024
        • By Type
        • By Horsepower
        • By Size
        • By Load
    • Italy
      • Pricing Analysis
      • Market Share Analysis, 2024
        • By Type
        • By Horsepower
        • By Size
        • By Load
    • Spain
      • Pricing Analysis
      • Market Share Analysis, 2024
        • By Type
        • By Horsepower
        • By Size
        • By Load
    • France
      • Pricing Analysis
      • Market Share Analysis, 2024
        • By Type
        • By Horsepower
        • By Size
        • By Load
    • India
      • Pricing Analysis
      • Market Share Analysis, 2024
        • By Type
        • By Horsepower
        • By Size
        • By Load
    • ASEAN
      • Pricing Analysis
      • Market Share Analysis, 2024
        • By Type
        • By Horsepower
        • By Size
        • By Load
    • Australia & New Zealand
      • Pricing Analysis
      • Market Share Analysis, 2024
        • By Type
        • By Horsepower
        • By Size
        • By Load
    • China
      • Pricing Analysis
      • Market Share Analysis, 2024
        • By Type
        • By Horsepower
        • By Size
        • By Load
    • Japan
      • Pricing Analysis
      • Market Share Analysis, 2024
        • By Type
        • By Horsepower
        • By Size
        • By Load
    • South Korea
      • Pricing Analysis
      • Market Share Analysis, 2024
        • By Type
        • By Horsepower
        • By Size
        • By Load
    • Russia
      • Pricing Analysis
      • Market Share Analysis, 2024
        • By Type
        • By Horsepower
        • By Size
        • By Load
    • Poland
      • Pricing Analysis
      • Market Share Analysis, 2024
        • By Type
        • By Horsepower
        • By Size
        • By Load
    • Hungary
      • Pricing Analysis
      • Market Share Analysis, 2024
        • By Type
        • By Horsepower
        • By Size
        • By Load
    • Kingdom of Saudi Arabia
      • Pricing Analysis
      • Market Share Analysis, 2024
        • By Type
        • By Horsepower
        • By Size
        • By Load
    • Turkiye
      • Pricing Analysis
      • Market Share Analysis, 2024
        • By Type
        • By Horsepower
        • By Size
        • By Load
    • South Africa
      • Pricing Analysis
      • Market Share Analysis, 2024
        • By Type
        • By Horsepower
        • By Size
        • By Load
  19. Market Structure Analysis
    • Competition Dashboard
    • Competition Benchmarking
    • Market Share Analysis of Top Players
      • By Regional
      • By Type
      • By Horsepower
      • By Size
      • By Load
  20. Competition Analysis
    • Competition Deep Dive
      • Babcock & Wilcox
        • Overview
        • Product Portfolio
        • Profitability by Market Segments (Product/Age /Sales Channel/Region)
        • Sales Footprint
        • Strategy Overview
          • Marketing Strategy
          • Product Strategy
          • Channel Strategy
      • Adams Atomic Engines
      • Howaldtswerke Deutsche Werft AG
      • Yokosuka Naval Arsenal
      • Value (USD Million)ed Shipbuilding Corporation (USC)
      • Austal
  21. Assumptions & Acronyms Used
  22. Research Methodology

List of Tables

  • Table 1: Global Market Value (USD Million) Forecast by Region, 2020 to 2035
  • Table 2: Global Market Value (USD Million) Forecast by Type , 2020 to 2035
  • Table 3: Global Market Value (USD Million) Forecast by Horsepower, 2020 to 2035
  • Table 4: Global Market Value (USD Million) Forecast by Size, 2020 to 2035
  • Table 5: Global Market Value (USD Million) Forecast by Load, 2020 to 2035
  • Table 6: North America Market Value (USD Million) Forecast by Country, 2020 to 2035
  • Table 7: North America Market Value (USD Million) Forecast by Type , 2020 to 2035
  • Table 8: North America Market Value (USD Million) Forecast by Horsepower, 2020 to 2035
  • Table 9: North America Market Value (USD Million) Forecast by Size, 2020 to 2035
  • Table 10: North America Market Value (USD Million) Forecast by Load, 2020 to 2035
  • Table 11: Latin America Market Value (USD Million) Forecast by Country, 2020 to 2035
  • Table 12: Latin America Market Value (USD Million) Forecast by Type , 2020 to 2035
  • Table 13: Latin America Market Value (USD Million) Forecast by Horsepower, 2020 to 2035
  • Table 14: Latin America Market Value (USD Million) Forecast by Size, 2020 to 2035
  • Table 15: Latin America Market Value (USD Million) Forecast by Load, 2020 to 2035
  • Table 16: Western Europe Market Value (USD Million) Forecast by Country, 2020 to 2035
  • Table 17: Western Europe Market Value (USD Million) Forecast by Type , 2020 to 2035
  • Table 18: Western Europe Market Value (USD Million) Forecast by Horsepower, 2020 to 2035
  • Table 19: Western Europe Market Value (USD Million) Forecast by Size, 2020 to 2035
  • Table 20: Western Europe Market Value (USD Million) Forecast by Load, 2020 to 2035
  • Table 21: Eastern Europe Market Value (USD Million) Forecast by Country, 2020 to 2035
  • Table 22: Eastern Europe Market Value (USD Million) Forecast by Type , 2020 to 2035
  • Table 23: Eastern Europe Market Value (USD Million) Forecast by Horsepower, 2020 to 2035
  • Table 24: Eastern Europe Market Value (USD Million) Forecast by Size, 2020 to 2035
  • Table 25: Eastern Europe Market Value (USD Million) Forecast by Load, 2020 to 2035
  • Table 26: East Asia Market Value (USD Million) Forecast by Country, 2020 to 2035
  • Table 27: East Asia Market Value (USD Million) Forecast by Type , 2020 to 2035
  • Table 28: East Asia Market Value (USD Million) Forecast by Horsepower, 2020 to 2035
  • Table 29: East Asia Market Value (USD Million) Forecast by Size, 2020 to 2035
  • Table 30: East Asia Market Value (USD Million) Forecast by Load, 2020 to 2035
  • Table 31: South Asia and Pacific Market Value (USD Million) Forecast by Country, 2020 to 2035
  • Table 32: South Asia and Pacific Market Value (USD Million) Forecast by Type , 2020 to 2035
  • Table 33: South Asia and Pacific Market Value (USD Million) Forecast by Horsepower, 2020 to 2035
  • Table 34: South Asia and Pacific Market Value (USD Million) Forecast by Size, 2020 to 2035
  • Table 35: South Asia and Pacific Market Value (USD Million) Forecast by Load, 2020 to 2035
  • Table 36: Middle East & Africa Market Value (USD Million) Forecast by Country, 2020 to 2035
  • Table 37: Middle East & Africa Market Value (USD Million) Forecast by Type , 2020 to 2035
  • Table 38: Middle East & Africa Market Value (USD Million) Forecast by Horsepower, 2020 to 2035
  • Table 39: Middle East & Africa Market Value (USD Million) Forecast by Size, 2020 to 2035
  • Table 40: Middle East & Africa Market Value (USD Million) Forecast by Load, 2020 to 2035

List of Figures

  • Figure 1: Global Market Pricing Analysis
  • Figure 2: Global Market Value (USD Million) Forecast 2020-2035
  • Figure 3: Global Market Value Share and BPS Analysis by Type , 2025 and 2035
  • Figure 4: Global Market Y-o-Y Growth Comparison by Type , 2025-2035
  • Figure 5: Global Market Attractiveness Analysis by Type
  • Figure 6: Global Market Value Share and BPS Analysis by Horsepower, 2025 and 2035
  • Figure 7: Global Market Y-o-Y Growth Comparison by Horsepower, 2025-2035
  • Figure 8: Global Market Attractiveness Analysis by Horsepower
  • Figure 9: Global Market Value Share and BPS Analysis by Size, 2025 and 2035
  • Figure 10: Global Market Y-o-Y Growth Comparison by Size, 2025-2035
  • Figure 11: Global Market Attractiveness Analysis by Size
  • Figure 12: Global Market Value Share and BPS Analysis by Load, 2025 and 2035
  • Figure 13: Global Market Y-o-Y Growth Comparison by Load, 2025-2035
  • Figure 14: Global Market Attractiveness Analysis by Load
  • Figure 15: Global Market Value (USD Million) Share and BPS Analysis by Region, 2025 and 2035
  • Figure 16: Global Market Y-o-Y Growth Comparison by Region, 2025-2035
  • Figure 17: Global Market Attractiveness Analysis by Region
  • Figure 18: North America Market Incremental Dollar Opportunity, 2025-2035
  • Figure 19: Latin America Market Incremental Dollar Opportunity, 2025-2035
  • Figure 20: Western Europe Market Incremental Dollar Opportunity, 2025-2035
  • Figure 21: Eastern Europe Market Incremental Dollar Opportunity, 2025-2035
  • Figure 22: East Asia Market Incremental Dollar Opportunity, 2025-2035
  • Figure 23: South Asia and Pacific Market Incremental Dollar Opportunity, 2025-2035
  • Figure 24: Middle East & Africa Market Incremental Dollar Opportunity, 2025-2035
  • Figure 25: North America Market Value Share and BPS Analysis by Country, 2025 and 2035
  • Figure 26: North America Market Value Share and BPS Analysis by Type , 2025 and 2035
  • Figure 27: North America Market Y-o-Y Growth Comparison by Type , 2025-2035
  • Figure 28: North America Market Attractiveness Analysis by Type
  • Figure 29: North America Market Value Share and BPS Analysis by Horsepower, 2025 and 2035
  • Figure 30: North America Market Y-o-Y Growth Comparison by Horsepower, 2025-2035
  • Figure 31: North America Market Attractiveness Analysis by Horsepower
  • Figure 32: North America Market Value Share and BPS Analysis by Size, 2025 and 2035
  • Figure 33: North America Market Y-o-Y Growth Comparison by Size, 2025-2035
  • Figure 34: North America Market Attractiveness Analysis by Size
  • Figure 35: North America Market Value Share and BPS Analysis by Load, 2025 and 2035
  • Figure 36: North America Market Y-o-Y Growth Comparison by Load, 2025-2035
  • Figure 37: North America Market Attractiveness Analysis by Load
  • Figure 38: Latin America Market Value Share and BPS Analysis by Country, 2025 and 2035
  • Figure 39: Latin America Market Value Share and BPS Analysis by Type , 2025 and 2035
  • Figure 40: Latin America Market Y-o-Y Growth Comparison by Type , 2025-2035
  • Figure 41: Latin America Market Attractiveness Analysis by Type
  • Figure 42: Latin America Market Value Share and BPS Analysis by Horsepower, 2025 and 2035
  • Figure 43: Latin America Market Y-o-Y Growth Comparison by Horsepower, 2025-2035
  • Figure 44: Latin America Market Attractiveness Analysis by Horsepower
  • Figure 45: Latin America Market Value Share and BPS Analysis by Size, 2025 and 2035
  • Figure 46: Latin America Market Y-o-Y Growth Comparison by Size, 2025-2035
  • Figure 47: Latin America Market Attractiveness Analysis by Size
  • Figure 48: Latin America Market Value Share and BPS Analysis by Load, 2025 and 2035
  • Figure 49: Latin America Market Y-o-Y Growth Comparison by Load, 2025-2035
  • Figure 50: Latin America Market Attractiveness Analysis by Load
  • Figure 51: Western Europe Market Value Share and BPS Analysis by Country, 2025 and 2035
  • Figure 52: Western Europe Market Value Share and BPS Analysis by Type , 2025 and 2035
  • Figure 53: Western Europe Market Y-o-Y Growth Comparison by Type , 2025-2035
  • Figure 54: Western Europe Market Attractiveness Analysis by Type
  • Figure 55: Western Europe Market Value Share and BPS Analysis by Horsepower, 2025 and 2035
  • Figure 56: Western Europe Market Y-o-Y Growth Comparison by Horsepower, 2025-2035
  • Figure 57: Western Europe Market Attractiveness Analysis by Horsepower
  • Figure 58: Western Europe Market Value Share and BPS Analysis by Size, 2025 and 2035
  • Figure 59: Western Europe Market Y-o-Y Growth Comparison by Size, 2025-2035
  • Figure 60: Western Europe Market Attractiveness Analysis by Size
  • Figure 61: Western Europe Market Value Share and BPS Analysis by Load, 2025 and 2035
  • Figure 62: Western Europe Market Y-o-Y Growth Comparison by Load, 2025-2035
  • Figure 63: Western Europe Market Attractiveness Analysis by Load
  • Figure 64: Eastern Europe Market Value Share and BPS Analysis by Country, 2025 and 2035
  • Figure 65: Eastern Europe Market Value Share and BPS Analysis by Type , 2025 and 2035
  • Figure 66: Eastern Europe Market Y-o-Y Growth Comparison by Type , 2025-2035
  • Figure 67: Eastern Europe Market Attractiveness Analysis by Type
  • Figure 68: Eastern Europe Market Value Share and BPS Analysis by Horsepower, 2025 and 2035
  • Figure 69: Eastern Europe Market Y-o-Y Growth Comparison by Horsepower, 2025-2035
  • Figure 70: Eastern Europe Market Attractiveness Analysis by Horsepower
  • Figure 71: Eastern Europe Market Value Share and BPS Analysis by Size, 2025 and 2035
  • Figure 72: Eastern Europe Market Y-o-Y Growth Comparison by Size, 2025-2035
  • Figure 73: Eastern Europe Market Attractiveness Analysis by Size
  • Figure 74: Eastern Europe Market Value Share and BPS Analysis by Load, 2025 and 2035
  • Figure 75: Eastern Europe Market Y-o-Y Growth Comparison by Load, 2025-2035
  • Figure 76: Eastern Europe Market Attractiveness Analysis by Load
  • Figure 77: East Asia Market Value Share and BPS Analysis by Country, 2025 and 2035
  • Figure 78: East Asia Market Value Share and BPS Analysis by Type , 2025 and 2035
  • Figure 79: East Asia Market Y-o-Y Growth Comparison by Type , 2025-2035
  • Figure 80: East Asia Market Attractiveness Analysis by Type
  • Figure 81: East Asia Market Value Share and BPS Analysis by Horsepower, 2025 and 2035
  • Figure 82: East Asia Market Y-o-Y Growth Comparison by Horsepower, 2025-2035
  • Figure 83: East Asia Market Attractiveness Analysis by Horsepower
  • Figure 84: East Asia Market Value Share and BPS Analysis by Size, 2025 and 2035
  • Figure 85: East Asia Market Y-o-Y Growth Comparison by Size, 2025-2035
  • Figure 86: East Asia Market Attractiveness Analysis by Size
  • Figure 87: East Asia Market Value Share and BPS Analysis by Load, 2025 and 2035
  • Figure 88: East Asia Market Y-o-Y Growth Comparison by Load, 2025-2035
  • Figure 89: East Asia Market Attractiveness Analysis by Load
  • Figure 90: South Asia and Pacific Market Value Share and BPS Analysis by Country, 2025 and 2035
  • Figure 91: South Asia and Pacific Market Value Share and BPS Analysis by Type , 2025 and 2035
  • Figure 92: South Asia and Pacific Market Y-o-Y Growth Comparison by Type , 2025-2035
  • Figure 93: South Asia and Pacific Market Attractiveness Analysis by Type
  • Figure 94: South Asia and Pacific Market Value Share and BPS Analysis by Horsepower, 2025 and 2035
  • Figure 95: South Asia and Pacific Market Y-o-Y Growth Comparison by Horsepower, 2025-2035
  • Figure 96: South Asia and Pacific Market Attractiveness Analysis by Horsepower
  • Figure 97: South Asia and Pacific Market Value Share and BPS Analysis by Size, 2025 and 2035
  • Figure 98: South Asia and Pacific Market Y-o-Y Growth Comparison by Size, 2025-2035
  • Figure 99: South Asia and Pacific Market Attractiveness Analysis by Size
  • Figure 100: South Asia and Pacific Market Value Share and BPS Analysis by Load, 2025 and 2035
  • Figure 101: South Asia and Pacific Market Y-o-Y Growth Comparison by Load, 2025-2035
  • Figure 102: South Asia and Pacific Market Attractiveness Analysis by Load
  • Figure 103: Middle East & Africa Market Value Share and BPS Analysis by Country, 2025 and 2035
  • Figure 104: Middle East & Africa Market Value Share and BPS Analysis by Type , 2025 and 2035
  • Figure 105: Middle East & Africa Market Y-o-Y Growth Comparison by Type , 2025-2035
  • Figure 106: Middle East & Africa Market Attractiveness Analysis by Type
  • Figure 107: Middle East & Africa Market Value Share and BPS Analysis by Horsepower, 2025 and 2035
  • Figure 108: Middle East & Africa Market Y-o-Y Growth Comparison by Horsepower, 2025-2035
  • Figure 109: Middle East & Africa Market Attractiveness Analysis by Horsepower
  • Figure 110: Middle East & Africa Market Value Share and BPS Analysis by Size, 2025 and 2035
  • Figure 111: Middle East & Africa Market Y-o-Y Growth Comparison by Size, 2025-2035
  • Figure 112: Middle East & Africa Market Attractiveness Analysis by Size
  • Figure 113: Middle East & Africa Market Value Share and BPS Analysis by Load, 2025 and 2035
  • Figure 114: Middle East & Africa Market Y-o-Y Growth Comparison by Load, 2025-2035
  • Figure 115: Middle East & Africa Market Attractiveness Analysis by Load
  • Figure 116: Global Market - Tier Structure Analysis
  • Figure 117: Global Market - Company Share Analysis
Dashboard
Dashboard
Dashboard
Dashboard
Dashboard
Dashboard

Our Research Products

Full Research Suite

The "Full Research Suite" delivers actionable market intel, deep dives on markets or technologies, so clients act faster, cut risk, and unlock growth.

Competitor Leaderboard Report

The Leaderboard benchmarks and ranks top vendors, classifying them as Established Leaders, Leading Challengers, or Disruptors & Challengers.

Future Leaders Index

Locates where complements amplify value and substitutes erode it, forecasting net impact by horizon

Market Data & Forecasts

We deliver granular, decision-grade intel: market sizing, 5-year forecasts, pricing, adoption, usage, revenue, and operational KPIs—plus competitor tracking, regulation, and value chains—across 60 countries broadly.

Market Focus Report

Spot the shifts before they hit your P&L. We track inflection points, adoption curves, pricing moves, and ecosystem plays to show where demand is heading, why it is changing, and what to do next across high-growth markets and disruptive tech

Survey Report

Real-time reads of user behavior. We track shifting priorities, perceptions of today’s and next-gen services, and provider experience, then pace how fast tech moves from trial to adoption, blending buyer, consumer, and channel inputs with social signals (#WhySwitch, #UX).

Bespoke Reports

Partner with our analyst team to build a custom report designed around your business priorities. From analysing market trends to assessing competitors or crafting bespoke datasets, we tailor insights to your needs.

Supplier Intelligence

Discovery & Profiling

Capacity & Footprint

Performance & Risk

Compliance & Governance

Commercial Readiness

Who Supplies Whom

Scorecards & Shortlists

Playbooks & Docs

Category Intelligence

Definition & Scope

Demand & Use Cases

Cost Drivers

Market Structure

Supply Chain Map

Trade & Policy

Operating Norms

Deliverables

Buyer Intelligence

Account Basics

Spend & Scope

Procurement Model

Vendor Requirements

Terms & Policies

Entry Strategy

Pain Points & Triggers

Outputs

Pricing Analysis

Benchmarks

Trends

Should-Cost

Indexation

Landed Cost

Commercial Terms

Deliverables

Brand Analysis

Positioning & Value Prop

Share & Presence

Customer Evidence

Go-to-Market

Digital & Reputation

Compliance & Trust

KPIs & Gaps

Outputs

Full Research Suite comprises of:

Market outlook & trends analysis

Market outlook & trends analysis

Interviews & case studies

Interviews & case studies

Strategic recommendations

Strategic recommendations

Vendor profiles & capabilities analysis

Vendor profiles & capabilities analysis

5-year forecasts

5-year forecasts

8 regions and 60+ country-level data splits

8 regions and 60+ country-level data splits

Market segment data splits

Market segment data splits

12 months of continuous data updates

12 months of continuous data updates

DELIVERED AS:

PDF EXCEL ONLINE

Full Research Suite


$5000

$7500

$10000

Buy Report Now
Similar Industry Reports

Similar Industry Reports

Nuclear Medicine Shielded Equipment Market

Nuclear Medicine Shielded Equipment Market Size and Share Forecast Outlook 2025 to 2035

Nuclear Engineering Service Market

Nuclear Engineering Service Market Size and Share Forecast Outlook 2025 to 2035

Nuclear Energy Consulting Service Market

Nuclear Energy Consulting Service Market Size and Share Forecast Outlook 2025 to 2035

Nuclear Robots Market

Nuclear Robots Market Size and Share Forecast Outlook 2025 to 2035

Nuclear Imaging Devices Market

Nuclear Imaging Devices Market Size and Share Forecast Outlook 2025 to 2035

Nuclear Medicine Equipment Market

Nuclear Medicine Equipment Market Size and Share Forecast Outlook 2025 to 2035

Nuclear Imaging Equipment Market

Global Nuclear Imaging Equipment Market Insights – Trends & Forecast 2024-2034

Nuclear Export Inhibitor Drugs Market

Nuclear Export Inhibitor Drugs Market

Antinuclear Antibody Test Market

Antinuclear Antibody Test Market

Therapeutic Nuclear Medicine Market

Therapeutic Nuclear Medicine Market Analysis – Size, Share & Forecast 2024-2034

Filling and Dispensing System for Nuclear Medicine Market

Filling and Dispensing System for Nuclear Medicine Market Size and Share Forecast Outlook 2025 to 2035

Plant life Extensions (PLEX) and Plant Life Management (PLIM) for Nuclear Reactors Market

Plant life Extensions (PLEX) and Plant Life Management (PLIM) for Nuclear Reactors Market

Powered Surgical Staplers Market

Powered Surgical Staplers Market Size and Share Forecast Outlook 2025 to 2035

Powered Lawn Mowers Market

Powered Lawn Mowers Market Analysis - Size, Share & Forecast 2025 to 2035

Powered Storage Devices Market

Powered Storage Devices Market

Powered Screed Market

Powered Screed Market

Unpowered Powder Classifiers Market

Unpowered Powder Classifiers Market Size and Share Forecast Outlook 2025 to 2035

AI-powered Wealth Management Solution Market

AI-powered Wealth Management Solution Market Size and Share Forecast Outlook 2025 to 2035

AI Powered Software Testing Tool Market

AI Powered Software Testing Tool Market Size and Share Forecast Outlook 2025 to 2035

AI-powered Spinal Surgery Market

AI-powered Spinal Surgery Market Size and Share Forecast Outlook 2025 to 2035

Future Market Insights

Nuclear Powered Merchant Vessel Market

Chat With MaRIA

Chat With

MaRIA

Hi There, I am MaRIA, Your Market Research Intelligence Assistant. How may I help you?