Global On-Demand Repair Services Market Size and Share Forecast Outlook 2025 to 2035

The Global On-Demand Repair Services Market is expected to record a valuation of USD 21,876.1 million in 2025 and USD 79,411.5 million in 2035, with an increase of USD 57,535.5 million, which equals a growth of 263% over the decade. The overall expansion represents a CAGR of 13.8% and a 3.6X increase in market size.
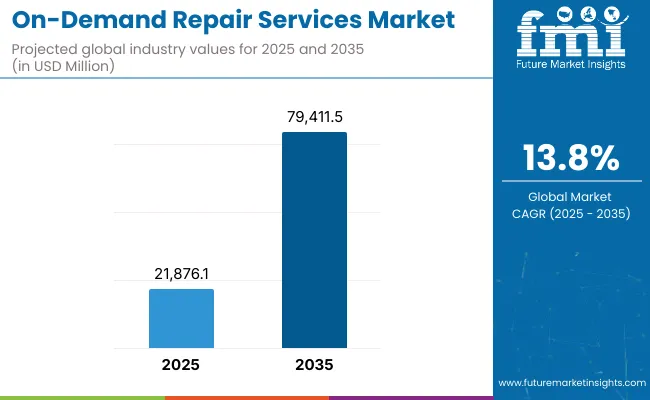
Quick Stats for Global On-Demand Repair Services Market

  • Global On-Demand Repair Services Market Value (2025): USD 21,876.1 million
  • Global On-Demand Repair Services Market Forecast Value (2035): USD 79,411.5 million
  • Global On-Demand Repair Services Market Forecast CAGR: 13.8%
  • Global On-Demand Repair Services Market Leading Segment in 2025: At-home / on-site repair (58.3%)
  • Key Growth Regions: Asia Pacific, North America, Europe
  • Top Key Players: Angi, Urban Company, Puls, Asurion Tech Repair & Solutions (uBreakiFix), Wrench, HelloTech, Onsitego, Taskrabbit, Geek Squad, HomeServe

On Demand Repair Services Market

Global On-Demand Repairs Services Market Key Takeaways

Metric Value
Market Estimated Value in (2025E) USD 21876.1 million
Market Forecast Value in (2035F) USD 79,411.5 million
Forecast CAGR (2025 to 2035) 13.8 %

During the first five-year period from 2025 to 2030, the market increases from USD 21,876.1 million to USD 41,679.8 million, adding USD 19,803.8 million, which accounts for 34.4% of the total decade growth. This phase records steady adoption across smartphones and tablets, laptops and desktops, and consumer electronics, supported by consumer preference for convenience and rapid booking. Same-day fulfills high-urgency jobs, while platform-managed technicians gain traction for quality control in B2C use cases.

The second half from 2030 to 2035 contributes USD 37,731.7 million, equal to 65.6% of total growth, as the market jumps from USD 41,679.8 million to USD 79,411.5 million. This acceleration is powered by B2B expansion with SMBs and property managers, deeper OEM-authorized partnerships, and add-on subscription or protection plans. Pickup and return plus remote diagnosis broaden coverage for major home appliances and vehicles, while subscription add-ons increase recurring revenue and lifetime value.

From 2020 to 2024, on-demand repair platforms scaled primarily through smartphones and small electronics, with marketplace and platform-managed technician models expanding city coverage and response times. Competitive differentiation focused on speed, geographic density, technician quality, and transparent pricing. Service plans and subscriptions remained emerging, contributing a modest share to revenue compared with one-off repairs.

Demand for on-demand repairs reaches USD 21,876.1 million in 2025, and the revenue mix begins to shift as subscription or protection plan add-ons increase share alongside time and materials and fixed upfront price models. Traditional home services aggregators face rising competition from digital-first platforms specializing in electronics and appliance repairs with remote diagnostics, standardized SKUs, and OEM tie-ups. Competitive advantage is moving from pure lead aggregation to end-to-end service orchestration, technician enablement, and recurring plan economics.

Why the Global On-Demand Repair Services Market is growing?

Consumer preference for convenience and faster turnaround has boosted same-day and next-day bookings. Proliferation of connected devices and larger installed bases of major home appliances have increased repairable incidents post warranty. Digital platforms improve discovery, pricing transparency, and technician utilization, while remote diagnosis reduces no-fault visits and speeds parts readiness. B2B demand from SMBs, property managers, and fleets is rising for multi-asset maintenance with SLAs. OEM-authorized networks and platform-managed models expand quality assurance, and subscription or protection plan add-ons enhance predictability and retention. Segment growth in 2025 is led by at-home / on-site repair (58.3%), same-day bookings (41.1%), and smartphones and tablets (32.4%) within asset type.

Segmental Analysis

The market is segmented by asset type, service mode, provider type, booking speed, customer type, pricing model, and region. Asset type includes smartphones & tablets, laptops & desktops, consumer electronics (TV/audio), major home appliances, home fixtures (plumbing/electrical/HVAC), and passenger cars & two-wheelers, highlighting the core categories driving adoption. Service mode classification covers at-home / on-site repair, pickup & return, and remote diagnosis / assist to cater to different customer requirements. Based on provider type, the segmentation includes platform-managed technicians, marketplace/aggregator freelancers, and OEM-authorized service networks.

In terms of booking speed, categories encompass same-day, next-day, and 3+ days. Customer type includes B2C (households) and B2B (SMBs, property managers, fleets). Pricing model segmentation covers fixed upfront price, time & materials, and subscription/protection plan add-ons. Regionally, the scope spans North America, Latin America, Europe, Asia Pacific, and the Middle East & Africa, with key country-level insights highlighting growth in India, China, Japan, the USA, Germany, and the UK.
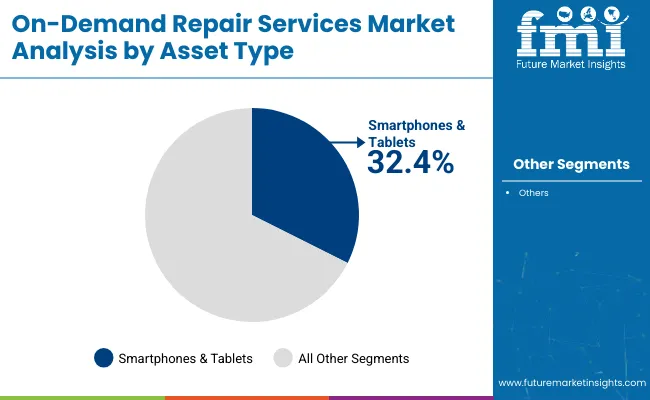
Insights into the Asset Type Segment with Smartphones & Tablets Leading in Market Share

On Demand Repair Services Market By Asset

Asset Type Segment Market Value Share, 2025
Smartphones & Tablets 32.4%
Others 67.6%

The smartphones & tablets segment is projected to contribute 32.4% of the Global On-Demand Repair Services Market revenue in 2025, maintaining its lead as the dominant asset category. This is driven by the sheer scale of mobile device ownership worldwide and the high frequency of screen, battery, and performance-related issues that require repair. Users prioritize immediate and cost-effective repairs, making smartphones & tablets the most consistent demand generator for on-demand platforms. The segment’s growth is also supported by the rising cost of new devices, which encourages consumers to extend device lifecycles through repair instead of replacement. With OEM-authorized networks and third-party platforms expanding global coverage, smartphones & tablets are expected to remain at the core of demand. The asset type continues to be the entry point for customer acquisition in on-demand repair ecosystems.
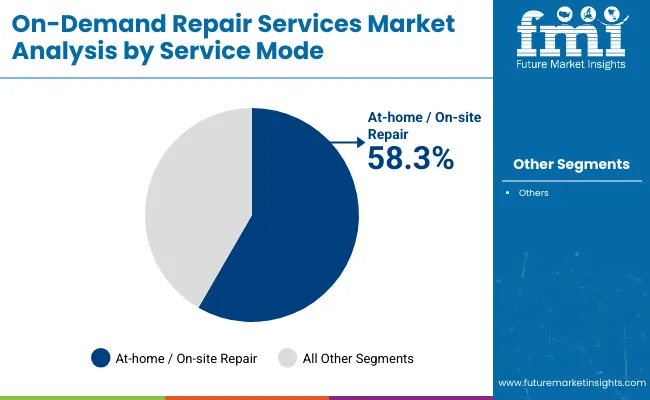
Insights into the Service Mode Segment with At-home / On-site Repair Dominating Demand

On Demand Repair Services Market By Service

Service Mode Segment Market Value Share, 2025
At-home / On-site Repair 58.3%
Others 41.6%

The at-home / on-site repair segment is forecasted to hold 58.3% of the market share in 2025, led by consumer demand for convenience and faster turnaround times. This model allows technicians to provide same-day solutions for electronics, appliances, and home systems without requiring device transportation, making it highly preferred in urban areas. Its strong adoption is supported by platform-managed technician networks that ensure quality control, safety, and reliability. The segment’s growth is further bolstered by the integration of digital scheduling, technician tracking, and transparent pricing models. As more B2C households and small businesses opt for hassle-free repairs, at-home / on-site repair is expected to remain the dominant service delivery mode across global markets.
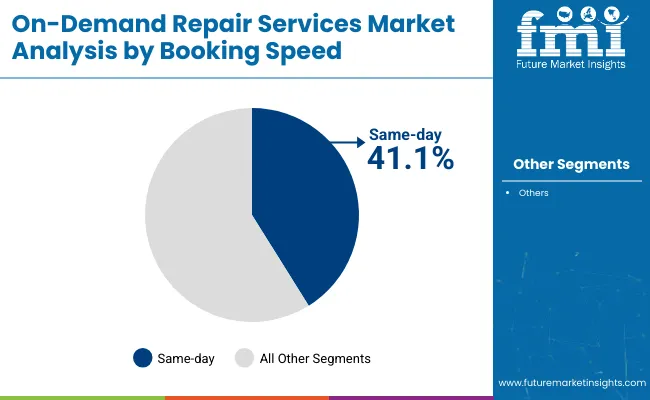
Insights into the Booking Speed Segment with Same-day Leading in Market Share

On Demand Repair Services Market By Booking

Booking Speed Segment Market Value Share, 2025
Same-day 41.1%
Others 58.9%

The same-day booking segment is projected to account for 41.1% of the Global On-Demand Repair Services Market revenue in 2025, making it a defining feature of consumer expectations. Same-day repair addresses urgent needs such as broken smartphones, malfunctioning appliances, or plumbing failures, where delays can significantly impact daily routines. Its popularity is supported by the rise of gig-based repair platforms and marketplace aggregators, which can dispatch technicians quickly by leveraging real-time availability and location-based scheduling. The segment benefits from consumer willingness to pay a premium for speed, particularly in urban and densely populated markets. As competition intensifies, same-day repair is expected to retain its critical role in driving differentiation and customer loyalty within the on-demand repair ecosystem.

What are the Drivers, Restraints, and Key Trends of the Global On-Demand Repairs Services Market?

Drivers

Rising Device and Appliance Penetration Leading to Higher Repair Incidences

The global installed base of smartphones, laptops, consumer electronics, and home appliances is growing rapidly, especially in emerging economies. In 2025, smartphones & tablets alone account for 32.4% of on-demand repair demand (USD 7,087.82 million), underlining their centrality to the market. As the cost of new devices rises, consumers increasingly prefer repairing existing assets to extend their lifecycle, creating repeat demand. The surge of connected devices, smart appliances, and electric vehicles will only multiply repair needs across categories, ensuring consistent revenue opportunities for service providers. This trend is particularly pronounced in Asia-Pacific, where India (14.2% CAGR) and China (12.6% CAGR) are expanding faster than global averages.

Consumer Preference for Convenience and Speed

The dominance of at-home/on-site repair (58.3% share in 2025) and same-day booking (41.1%) reflects a clear global consumer preference for rapid, hassle-free solutions. Customers increasingly expect services to come directly to them, reducing downtime and eliminating the inconvenience of visiting service centers. Platforms that offer technician tracking, transparent pricing, and instant scheduling are tapping into this behavioral shift. For businesses, same-day and next-day models also minimize asset downtime, supporting B2B adoption among fleets, property managers, and SMBs. This demand for speed and accessibility is one of the strongest long-term growth drivers in the market.

Restraints

High Fragmentation and Informal Competition

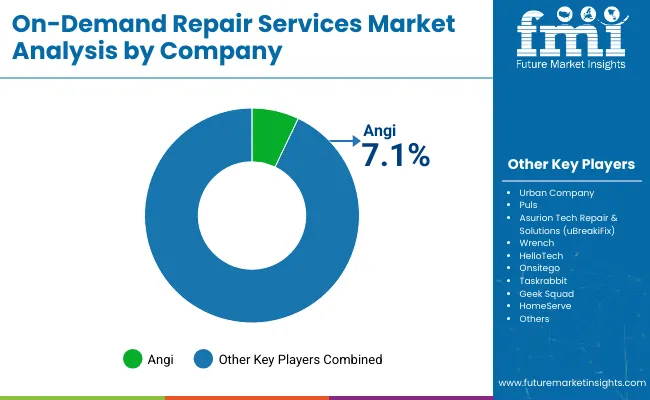
The competitive landscape is highly fragmented, with Angi holding just 7.1% global share in 2025 and the rest spread across numerous regional and specialized players. Informal and unorganized technicians often compete on lower price points, especially in emerging markets, which reduces the profitability of structured platforms. This fragmentation makes it difficult for providers to establish strong global or even regional dominance, slows down standardization, and increases quality variance across geographies.

Skill Gaps and Supply-Side Constraints

The quality and availability of skilled technicians remain a limiting factor in scaling operations. Rapid expansion of categories such as major appliances, home fixtures, and electric vehicles requires technicians with specialized training. However, certification standards differ across regions, leading to inconsistency in service quality. For OEM-authorized networks, the challenge is maintaining brand-aligned repair quality at scale, while for platforms, the issue lies in ensuring reliability and consumer trust when relying on freelance or marketplace models. These gaps can slow adoption in critical categories and reduce repeat usage if customer expectations are not met.

Trends

Expansion of B2B Contracts and Protection Plans

While B2C households currently dominate volumes, B2B demand is expanding rapidly, especially from SMBs, property managers, and fleet operators. Businesses are increasingly outsourcing repair contracts to reduce downtime and operational risks. At the same time, subscription and protection plan add-ons are gaining traction as recurring revenue models, offering predictability for providers and peace of mind for customers. This transition toward contractual relationships rather than ad-hoc repairs is reshaping the industry’s revenue mix and increasing the share of long-term, recurring income streams.

Integration of Remote Diagnosis and Digital Platforms

Although at-home repair dominates today (58.3%), remote diagnosis and virtual assist are emerging as complementary modes, particularly in markets like China where they already represent 75.2% share in 2025. Digital-first platforms are leveraging AI and IoT to pre-diagnose issues, enabling technicians to arrive with the right tools or spare parts, thereby reducing wasted trips. Remote support also appeals to consumers for minor issues and lowers costs for providers. Over the next decade, this trend is expected to integrate tightly with subscription plans, OEM ecosystems, and connected-device monitoring, making digital orchestration as important as physical repair execution.
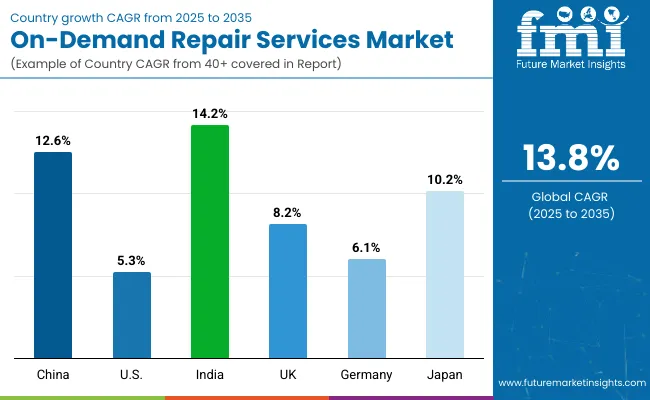
Analysis of Global On-Demand Repair Services Market By Key Countries

On Demand Repair Services Market Country

Countries Estimated CAGR (2025 to 2035)
China 12.6%
USA 5.3%
India 14.2%
UK 8.2%
Germany 6.1%
Japan 10.2%

The market is segmented by asset type, service mode, provider type, booking speed, customer type, pricing model, and region. Asset type includes smartphones & tablets, laptops & desktops, consumer electronics (TV/audio), major home appliances, home fixtures (plumbing/electrical/HVAC), and passenger cars & two-wheelers, highlighting the core categories driving adoption. Service mode classification covers at-home / on-site repair, pickup & return, and remote diagnosis / assist to cater to different customer requirements.

Based on provider type, the segmentation includes platform-managed technicians, marketplace/aggregator freelancers, and OEM-authorized service networks. In terms of booking speed, categories encompass same-day, next-day, and 3+ days. Customer type includes B2C (households) and B2B (SMBs, property managers, fleets). Pricing model segmentation covers fixed upfront price, time & materials, and subscription/protection plan add-ons. Regionally, the scope spans North America, Latin America, Europe, Asia Pacific, and the Middle East & Africa, with key country-level insights highlighting growth in India, China, Japan, the USA, Germany, and the UK.

Sales Outlook for On-Demand Repair Services in the United States

Year USA On-Demand Repairs Services Market
2025 5022.0
2026 5651.9
2027 6360.7
2028 7158.4
2029 8056.2
2030 9066.6
2031 10203.7
2032 11483.4
2033 12923.6
2034 14544.4
2035 16368.5

The USA On-Demand Repair Services Market is projected to grow at a CAGR of 5.3%, led by steady consumer adoption across electronics, home appliances, and household services. The segment mix in 2025 shows smartphones & tablets at 33.7% share (USD 1,692.43 million), demonstrating the country’s dependence on mobile devices. Growth is also supported by expanding subscription/protection plans and B2B service outsourcing among property managers and fleets. Smartphones & tablets repairs dominate early adoption. Subscription add-ons are emerging as a key growth lever. Technician quality and response times remain competitive differentiators.

Growth and Expansion Outlook for On-Demand Repair Services in the United Kingdom

The On-Demand Repair Services Market in the UK is expected to grow at a CAGR of 8.2%, supported by applications in electronics, home fixtures, and appliance servicing. Right-to-Repair regulations and environmental awareness are fueling longer device lifecycles, boosting repair demand. Growth is also supported by platform-managed technicians that emphasize trust and reliability.

  • Electronics and home appliance repairs dominate household demand.
  • Heritage-focused initiatives are encouraging repair over disposal.
  • OEM-authorized networks are leveraging regulations to expand offerings.

Growth and Expansion Outlook for On-Demand Repair Services in India

India is witnessing the fastest growth globally, with the market forecast to expand at a CAGR of 14.2% through 2035. Rising smartphone adoption, cost-conscious consumers, and increasing awareness of sustainability are driving high repair demand. B2C households dominate, but B2B contracts are emerging, especially in property and fleet management. Growth is particularly strong in Tier-2 and Tier-3 cities where platform-managed technician models are scaling rapidly.

  • Smartphone-led demand drives market entry for most platforms.
  • Expansion into smaller cities is accelerating adoption.
  • B2B contracts for fleets and property managers are emerging as high-value growth areas.

Sales Outlook for On-Demand Repair Services in China

Countries 2025 Share (%)
USA 23.0%
China 11.7%
Japan 6.8%
Germany 15.1%
UK 8.0%
India 4.8%
Countries 2035 Share (%)
USA 20.6%
China 12.8%
Japan 8.3%
Germany 13.3%
UK 7.2%
India 5.9%

The On-Demand Repair Services Market in China is expected to grow at a CAGR of 12.6%, one of the highest among leading economies. Unlike the USA, China’s market leans heavily on pickup & return and remote diagnosis models (75.2% share in 2025), reflecting strong digital integration and consumer trust in platform-based ecosystems. Local players benefit from scale, cost efficiency, and government policies favoring sustainability and repair adoption.

  • Remote diagnosis and pickup services dominate consumer behavior.
  • Affordable service bundles drive adoption among lower-income groups.
  • OEM-authorized networks are expanding, supported by regulatory pushes.

In 2025, the USA leads the Global On-Demand Repair Services Market with a 23.0% share, reflecting its mature consumer base, established platforms, and strong demand for device and appliance repairs. However, its share is projected to decline to 20.6% by 2035, as growth in emerging regions accelerates. Similarly, mature European markets such as Germany (15.1% → 13.3%) and the UK (8.0% → 7.2%) are expected to lose some share, largely due to slower growth rates and already high service penetration. These markets remain significant in value terms but face stagnation as adoption reaches maturity and new growth shifts elsewhere.

In contrast, Asia-Pacific markets are gaining ground, led by India (4.8% → 5.9%), China (11.7% → 12.8%), and Japan (6.8% → 8.3%). India’s share expansion reflects its rapid CAGR of 14.2%, driven by cost-conscious consumers and increasing adoption of smartphone and appliance repair services across Tier-2 and Tier-3 cities. China, already a major market, grows steadily on the back of digital-first service models like pickup & return and remote diagnosis, while Japan benefits from rising demand in consumer electronics and urban household services. Together, these shifts illustrate the transition of market weight from North America and Europe toward Asia-Pacific, marking the next decade as one of emerging-market dominance in on-demand repair services.

Opportunity Analysis of the USA On-Demand Repair Services Market

Asset Type Segment Market Value Share, 2025
smartphones & tablets 33.7%
Others 66.3%

The USA On-Demand Repair Services Market is valued at USD 5,022.04 million in 2025, with smartphones & tablets leading at 33.7% (USD 1,692.43 million), followed by other repair categories at 66.3% (USD 3,329.61 million). The dominance of smartphone and tablet repair reflects the USA consumer ecosystem, where high device penetration and elevated replacement costs drive sustained repair demand. Electronics and appliances continue to anchor household-level adoption, with growing demand for protection plans and subscription-based repair services. The maturity of the USA market positions smartphones & tablets as the primary entry point for customers, with same-day repair models differentiating platforms on speed and convenience. Subscription add-ons and OEM-authorized networks are expanding, aligning with consumer trust in quality and transparency. While major appliances and vehicles represent stable growth categories, mobile devices remain the most dynamic driver of on-demand repair service revenues.

  • Market size for the USA in 2025 is USD 5,022.04 million
  • Global market share is approximately 23.0%
  • Smartphones & tablets lead at 33.7% due to high device penetration and repair frequency

Opportunity Analysis of the China On-Demand Repair Services Market

Service Mode Segment Market Value Share, 2025
At-home / On-site Repair 24.8%
Others 75.2%

The China On-Demand Repair Services Market is valued at USD 2,566.82 million in 2025, with pickup & return and remote diagnosis dominating at 75.2% (USD 1,930.25 million), compared to at-home/on-site repair at 24.8% (USD 636.57 million). The dominance of remote-first solutions reflects China’s highly digitalized service culture, where super-app ecosystems and integrated e-commerce platforms enable seamless repair bookings. Consumers show strong trust in logistics-driven models, where devices are collected, repaired in centralized facilities, and returned with guaranteed quality checks.

This advantage positions China as a leader in scaling remote diagnostics and centralized service hubs. Pickup models also benefit from lower costs and faster turnaround for high-volume categories such as smartphones, laptops, and consumer electronics. As digital-first ecosystems expand, AI-powered diagnostics combined with logistics optimization will remain critical in reducing downtime and enhancing consumer trust.
  • Market size for China in 2025 is USD 2,566.82 million
  • Global market share is approximately 11.7%
  • Pickup & return/remote diagnosis lead at 75.2%, reflecting a digital-first repair culture

Competitive Landscape of the Global On-Demand Repair Services Market

On Demand Repair Services Market Comapny

The Global On-Demand Repair Services Market is highly fragmented, with global platforms, regional leaders, and niche-focused specialists competing across multiple repair categories. Angi holds the largest single share at 7.1%, leveraging its strong USA presence and broad household repair network. However, the majority of the market remains dispersed among regional innovators and service aggregators. Global digital-first leaders such as Urban Company, Puls, and Asurion Tech Repair & Solutions (uBreakiFix) are driving adoption through technician-enabled mobile repairs, device protection plans, and OEM partnerships. Their strategies emphasize convenience, speed, and integration with warranty ecosystems.

Established service aggregators like HelloTech, TaskRabbit, and Geek Squad cater to household demand for appliances, consumer electronics, and IT support. These companies are accelerating adoption through bundled services, in-home technician networks, and subscription offerings. Specialized providers such as On site go, Wrench, and HomeServe focus on application-specific niches from vehicle maintenance to protection plans for consumer appliances.

Their strength lies in customization and customer loyalty in local markets rather than global scale. Competitive differentiation is shifting away from pure lead aggregation toward integrated ecosystems that include subscription models, OEM tie-ups, remote diagnostics, and technician enablement platforms. Platforms that succeed in combining speed, trust, and recurring revenue streams are expected to consolidate greater market share through 2035.

Key Developments in Global On-Demand Repairs Services Market

  • On September 6, 2024, Angi deepened its strategic shift by launching Angi Services, a vertically integrated model that acquires local contractors to control service quality and profitability. It also advanced AI-driven personalization and pushed its Angi Key subscription model, boosting recurring revenue ambitions.
  • In FY24 (through mid‑2024), Urban Company delivered impressive financial performanc30% YoY revenue growth to INR 827 crore, while cutting its loss before tax from INR 312 crore to INR 93 crore. Early FY25 results continued the momentum, with Q1 revenue up 37.3% and a profit before tax of INR 12 crore.

Scope of the Report

Item Value
Quantitative Units USD 21,876.1 million
Asset Type Smartphones & tablets; Laptops & desktops; Consumer electronics (TV/audio); Major home appliances; Home fixtures (plumbing/electrical/HVAC); Passenger cars & two-wheelers
Service Mode At-home / on-site repair; Pickup & return; Remote diagnosis / assist
Provider Type Platform-managed technicians; Marketplace/aggregator freelancers; OEM-authorized service networks
Booking Speed Same-day; Next-day; 3+ days
Customer Type B2C (households); B2B (SMBs, property managers, fleets)
Pricing Model Fixed upfront price; Time & materials; Subscription/protection plan add-ons
Regions Covered North America, Europe, Asia-Pacific, Latin America, Middle East & Africa
Country Covered United States, Canada, Germany, France, United Kingdom, China, Japan, India, Brazil, South Africa
Key Companies Profiled Angi ; Urban Company; Puls ; Asurion Tech Repair & Solutions (uBreakiFix); Wrench; HelloTech ; Onsitego ; Taskrabbit ; Geek Squad; HomeServe
Additional Attributes Dollar sales by asset type, service mode, and booking speed; adoption trends in same-day and next-day repairs; growth of subscription/protection plan add-ons; OEM-authorized network expansion; platform-managed vs. marketplace technician models; regional dynamics driven by smartphone/appliance penetration; integration of remote diagnosis; B2B contract growth across property and fleet maintenance.

Key Segments

By Asset Type:

  • Smartphones & tablets
  • Laptops & desktops
  • Consumer electronics (TV/audio)
  • Major home appliances
  • Home fixtures (plumbing/electrical/HVAC)
  • Passenger cars & two-wheelers

By Service Mode:

  • At-home / on-site repair
  • Pickup & return
  • Remote diagnosis / assist

By Provider Type:

  • Platform-managed technicians
  • Marketplace/aggregator freelancers
  • OEM-authorized service networks

By Booking Speed:

  • Same-day
  • Next-day
  • 3+ days

By Customer Type:

  • B2C (households)
  • B2B (SMBs, property managers, fleets)

By Pricing Model:

  • Fixed upfront price
  • Time & materials
  • Subscription/protection plan add-ons

By Region:

  • North America
  • Latin America
  • Europe
  • East Asia
  • South Asia & Pacific
  • Middle East and Africa

Table of Content

  1. Executive Summary
    • Global Market Outlook
    • Demand-side Trends
    • Supply-side Trends
    • Technology Roadmap Analysis
    • Analysis and Recommendations
  2. Market Overview
    • Market Coverage / Taxonomy
    • Market Definition / Scope / Limitations
  3. Market Background
    • Market Dynamics
      • Drivers
      • Restraints
      • Opportunity
      • Trends
    • Scenario Forecast
      • Demand in Optimistic Scenario
      • Demand in Likely Scenario
      • Demand in Conservative Scenario
    • Opportunity Map Analysis
    • Product Life Cycle Analysis
    • Supply Chain Analysis
      • Supply Side Participants and their Roles
        • Producers
        • Mid-Level Participants (Traders/ Agents/ Brokers)
        • Wholesalers and Distributors
      • Value Added and Value Created at Node in the Supply Chain
      • List of Raw Material Suppliers
      • List of Existing and Potential Buyer’s
    • Investment Feasibility Matrix
    • Value Chain Analysis
      • Profit Margin Analysis
      • Wholesalers and Distributors
      • Retailers
    • PESTLE and Porter’s Analysis
    • Regulatory Landscape
      • By Key Regions
      • By Key Countries
    • Regional Parent Market Outlook
    • Production and Consumption Statistics
    • Import and Export Statistics
  4. Global Market Analysis 2020 to 2024 and Forecast, 2025 to 2035
    • Historical Market Size Value (USD Million) & Volume (Units) Analysis, 2020 to 2024
    • Current and Future Market Size Value (USD Million) & Volume (Units) Projections, 2025 to 2035
      • Y-o-Y Growth Trend Analysis
      • Absolute $ Opportunity Analysis
  5. Global Market Analysis 2020 to 2024 and Forecast 2025 to 2035, By Asset Type
    • Introduction / Key Findings
    • Historical Market Size Value (USD Million) & Volume (Units) Analysis By Asset Type, 2020 to 2024
    • Current and Future Market Size Value (USD Million) & Volume (Units) Analysis and Forecast By Asset Type, 2025 to 2035
      • Smartphones & tablets
      • Laptops & desktops
      • Consumer electronics (TV/audio)
      • Major home appliances
      • Home fixtures (plumbing/electrical/HVAC)
      • Passenger cars & two-wheelers
    • Y-o-Y Growth Trend Analysis By Asset Type, 2020 to 2024
    • Absolute $ Opportunity Analysis By Asset Type, 2025 to 2035
  6. Global Market Analysis 2020 to 2024 and Forecast 2025 to 2035, By Service Mode
    • Introduction / Key Findings
    • Historical Market Size Value (USD Million) & Volume (Units) Analysis By Service Mode, 2020 to 2024
    • Current and Future Market Size Value (USD Million) & Volume (Units) Analysis and Forecast By Service Mode, 2025 to 2035
      • At-home / on-site repair
      • Pickup & return
      • Remote diagnosis / assist
    • Y-o-Y Growth Trend Analysis By Service Mode, 2020 to 2024
    • Absolute $ Opportunity Analysis By Service Mode, 2025 to 2035
  7. Global Market Analysis 2020 to 2024 and Forecast 2025 to 2035, By Provider Type
    • Introduction / Key Findings
    • Historical Market Size Value (USD Million) & Volume (Units) Analysis By Provider Type, 2020 to 2024
    • Current and Future Market Size Value (USD Million) & Volume (Units) Analysis and Forecast By Provider Type, 2025 to 2035
      • Platform-managed technicians
      • Marketplace/aggregator freelancers
      • OEM-authorized service networks
    • Y-o-Y Growth Trend Analysis By Provider Type, 2020 to 2024
    • Absolute $ Opportunity Analysis By Provider Type, 2025 to 2035
  8. Global Market Analysis 2020 to 2024 and Forecast 2025 to 2035, By Booking Speed
    • Introduction / Key Findings
    • Historical Market Size Value (USD Million) & Volume (Units) Analysis By Booking Speed, 2020 to 2024
    • Current and Future Market Size Value (USD Million) & Volume (Units) Analysis and Forecast By Booking Speed, 2025 to 2035
      • Same-day
      • Next-day
      • 3+ days
    • Y-o-Y Growth Trend Analysis By Booking Speed, 2020 to 2024
    • Absolute $ Opportunity Analysis By Booking Speed, 2025 to 2035
  9. Global Market Analysis 2020 to 2024 and Forecast 2025 to 2035, By Customer Type
    • Introduction / Key Findings
    • Historical Market Size Value (USD Million) & Volume (Units) Analysis By Customer Type, 2020 to 2024
    • Current and Future Market Size Value (USD Million) & Volume (Units) Analysis and Forecast By Customer Type, 2025 to 2035
      • B2C (households)
      • B2B (SMBs, property managers, fleets)
    • Y-o-Y Growth Trend Analysis By Customer Type, 2020 to 2024
    • Absolute $ Opportunity Analysis By Customer Type, 2025 to 2035
  10. Global Market Analysis 2020 to 2024 and Forecast 2025 to 2035, By Pricing Model
    • Introduction / Key Findings
    • Historical Market Size Value (USD Million) & Volume (Units) Analysis By Pricing Model, 2020 to 2024
    • Current and Future Market Size Value (USD Million) & Volume (Units) Analysis and Forecast By Pricing Model, 2025 to 2035
      • Fixed upfront price
      • Time & materials
      • Subscription/protection plan add-ons
    • Y-o-Y Growth Trend Analysis By Pricing Model, 2020 to 2024
    • Absolute $ Opportunity Analysis By Pricing Model, 2025 to 2035
  11. Global Market Analysis 2020 to 2024 and Forecast 2025 to 2035, By Region
    • Introduction
    • Historical Market Size Value (USD Million) & Volume (Units) Analysis By Region, 2020 to 2024
    • Current Market Size Value (USD Million) & Volume (Units) Analysis and Forecast By Region, 2025 to 2035
      • North America
      • Latin America
      • Europe
      • East Asia
      • South Asia & Pacific
      • Middle East and Africa
    • Market Attractiveness Analysis By Region
  12. North America Market Analysis 2020 to 2024 and Forecast 2025 to 2035, By Country
    • Historical Market Size Value (USD Million) & Volume (Units) Trend Analysis By Market Taxonomy, 2020 to 2024
    • Market Size Value (USD Million) & Volume (Units) Forecast By Market Taxonomy, 2025 to 2035
      • By Country
        • USA
        • Canada
      • By Asset Type
      • By Service Mode
      • By Provider Type
      • By Booking Speed
      • By Customer Type
      • By Pricing Model
    • Market Attractiveness Analysis
      • By Country
      • By Asset Type
      • By Service Mode
      • By Provider Type
      • By Booking Speed
      • By Customer Type
      • By Pricing Model
    • Key Takeaways
  13. Latin America Market Analysis 2020 to 2024 and Forecast 2025 to 2035, By Country
    • Historical Market Size Value (USD Million) & Volume (Units) Trend Analysis By Market Taxonomy, 2020 to 2024
    • Market Size Value (USD Million) & Volume (Units) Forecast By Market Taxonomy, 2025 to 2035
      • By Country
        • Brazil
        • Mexico
        • Colombia
        • Rest of Latin America
      • By Asset Type
      • By Service Mode
      • By Provider Type
      • By Booking Speed
      • By Customer Type
      • By Pricing Model
    • Market Attractiveness Analysis
      • By Country
      • By Asset Type
      • By Service Mode
      • By Provider Type
      • By Booking Speed
      • By Customer Type
      • By Pricing Model
    • Key Takeaways
  14. Europe Market Analysis 2020 to 2024 and Forecast 2025 to 2035, By Country
    • Historical Market Size Value (USD Million) & Volume (Units) Trend Analysis By Market Taxonomy, 2020 to 2024
    • Market Size Value (USD Million) & Volume (Units) Forecast By Market Taxonomy, 2025 to 2035
      • By Country
        • Germany
        • UK
        • France
        • Italy
        • Spain
        • Belgium
        • Netherlands
        • Nordic
        • Switzerland
        • Russia
        • Poland
        • Rest of Europe
      • By Asset Type
      • By Service Mode
      • By Provider Type
      • By Booking Speed
      • By Customer Type
      • By Pricing Model
    • Market Attractiveness Analysis
      • By Country
      • By Asset Type
      • By Service Mode
      • By Provider Type
      • By Booking Speed
      • By Customer Type
      • By Pricing Model
    • Key Takeaways
  15. East Asia Market Analysis 2020 to 2024 and Forecast 2025 to 2035, By Country
    • Historical Market Size Value (USD Million) & Volume (Units) Trend Analysis By Market Taxonomy, 2020 to 2024
    • Market Size Value (USD Million) & Volume (Units) Forecast By Market Taxonomy, 2025 to 2035
      • By Country
        • China
        • Japan
        • South Korea
      • By Asset Type
      • By Service Mode
      • By Provider Type
      • By Booking Speed
      • By Customer Type
      • By Pricing Model
    • Market Attractiveness Analysis
      • By Country
      • By Asset Type
      • By Service Mode
      • By Provider Type
      • By Booking Speed
      • By Customer Type
      • By Pricing Model
    • Key Takeaways
  16. South Asia & Pacific Market Analysis 2020 to 2024 and Forecast 2025 to 2035, By Country
    • Historical Market Size Value (USD Million) & Volume (Units) Trend Analysis By Market Taxonomy, 2020 to 2024
    • Market Size Value (USD Million) & Volume (Units) Forecast By Market Taxonomy, 2025 to 2035
      • By Country
        • India
        • Thailand
        • Malaysia
        • Indonesia
        • Singapore
        • Vietnam
        • Australia
        • New Zealand
        • Rest of South Asia
      • By Asset Type
      • By Service Mode
      • By Provider Type
      • By Booking Speed
      • By Customer Type
      • By Pricing Model
    • Market Attractiveness Analysis
      • By Country
      • By Asset Type
      • By Service Mode
      • By Provider Type
      • By Booking Speed
      • By Customer Type
      • By Pricing Model
    • Key Takeaways
  17. Middle East and Africa Market Analysis 2020 to 2024 and Forecast 2025 to 2035, By Country
    • Historical Market Size Value (USD Million) & Volume (Units) Trend Analysis By Market Taxonomy, 2020 to 2024
    • Market Size Value (USD Million) & Volume (Units) Forecast By Market Taxonomy, 2025 to 2035
      • By Country
        • Turkey
        • UAE
        • Saudi Arabia
        • Israel
        • Other GCC Countries
        • North Africa
        • South Africa
      • By Asset Type
      • By Service Mode
      • By Provider Type
      • By Booking Speed
      • By Customer Type
      • By Pricing Model
    • Market Attractiveness Analysis
      • By Country
      • By Asset Type
      • By Service Mode
      • By Provider Type
      • By Booking Speed
      • By Customer Type
      • By Pricing Model
    • Key Takeaways
  18. Key Countries Market Analysis
    • USA
      • Pricing Analysis
      • Market Share Analysis, 2024
        • By Asset Type
        • By Service Mode
        • By Provider Type
        • By Booking Speed
        • By Customer Type
        • By Pricing Model
    • Canada
      • Pricing Analysis
      • Market Share Analysis, 2024
        • By Asset Type
        • By Service Mode
        • By Provider Type
        • By Booking Speed
        • By Customer Type
        • By Pricing Model
    • Brazil
      • Pricing Analysis
      • Market Share Analysis, 2024
        • By Asset Type
        • By Service Mode
        • By Provider Type
        • By Booking Speed
        • By Customer Type
        • By Pricing Model
    • Mexico
      • Pricing Analysis
      • Market Share Analysis, 2024
        • By Asset Type
        • By Service Mode
        • By Provider Type
        • By Booking Speed
        • By Customer Type
        • By Pricing Model
    • Colombia
      • Pricing Analysis
      • Market Share Analysis, 2024
        • By Asset Type
        • By Service Mode
        • By Provider Type
        • By Booking Speed
        • By Customer Type
        • By Pricing Model
    • Germany
      • Pricing Analysis
      • Market Share Analysis, 2024
        • By Asset Type
        • By Service Mode
        • By Provider Type
        • By Booking Speed
        • By Customer Type
        • By Pricing Model
    • UK
      • Pricing Analysis
      • Market Share Analysis, 2024
        • By Asset Type
        • By Service Mode
        • By Provider Type
        • By Booking Speed
        • By Customer Type
        • By Pricing Model
    • France
      • Pricing Analysis
      • Market Share Analysis, 2024
        • By Asset Type
        • By Service Mode
        • By Provider Type
        • By Booking Speed
        • By Customer Type
        • By Pricing Model
    • Italy
      • Pricing Analysis
      • Market Share Analysis, 2024
        • By Asset Type
        • By Service Mode
        • By Provider Type
        • By Booking Speed
        • By Customer Type
        • By Pricing Model
    • Spain
      • Pricing Analysis
      • Market Share Analysis, 2024
        • By Asset Type
        • By Service Mode
        • By Provider Type
        • By Booking Speed
        • By Customer Type
        • By Pricing Model
    • Belgium
      • Pricing Analysis
      • Market Share Analysis, 2024
        • By Asset Type
        • By Service Mode
        • By Provider Type
        • By Booking Speed
        • By Customer Type
        • By Pricing Model
    • Netherlands
      • Pricing Analysis
      • Market Share Analysis, 2024
        • By Asset Type
        • By Service Mode
        • By Provider Type
        • By Booking Speed
        • By Customer Type
        • By Pricing Model
    • Nordic
      • Pricing Analysis
      • Market Share Analysis, 2024
        • By Asset Type
        • By Service Mode
        • By Provider Type
        • By Booking Speed
        • By Customer Type
        • By Pricing Model
    • Switzerland
      • Pricing Analysis
      • Market Share Analysis, 2024
        • By Asset Type
        • By Service Mode
        • By Provider Type
        • By Booking Speed
        • By Customer Type
        • By Pricing Model
    • Russia
      • Pricing Analysis
      • Market Share Analysis, 2024
        • By Asset Type
        • By Service Mode
        • By Provider Type
        • By Booking Speed
        • By Customer Type
        • By Pricing Model
    • Poland
      • Pricing Analysis
      • Market Share Analysis, 2024
        • By Asset Type
        • By Service Mode
        • By Provider Type
        • By Booking Speed
        • By Customer Type
        • By Pricing Model
    • China
      • Pricing Analysis
      • Market Share Analysis, 2024
        • By Asset Type
        • By Service Mode
        • By Provider Type
        • By Booking Speed
        • By Customer Type
        • By Pricing Model
    • Japan
      • Pricing Analysis
      • Market Share Analysis, 2024
        • By Asset Type
        • By Service Mode
        • By Provider Type
        • By Booking Speed
        • By Customer Type
        • By Pricing Model
    • South Korea
      • Pricing Analysis
      • Market Share Analysis, 2024
        • By Asset Type
        • By Service Mode
        • By Provider Type
        • By Booking Speed
        • By Customer Type
        • By Pricing Model
    • India
      • Pricing Analysis
      • Market Share Analysis, 2024
        • By Asset Type
        • By Service Mode
        • By Provider Type
        • By Booking Speed
        • By Customer Type
        • By Pricing Model
    • Thailand
      • Pricing Analysis
      • Market Share Analysis, 2024
        • By Asset Type
        • By Service Mode
        • By Provider Type
        • By Booking Speed
        • By Customer Type
        • By Pricing Model
    • Indonesia
      • Pricing Analysis
      • Market Share Analysis, 2024
        • By Asset Type
        • By Service Mode
        • By Provider Type
        • By Booking Speed
        • By Customer Type
        • By Pricing Model
    • Australia
      • Pricing Analysis
      • Market Share Analysis, 2024
        • By Asset Type
        • By Service Mode
        • By Provider Type
        • By Booking Speed
        • By Customer Type
        • By Pricing Model
    • New Zealand
      • Pricing Analysis
      • Market Share Analysis, 2024
        • By Asset Type
        • By Service Mode
        • By Provider Type
        • By Booking Speed
        • By Customer Type
        • By Pricing Model
    • Turkey
      • Pricing Analysis
      • Market Share Analysis, 2024
        • By Asset Type
        • By Service Mode
        • By Provider Type
        • By Booking Speed
        • By Customer Type
        • By Pricing Model
    • UAE
      • Pricing Analysis
      • Market Share Analysis, 2024
        • By Asset Type
        • By Service Mode
        • By Provider Type
        • By Booking Speed
        • By Customer Type
        • By Pricing Model
    • Saudi Arabia
      • Pricing Analysis
      • Market Share Analysis, 2024
        • By Asset Type
        • By Service Mode
        • By Provider Type
        • By Booking Speed
        • By Customer Type
        • By Pricing Model
    • Israel
      • Pricing Analysis
      • Market Share Analysis, 2024
        • By Asset Type
        • By Service Mode
        • By Provider Type
        • By Booking Speed
        • By Customer Type
        • By Pricing Model
    • North Africa
      • Pricing Analysis
      • Market Share Analysis, 2024
        • By Asset Type
        • By Service Mode
        • By Provider Type
        • By Booking Speed
        • By Customer Type
        • By Pricing Model
    • South Africa
      • Pricing Analysis
      • Market Share Analysis, 2024
        • By Asset Type
        • By Service Mode
        • By Provider Type
        • By Booking Speed
        • By Customer Type
        • By Pricing Model
  19. Market Structure Analysis
    • Competition Dashboard
    • Competition Benchmarking
    • Market Share Analysis of Top Players
      • By Regional
      • By Asset Type
      • By Service Mode
      • By Provider Type
      • By Booking Speed
      • By Customer Type
      • By Pricing Model
  20. Competition Analysis
    • Competition Deep Dive
      • Angi
        • Overview
        • Product Portfolio
        • Profitability by Market Segments (Product/Age /Sales Channel/Region)
        • Sales Footprint
        • Strategy Overview
          • Marketing Strategy
          • Product Strategy
          • Channel Strategy
      • Urban Company
        • Overview
        • Product Portfolio
        • Profitability by Market Segments (Product/Age /Sales Channel/Region)
        • Sales Footprint
        • Strategy Overview
          • Marketing Strategy
          • Product Strategy
          • Channel Strategy
      • Puls
        • Overview
        • Product Portfolio
        • Profitability by Market Segments (Product/Age /Sales Channel/Region)
        • Sales Footprint
        • Strategy Overview
          • Marketing Strategy
          • Product Strategy
          • Channel Strategy
      • Asurion Tech Repair & Solutions (uBreakiFix)
        • Overview
        • Product Portfolio
        • Profitability by Market Segments (Product/Age /Sales Channel/Region)
        • Sales Footprint
        • Strategy Overview
          • Marketing Strategy
          • Product Strategy
          • Channel Strategy
      • Wrench
        • Overview
        • Product Portfolio
        • Profitability by Market Segments (Product/Age /Sales Channel/Region)
        • Sales Footprint
        • Strategy Overview
          • Marketing Strategy
          • Product Strategy
          • Channel Strategy
      • HelloTech
        • Overview
        • Product Portfolio
        • Profitability by Market Segments (Product/Age /Sales Channel/Region)
        • Sales Footprint
        • Strategy Overview
          • Marketing Strategy
          • Product Strategy
          • Channel Strategy
      • Onsitego
        • Overview
        • Product Portfolio
        • Profitability by Market Segments (Product/Age /Sales Channel/Region)
        • Sales Footprint
        • Strategy Overview
          • Marketing Strategy
          • Product Strategy
          • Channel Strategy
      • Taskrabbit
        • Overview
        • Product Portfolio
        • Profitability by Market Segments (Product/Age /Sales Channel/Region)
        • Sales Footprint
        • Strategy Overview
          • Marketing Strategy
          • Product Strategy
          • Channel Strategy
      • Geek Squad
        • Overview
        • Product Portfolio
        • Profitability by Market Segments (Product/Age /Sales Channel/Region)
        • Sales Footprint
        • Strategy Overview
          • Marketing Strategy
          • Product Strategy
          • Channel Strategy
      • HomeServe
        • Overview
        • Product Portfolio
        • Profitability by Market Segments (Product/Age /Sales Channel/Region)
        • Sales Footprint
        • Strategy Overview
          • Marketing Strategy
          • Product Strategy
          • Channel Strategy
  21. Assumptions & Acronyms Used
  22. Research Methodology

List of Tables

  • Table 1: Global Market Value (USD Million) Forecast by Region, 2020-2035
  • Table 2: Global Market Volume (Units) Forecast by Region, 2020-2035
  • Table 3: Global Market Value (USD Million) Forecast by Asset Type, 2020-2035
  • Table 4: Global Market Volume (Units) Forecast by Asset Type, 2020-2035
  • Table 5: Global Market Value (USD Million) Forecast by Service Mode, 2020-2035
  • Table 6: Global Market Volume (Units) Forecast by Service Mode, 2020-2035
  • Table 7: Global Market Value (USD Million) Forecast by Provider Type, 2020-2035
  • Table 8: Global Market Volume (Units) Forecast by Provider Type, 2020-2035
  • Table 9: Global Market Value (USD Million) Forecast by Booking Speed, 2020-2035
  • Table 10: Global Market Volume (Units) Forecast by Booking Speed, 2020-2035
  • Table 11: Global Market Value (USD Million) Forecast by Customer Type, 2020-2035
  • Table 12: Global Market Volume (Units) Forecast by Customer Type, 2020-2035
  • Table 13: Global Market Value (USD Million) Forecast by Pricing Model, 2020-2035
  • Table 14: Global Market Volume (Units) Forecast by Pricing Model, 2020-2035
  • Table 15: North America Market Value (USD Million) Forecast by Country, 2020-2035
  • Table 16: North America Market Volume (Units) Forecast by Country, 2020-2035
  • Table 17: North America Market Value (USD Million) Forecast by Asset Type, 2020-2035
  • Table 18: North America Market Volume (Units) Forecast by Asset Type, 2020-2035
  • Table 19: North America Market Value (USD Million) Forecast by Service Mode, 2020-2035
  • Table 20: North America Market Volume (Units) Forecast by Service Mode, 2020-2035
  • Table 21: North America Market Value (USD Million) Forecast by Provider Type, 2020-2035
  • Table 22: North America Market Volume (Units) Forecast by Provider Type, 2020-2035
  • Table 23: North America Market Value (USD Million) Forecast by Booking Speed, 2020-2035
  • Table 24: North America Market Volume (Units) Forecast by Booking Speed, 2020-2035
  • Table 25: North America Market Value (USD Million) Forecast by Customer Type, 2020-2035
  • Table 26: North America Market Volume (Units) Forecast by Customer Type, 2020-2035
  • Table 27: North America Market Value (USD Million) Forecast by Pricing Model, 2020-2035
  • Table 28: North America Market Volume (Units) Forecast by Pricing Model, 2020-2035
  • Table 29: Latin America Market Value (USD Million) Forecast by Country, 2020-2035
  • Table 30: Latin America Market Volume (Units) Forecast by Country, 2020-2035
  • Table 31: Latin America Market Value (USD Million) Forecast by Asset Type, 2020-2035
  • Table 32: Latin America Market Volume (Units) Forecast by Asset Type, 2020-2035
  • Table 33: Latin America Market Value (USD Million) Forecast by Service Mode, 2020-2035
  • Table 34: Latin America Market Volume (Units) Forecast by Service Mode, 2020-2035
  • Table 35: Latin America Market Value (USD Million) Forecast by Provider Type, 2020-2035
  • Table 36: Latin America Market Volume (Units) Forecast by Provider Type, 2020-2035
  • Table 37: Latin America Market Value (USD Million) Forecast by Booking Speed, 2020-2035
  • Table 38: Latin America Market Volume (Units) Forecast by Booking Speed, 2020-2035
  • Table 39: Latin America Market Value (USD Million) Forecast by Customer Type, 2020-2035
  • Table 40: Latin America Market Volume (Units) Forecast by Customer Type, 2020-2035
  • Table 41: Latin America Market Value (USD Million) Forecast by Pricing Model, 2020-2035
  • Table 42: Latin America Market Volume (Units) Forecast by Pricing Model, 2020-2035
  • Table 43: Europe Market Value (USD Million) Forecast by Country, 2020-2035
  • Table 44: Europe Market Volume (Units) Forecast by Country, 2020-2035
  • Table 45: Europe Market Value (USD Million) Forecast by Asset Type, 2020-2035
  • Table 46: Europe Market Volume (Units) Forecast by Asset Type, 2020-2035
  • Table 47: Europe Market Value (USD Million) Forecast by Service Mode, 2020-2035
  • Table 48: Europe Market Volume (Units) Forecast by Service Mode, 2020-2035
  • Table 49: Europe Market Value (USD Million) Forecast by Provider Type, 2020-2035
  • Table 50: Europe Market Volume (Units) Forecast by Provider Type, 2020-2035
  • Table 51: Europe Market Value (USD Million) Forecast by Booking Speed, 2020-2035
  • Table 52: Europe Market Volume (Units) Forecast by Booking Speed, 2020-2035
  • Table 53: Europe Market Value (USD Million) Forecast by Customer Type, 2020-2035
  • Table 54: Europe Market Volume (Units) Forecast by Customer Type, 2020-2035
  • Table 55: Europe Market Value (USD Million) Forecast by Pricing Model, 2020-2035
  • Table 56: Europe Market Volume (Units) Forecast by Pricing Model, 2020-2035
  • Table 57: East Asia Market Value (USD Million) Forecast by Country, 2020-2035
  • Table 58: East Asia Market Volume (Units) Forecast by Country, 2020-2035
  • Table 59: East Asia Market Value (USD Million) Forecast by Asset Type, 2020-2035
  • Table 60: East Asia Market Volume (Units) Forecast by Asset Type, 2020-2035
  • Table 61: East Asia Market Value (USD Million) Forecast by Service Mode, 2020-2035
  • Table 62: East Asia Market Volume (Units) Forecast by Service Mode, 2020-2035
  • Table 63: East Asia Market Value (USD Million) Forecast by Provider Type, 2020-2035
  • Table 64: East Asia Market Volume (Units) Forecast by Provider Type, 2020-2035
  • Table 65: East Asia Market Value (USD Million) Forecast by Booking Speed, 2020-2035
  • Table 66: East Asia Market Volume (Units) Forecast by Booking Speed, 2020-2035
  • Table 67: East Asia Market Value (USD Million) Forecast by Customer Type, 2020-2035
  • Table 68: East Asia Market Volume (Units) Forecast by Customer Type, 2020-2035
  • Table 69: East Asia Market Value (USD Million) Forecast by Pricing Model, 2020-2035
  • Table 70: East Asia Market Volume (Units) Forecast by Pricing Model, 2020-2035
  • Table 71: South Asia & Pacific Market Value (USD Million) Forecast by Country, 2020-2035
  • Table 72: South Asia & Pacific Market Volume (Units) Forecast by Country, 2020-2035
  • Table 73: South Asia & Pacific Market Value (USD Million) Forecast by Asset Type, 2020-2035
  • Table 74: South Asia & Pacific Market Volume (Units) Forecast by Asset Type, 2020-2035
  • Table 75: South Asia & Pacific Market Value (USD Million) Forecast by Service Mode, 2020-2035
  • Table 76: South Asia & Pacific Market Volume (Units) Forecast by Service Mode, 2020-2035
  • Table 77: South Asia & Pacific Market Value (USD Million) Forecast by Provider Type, 2020-2035
  • Table 78: South Asia & Pacific Market Volume (Units) Forecast by Provider Type, 2020-2035
  • Table 79: South Asia & Pacific Market Value (USD Million) Forecast by Booking Speed, 2020-2035
  • Table 80: South Asia & Pacific Market Volume (Units) Forecast by Booking Speed, 2020-2035
  • Table 81: South Asia & Pacific Market Value (USD Million) Forecast by Customer Type, 2020-2035
  • Table 82: South Asia & Pacific Market Volume (Units) Forecast by Customer Type, 2020-2035
  • Table 83: South Asia & Pacific Market Value (USD Million) Forecast by Pricing Model, 2020-2035
  • Table 84: South Asia & Pacific Market Volume (Units) Forecast by Pricing Model, 2020-2035
  • Table 85: Middle East and Africa Market Value (USD Million) Forecast by Country, 2020-2035
  • Table 86: Middle East and Africa Market Volume (Units) Forecast by Country, 2020-2035
  • Table 87: Middle East and Africa Market Value (USD Million) Forecast by Asset Type, 2020-2035
  • Table 88: Middle East and Africa Market Volume (Units) Forecast by Asset Type, 2020-2035
  • Table 89: Middle East and Africa Market Value (USD Million) Forecast by Service Mode, 2020-2035
  • Table 90: Middle East and Africa Market Volume (Units) Forecast by Service Mode, 2020-2035
  • Table 91: Middle East and Africa Market Value (USD Million) Forecast by Provider Type, 2020-2035
  • Table 92: Middle East and Africa Market Volume (Units) Forecast by Provider Type, 2020-2035
  • Table 93: Middle East and Africa Market Value (USD Million) Forecast by Booking Speed, 2020-2035
  • Table 94: Middle East and Africa Market Volume (Units) Forecast by Booking Speed, 2020-2035
  • Table 95: Middle East and Africa Market Value (USD Million) Forecast by Customer Type, 2020-2035
  • Table 96: Middle East and Africa Market Volume (Units) Forecast by Customer Type, 2020-2035
  • Table 97: Middle East and Africa Market Value (USD Million) Forecast by Pricing Model, 2020-2035
  • Table 98: Middle East and Africa Market Volume (Units) Forecast by Pricing Model, 2020-2035

List of Figures

  • Figure 1: Global Market Value (USD Million) by Asset Type, 2025-2035
  • Figure 2: Global Market Value (USD Million) by Service Mode, 2025-2035
  • Figure 3: Global Market Value (USD Million) by Provider Type, 2025-2035
  • Figure 4: Global Market Value (USD Million) by Booking Speed, 2025-2035
  • Figure 5: Global Market Value (USD Million) by Customer Type, 2025-2035
  • Figure 6: Global Market Value (USD Million) by Pricing Model, 2025-2035
  • Figure 7: Global Market Value (USD Million) by Region, 2025-2035
  • Figure 8: Global Market Value (USD Million) Analysis by Region, 2020-2035
  • Figure 9: Global Market Volume (Units) Analysis by Region, 2020-2035
  • Figure 10: Global Market Value Share (%) and BPS Analysis by Region, 2025-2035
  • Figure 11: Global Market Y-o-Y Growth (%) Projections by Region, 2025-2035
  • Figure 12: Global Market Value (USD Million) Analysis by Asset Type, 2020-2035
  • Figure 13: Global Market Volume (Units) Analysis by Asset Type, 2020-2035
  • Figure 14: Global Market Value Share (%) and BPS Analysis by Asset Type, 2025-2035
  • Figure 15: Global Market Y-o-Y Growth (%) Projections by Asset Type, 2025-2035
  • Figure 16: Global Market Value (USD Million) Analysis by Service Mode, 2020-2035
  • Figure 17: Global Market Volume (Units) Analysis by Service Mode, 2020-2035
  • Figure 18: Global Market Value Share (%) and BPS Analysis by Service Mode, 2025-2035
  • Figure 19: Global Market Y-o-Y Growth (%) Projections by Service Mode, 2025-2035
  • Figure 20: Global Market Value (USD Million) Analysis by Provider Type, 2020-2035
  • Figure 21: Global Market Volume (Units) Analysis by Provider Type, 2020-2035
  • Figure 22: Global Market Value Share (%) and BPS Analysis by Provider Type, 2025-2035
  • Figure 23: Global Market Y-o-Y Growth (%) Projections by Provider Type, 2025-2035
  • Figure 24: Global Market Value (USD Million) Analysis by Booking Speed, 2020-2035
  • Figure 25: Global Market Volume (Units) Analysis by Booking Speed, 2020-2035
  • Figure 26: Global Market Value Share (%) and BPS Analysis by Booking Speed, 2025-2035
  • Figure 27: Global Market Y-o-Y Growth (%) Projections by Booking Speed, 2025-2035
  • Figure 28: Global Market Value (USD Million) Analysis by Customer Type, 2020-2035
  • Figure 29: Global Market Volume (Units) Analysis by Customer Type, 2020-2035
  • Figure 30: Global Market Value Share (%) and BPS Analysis by Customer Type, 2025-2035
  • Figure 31: Global Market Y-o-Y Growth (%) Projections by Customer Type, 2025-2035
  • Figure 32: Global Market Value (USD Million) Analysis by Pricing Model, 2020-2035
  • Figure 33: Global Market Volume (Units) Analysis by Pricing Model, 2020-2035
  • Figure 34: Global Market Value Share (%) and BPS Analysis by Pricing Model, 2025-2035
  • Figure 35: Global Market Y-o-Y Growth (%) Projections by Pricing Model, 2025-2035
  • Figure 36: Global Market Attractiveness by Asset Type, 2025-2035
  • Figure 37: Global Market Attractiveness by Service Mode, 2025-2035
  • Figure 38: Global Market Attractiveness by Provider Type, 2025-2035
  • Figure 39: Global Market Attractiveness by Booking Speed, 2025-2035
  • Figure 40: Global Market Attractiveness by Customer Type, 2025-2035
  • Figure 41: Global Market Attractiveness by Pricing Model, 2025-2035
  • Figure 42: Global Market Attractiveness by Region, 2025-2035
  • Figure 43: North America Market Value (USD Million) by Asset Type, 2025-2035
  • Figure 44: North America Market Value (USD Million) by Service Mode, 2025-2035
  • Figure 45: North America Market Value (USD Million) by Provider Type, 2025-2035
  • Figure 46: North America Market Value (USD Million) by Booking Speed, 2025-2035
  • Figure 47: North America Market Value (USD Million) by Customer Type, 2025-2035
  • Figure 48: North America Market Value (USD Million) by Pricing Model, 2025-2035
  • Figure 49: North America Market Value (USD Million) by Country, 2025-2035
  • Figure 50: North America Market Value (USD Million) Analysis by Country, 2020-2035
  • Figure 51: North America Market Volume (Units) Analysis by Country, 2020-2035
  • Figure 52: North America Market Value Share (%) and BPS Analysis by Country, 2025-2035
  • Figure 53: North America Market Y-o-Y Growth (%) Projections by Country, 2025-2035
  • Figure 54: North America Market Value (USD Million) Analysis by Asset Type, 2020-2035
  • Figure 55: North America Market Volume (Units) Analysis by Asset Type, 2020-2035
  • Figure 56: North America Market Value Share (%) and BPS Analysis by Asset Type, 2025-2035
  • Figure 57: North America Market Y-o-Y Growth (%) Projections by Asset Type, 2025-2035
  • Figure 58: North America Market Value (USD Million) Analysis by Service Mode, 2020-2035
  • Figure 59: North America Market Volume (Units) Analysis by Service Mode, 2020-2035
  • Figure 60: North America Market Value Share (%) and BPS Analysis by Service Mode, 2025-2035
  • Figure 61: North America Market Y-o-Y Growth (%) Projections by Service Mode, 2025-2035
  • Figure 62: North America Market Value (USD Million) Analysis by Provider Type, 2020-2035
  • Figure 63: North America Market Volume (Units) Analysis by Provider Type, 2020-2035
  • Figure 64: North America Market Value Share (%) and BPS Analysis by Provider Type, 2025-2035
  • Figure 65: North America Market Y-o-Y Growth (%) Projections by Provider Type, 2025-2035
  • Figure 66: North America Market Value (USD Million) Analysis by Booking Speed, 2020-2035
  • Figure 67: North America Market Volume (Units) Analysis by Booking Speed, 2020-2035
  • Figure 68: North America Market Value Share (%) and BPS Analysis by Booking Speed, 2025-2035
  • Figure 69: North America Market Y-o-Y Growth (%) Projections by Booking Speed, 2025-2035
  • Figure 70: North America Market Value (USD Million) Analysis by Customer Type, 2020-2035
  • Figure 71: North America Market Volume (Units) Analysis by Customer Type, 2020-2035
  • Figure 72: North America Market Value Share (%) and BPS Analysis by Customer Type, 2025-2035
  • Figure 73: North America Market Y-o-Y Growth (%) Projections by Customer Type, 2025-2035
  • Figure 74: North America Market Value (USD Million) Analysis by Pricing Model, 2020-2035
  • Figure 75: North America Market Volume (Units) Analysis by Pricing Model, 2020-2035
  • Figure 76: North America Market Value Share (%) and BPS Analysis by Pricing Model, 2025-2035
  • Figure 77: North America Market Y-o-Y Growth (%) Projections by Pricing Model, 2025-2035
  • Figure 78: North America Market Attractiveness by Asset Type, 2025-2035
  • Figure 79: North America Market Attractiveness by Service Mode, 2025-2035
  • Figure 80: North America Market Attractiveness by Provider Type, 2025-2035
  • Figure 81: North America Market Attractiveness by Booking Speed, 2025-2035
  • Figure 82: North America Market Attractiveness by Customer Type, 2025-2035
  • Figure 83: North America Market Attractiveness by Pricing Model, 2025-2035
  • Figure 84: North America Market Attractiveness by Country, 2025-2035
  • Figure 85: Latin America Market Value (USD Million) by Asset Type, 2025-2035
  • Figure 86: Latin America Market Value (USD Million) by Service Mode, 2025-2035
  • Figure 87: Latin America Market Value (USD Million) by Provider Type, 2025-2035
  • Figure 88: Latin America Market Value (USD Million) by Booking Speed, 2025-2035
  • Figure 89: Latin America Market Value (USD Million) by Customer Type, 2025-2035
  • Figure 90: Latin America Market Value (USD Million) by Pricing Model, 2025-2035
  • Figure 91: Latin America Market Value (USD Million) by Country, 2025-2035
  • Figure 92: Latin America Market Value (USD Million) Analysis by Country, 2020-2035
  • Figure 93: Latin America Market Volume (Units) Analysis by Country, 2020-2035
  • Figure 94: Latin America Market Value Share (%) and BPS Analysis by Country, 2025-2035
  • Figure 95: Latin America Market Y-o-Y Growth (%) Projections by Country, 2025-2035
  • Figure 96: Latin America Market Value (USD Million) Analysis by Asset Type, 2020-2035
  • Figure 97: Latin America Market Volume (Units) Analysis by Asset Type, 2020-2035
  • Figure 98: Latin America Market Value Share (%) and BPS Analysis by Asset Type, 2025-2035
  • Figure 99: Latin America Market Y-o-Y Growth (%) Projections by Asset Type, 2025-2035
  • Figure 100: Latin America Market Value (USD Million) Analysis by Service Mode, 2020-2035
  • Figure 101: Latin America Market Volume (Units) Analysis by Service Mode, 2020-2035
  • Figure 102: Latin America Market Value Share (%) and BPS Analysis by Service Mode, 2025-2035
  • Figure 103: Latin America Market Y-o-Y Growth (%) Projections by Service Mode, 2025-2035
  • Figure 104: Latin America Market Value (USD Million) Analysis by Provider Type, 2020-2035
  • Figure 105: Latin America Market Volume (Units) Analysis by Provider Type, 2020-2035
  • Figure 106: Latin America Market Value Share (%) and BPS Analysis by Provider Type, 2025-2035
  • Figure 107: Latin America Market Y-o-Y Growth (%) Projections by Provider Type, 2025-2035
  • Figure 108: Latin America Market Value (USD Million) Analysis by Booking Speed, 2020-2035
  • Figure 109: Latin America Market Volume (Units) Analysis by Booking Speed, 2020-2035
  • Figure 110: Latin America Market Value Share (%) and BPS Analysis by Booking Speed, 2025-2035
  • Figure 111: Latin America Market Y-o-Y Growth (%) Projections by Booking Speed, 2025-2035
  • Figure 112: Latin America Market Value (USD Million) Analysis by Customer Type, 2020-2035
  • Figure 113: Latin America Market Volume (Units) Analysis by Customer Type, 2020-2035
  • Figure 114: Latin America Market Value Share (%) and BPS Analysis by Customer Type, 2025-2035
  • Figure 115: Latin America Market Y-o-Y Growth (%) Projections by Customer Type, 2025-2035
  • Figure 116: Latin America Market Value (USD Million) Analysis by Pricing Model, 2020-2035
  • Figure 117: Latin America Market Volume (Units) Analysis by Pricing Model, 2020-2035
  • Figure 118: Latin America Market Value Share (%) and BPS Analysis by Pricing Model, 2025-2035
  • Figure 119: Latin America Market Y-o-Y Growth (%) Projections by Pricing Model, 2025-2035
  • Figure 120: Latin America Market Attractiveness by Asset Type, 2025-2035
  • Figure 121: Latin America Market Attractiveness by Service Mode, 2025-2035
  • Figure 122: Latin America Market Attractiveness by Provider Type, 2025-2035
  • Figure 123: Latin America Market Attractiveness by Booking Speed, 2025-2035
  • Figure 124: Latin America Market Attractiveness by Customer Type, 2025-2035
  • Figure 125: Latin America Market Attractiveness by Pricing Model, 2025-2035
  • Figure 126: Latin America Market Attractiveness by Country, 2025-2035
  • Figure 127: Europe Market Value (USD Million) by Asset Type, 2025-2035
  • Figure 128: Europe Market Value (USD Million) by Service Mode, 2025-2035
  • Figure 129: Europe Market Value (USD Million) by Provider Type, 2025-2035
  • Figure 130: Europe Market Value (USD Million) by Booking Speed, 2025-2035
  • Figure 131: Europe Market Value (USD Million) by Customer Type, 2025-2035
  • Figure 132: Europe Market Value (USD Million) by Pricing Model, 2025-2035
  • Figure 133: Europe Market Value (USD Million) by Country, 2025-2035
  • Figure 134: Europe Market Value (USD Million) Analysis by Country, 2020-2035
  • Figure 135: Europe Market Volume (Units) Analysis by Country, 2020-2035
  • Figure 136: Europe Market Value Share (%) and BPS Analysis by Country, 2025-2035
  • Figure 137: Europe Market Y-o-Y Growth (%) Projections by Country, 2025-2035
  • Figure 138: Europe Market Value (USD Million) Analysis by Asset Type, 2020-2035
  • Figure 139: Europe Market Volume (Units) Analysis by Asset Type, 2020-2035
  • Figure 140: Europe Market Value Share (%) and BPS Analysis by Asset Type, 2025-2035
  • Figure 141: Europe Market Y-o-Y Growth (%) Projections by Asset Type, 2025-2035
  • Figure 142: Europe Market Value (USD Million) Analysis by Service Mode, 2020-2035
  • Figure 143: Europe Market Volume (Units) Analysis by Service Mode, 2020-2035
  • Figure 144: Europe Market Value Share (%) and BPS Analysis by Service Mode, 2025-2035
  • Figure 145: Europe Market Y-o-Y Growth (%) Projections by Service Mode, 2025-2035
  • Figure 146: Europe Market Value (USD Million) Analysis by Provider Type, 2020-2035
  • Figure 147: Europe Market Volume (Units) Analysis by Provider Type, 2020-2035
  • Figure 148: Europe Market Value Share (%) and BPS Analysis by Provider Type, 2025-2035
  • Figure 149: Europe Market Y-o-Y Growth (%) Projections by Provider Type, 2025-2035
  • Figure 150: Europe Market Value (USD Million) Analysis by Booking Speed, 2020-2035
  • Figure 151: Europe Market Volume (Units) Analysis by Booking Speed, 2020-2035
  • Figure 152: Europe Market Value Share (%) and BPS Analysis by Booking Speed, 2025-2035
  • Figure 153: Europe Market Y-o-Y Growth (%) Projections by Booking Speed, 2025-2035
  • Figure 154: Europe Market Value (USD Million) Analysis by Customer Type, 2020-2035
  • Figure 155: Europe Market Volume (Units) Analysis by Customer Type, 2020-2035
  • Figure 156: Europe Market Value Share (%) and BPS Analysis by Customer Type, 2025-2035
  • Figure 157: Europe Market Y-o-Y Growth (%) Projections by Customer Type, 2025-2035
  • Figure 158: Europe Market Value (USD Million) Analysis by Pricing Model, 2020-2035
  • Figure 159: Europe Market Volume (Units) Analysis by Pricing Model, 2020-2035
  • Figure 160: Europe Market Value Share (%) and BPS Analysis by Pricing Model, 2025-2035
  • Figure 161: Europe Market Y-o-Y Growth (%) Projections by Pricing Model, 2025-2035
  • Figure 162: Europe Market Attractiveness by Asset Type, 2025-2035
  • Figure 163: Europe Market Attractiveness by Service Mode, 2025-2035
  • Figure 164: Europe Market Attractiveness by Provider Type, 2025-2035
  • Figure 165: Europe Market Attractiveness by Booking Speed, 2025-2035
  • Figure 166: Europe Market Attractiveness by Customer Type, 2025-2035
  • Figure 167: Europe Market Attractiveness by Pricing Model, 2025-2035
  • Figure 168: Europe Market Attractiveness by Country, 2025-2035
  • Figure 169: East Asia Market Value (USD Million) by Asset Type, 2025-2035
  • Figure 170: East Asia Market Value (USD Million) by Service Mode, 2025-2035
  • Figure 171: East Asia Market Value (USD Million) by Provider Type, 2025-2035
  • Figure 172: East Asia Market Value (USD Million) by Booking Speed, 2025-2035
  • Figure 173: East Asia Market Value (USD Million) by Customer Type, 2025-2035
  • Figure 174: East Asia Market Value (USD Million) by Pricing Model, 2025-2035
  • Figure 175: East Asia Market Value (USD Million) by Country, 2025-2035
  • Figure 176: East Asia Market Value (USD Million) Analysis by Country, 2020-2035
  • Figure 177: East Asia Market Volume (Units) Analysis by Country, 2020-2035
  • Figure 178: East Asia Market Value Share (%) and BPS Analysis by Country, 2025-2035
  • Figure 179: East Asia Market Y-o-Y Growth (%) Projections by Country, 2025-2035
  • Figure 180: East Asia Market Value (USD Million) Analysis by Asset Type, 2020-2035
  • Figure 181: East Asia Market Volume (Units) Analysis by Asset Type, 2020-2035
  • Figure 182: East Asia Market Value Share (%) and BPS Analysis by Asset Type, 2025-2035
  • Figure 183: East Asia Market Y-o-Y Growth (%) Projections by Asset Type, 2025-2035
  • Figure 184: East Asia Market Value (USD Million) Analysis by Service Mode, 2020-2035
  • Figure 185: East Asia Market Volume (Units) Analysis by Service Mode, 2020-2035
  • Figure 186: East Asia Market Value Share (%) and BPS Analysis by Service Mode, 2025-2035
  • Figure 187: East Asia Market Y-o-Y Growth (%) Projections by Service Mode, 2025-2035
  • Figure 188: East Asia Market Value (USD Million) Analysis by Provider Type, 2020-2035
  • Figure 189: East Asia Market Volume (Units) Analysis by Provider Type, 2020-2035
  • Figure 190: East Asia Market Value Share (%) and BPS Analysis by Provider Type, 2025-2035
  • Figure 191: East Asia Market Y-o-Y Growth (%) Projections by Provider Type, 2025-2035
  • Figure 192: East Asia Market Value (USD Million) Analysis by Booking Speed, 2020-2035
  • Figure 193: East Asia Market Volume (Units) Analysis by Booking Speed, 2020-2035
  • Figure 194: East Asia Market Value Share (%) and BPS Analysis by Booking Speed, 2025-2035
  • Figure 195: East Asia Market Y-o-Y Growth (%) Projections by Booking Speed, 2025-2035
  • Figure 196: East Asia Market Value (USD Million) Analysis by Customer Type, 2020-2035
  • Figure 197: East Asia Market Volume (Units) Analysis by Customer Type, 2020-2035
  • Figure 198: East Asia Market Value Share (%) and BPS Analysis by Customer Type, 2025-2035
  • Figure 199: East Asia Market Y-o-Y Growth (%) Projections by Customer Type, 2025-2035
  • Figure 200: East Asia Market Value (USD Million) Analysis by Pricing Model, 2020-2035
  • Figure 201: East Asia Market Volume (Units) Analysis by Pricing Model, 2020-2035
  • Figure 202: East Asia Market Value Share (%) and BPS Analysis by Pricing Model, 2025-2035
  • Figure 203: East Asia Market Y-o-Y Growth (%) Projections by Pricing Model, 2025-2035
  • Figure 204: East Asia Market Attractiveness by Asset Type, 2025-2035
  • Figure 205: East Asia Market Attractiveness by Service Mode, 2025-2035
  • Figure 206: East Asia Market Attractiveness by Provider Type, 2025-2035
  • Figure 207: East Asia Market Attractiveness by Booking Speed, 2025-2035
  • Figure 208: East Asia Market Attractiveness by Customer Type, 2025-2035
  • Figure 209: East Asia Market Attractiveness by Pricing Model, 2025-2035
  • Figure 210: East Asia Market Attractiveness by Country, 2025-2035
  • Figure 211: South Asia & Pacific Market Value (USD Million) by Asset Type, 2025-2035
  • Figure 212: South Asia & Pacific Market Value (USD Million) by Service Mode, 2025-2035
  • Figure 213: South Asia & Pacific Market Value (USD Million) by Provider Type, 2025-2035
  • Figure 214: South Asia & Pacific Market Value (USD Million) by Booking Speed, 2025-2035
  • Figure 215: South Asia & Pacific Market Value (USD Million) by Customer Type, 2025-2035
  • Figure 216: South Asia & Pacific Market Value (USD Million) by Pricing Model, 2025-2035
  • Figure 217: South Asia & Pacific Market Value (USD Million) by Country, 2025-2035
  • Figure 218: South Asia & Pacific Market Value (USD Million) Analysis by Country, 2020-2035
  • Figure 219: South Asia & Pacific Market Volume (Units) Analysis by Country, 2020-2035
  • Figure 220: South Asia & Pacific Market Value Share (%) and BPS Analysis by Country, 2025-2035
  • Figure 221: South Asia & Pacific Market Y-o-Y Growth (%) Projections by Country, 2025-2035
  • Figure 222: South Asia & Pacific Market Value (USD Million) Analysis by Asset Type, 2020-2035
  • Figure 223: South Asia & Pacific Market Volume (Units) Analysis by Asset Type, 2020-2035
  • Figure 224: South Asia & Pacific Market Value Share (%) and BPS Analysis by Asset Type, 2025-2035
  • Figure 225: South Asia & Pacific Market Y-o-Y Growth (%) Projections by Asset Type, 2025-2035
  • Figure 226: South Asia & Pacific Market Value (USD Million) Analysis by Service Mode, 2020-2035
  • Figure 227: South Asia & Pacific Market Volume (Units) Analysis by Service Mode, 2020-2035
  • Figure 228: South Asia & Pacific Market Value Share (%) and BPS Analysis by Service Mode, 2025-2035
  • Figure 229: South Asia & Pacific Market Y-o-Y Growth (%) Projections by Service Mode, 2025-2035
  • Figure 230: South Asia & Pacific Market Value (USD Million) Analysis by Provider Type, 2020-2035
  • Figure 231: South Asia & Pacific Market Volume (Units) Analysis by Provider Type, 2020-2035
  • Figure 232: South Asia & Pacific Market Value Share (%) and BPS Analysis by Provider Type, 2025-2035
  • Figure 233: South Asia & Pacific Market Y-o-Y Growth (%) Projections by Provider Type, 2025-2035
  • Figure 234: South Asia & Pacific Market Value (USD Million) Analysis by Booking Speed, 2020-2035
  • Figure 235: South Asia & Pacific Market Volume (Units) Analysis by Booking Speed, 2020-2035
  • Figure 236: South Asia & Pacific Market Value Share (%) and BPS Analysis by Booking Speed, 2025-2035
  • Figure 237: South Asia & Pacific Market Y-o-Y Growth (%) Projections by Booking Speed, 2025-2035
  • Figure 238: South Asia & Pacific Market Value (USD Million) Analysis by Customer Type, 2020-2035
  • Figure 239: South Asia & Pacific Market Volume (Units) Analysis by Customer Type, 2020-2035
  • Figure 240: South Asia & Pacific Market Value Share (%) and BPS Analysis by Customer Type, 2025-2035
  • Figure 241: South Asia & Pacific Market Y-o-Y Growth (%) Projections by Customer Type, 2025-2035
  • Figure 242: South Asia & Pacific Market Value (USD Million) Analysis by Pricing Model, 2020-2035
  • Figure 243: South Asia & Pacific Market Volume (Units) Analysis by Pricing Model, 2020-2035
  • Figure 244: South Asia & Pacific Market Value Share (%) and BPS Analysis by Pricing Model, 2025-2035
  • Figure 245: South Asia & Pacific Market Y-o-Y Growth (%) Projections by Pricing Model, 2025-2035
  • Figure 246: South Asia & Pacific Market Attractiveness by Asset Type, 2025-2035
  • Figure 247: South Asia & Pacific Market Attractiveness by Service Mode, 2025-2035
  • Figure 248: South Asia & Pacific Market Attractiveness by Provider Type, 2025-2035
  • Figure 249: South Asia & Pacific Market Attractiveness by Booking Speed, 2025-2035
  • Figure 250: South Asia & Pacific Market Attractiveness by Customer Type, 2025-2035
  • Figure 251: South Asia & Pacific Market Attractiveness by Pricing Model, 2025-2035
  • Figure 252: South Asia & Pacific Market Attractiveness by Country, 2025-2035
  • Figure 253: Middle East and Africa Market Value (USD Million) by Asset Type, 2025-2035
  • Figure 254: Middle East and Africa Market Value (USD Million) by Service Mode, 2025-2035
  • Figure 255: Middle East and Africa Market Value (USD Million) by Provider Type, 2025-2035
  • Figure 256: Middle East and Africa Market Value (USD Million) by Booking Speed, 2025-2035
  • Figure 257: Middle East and Africa Market Value (USD Million) by Customer Type, 2025-2035
  • Figure 258: Middle East and Africa Market Value (USD Million) by Pricing Model, 2025-2035
  • Figure 259: Middle East and Africa Market Value (USD Million) by Country, 2025-2035
  • Figure 260: Middle East and Africa Market Value (USD Million) Analysis by Country, 2020-2035
  • Figure 261: Middle East and Africa Market Volume (Units) Analysis by Country, 2020-2035
  • Figure 262: Middle East and Africa Market Value Share (%) and BPS Analysis by Country, 2025-2035
  • Figure 263: Middle East and Africa Market Y-o-Y Growth (%) Projections by Country, 2025-2035
  • Figure 264: Middle East and Africa Market Value (USD Million) Analysis by Asset Type, 2020-2035
  • Figure 265: Middle East and Africa Market Volume (Units) Analysis by Asset Type, 2020-2035
  • Figure 266: Middle East and Africa Market Value Share (%) and BPS Analysis by Asset Type, 2025-2035
  • Figure 267: Middle East and Africa Market Y-o-Y Growth (%) Projections by Asset Type, 2025-2035
  • Figure 268: Middle East and Africa Market Value (USD Million) Analysis by Service Mode, 2020-2035
  • Figure 269: Middle East and Africa Market Volume (Units) Analysis by Service Mode, 2020-2035
  • Figure 270: Middle East and Africa Market Value Share (%) and BPS Analysis by Service Mode, 2025-2035
  • Figure 271: Middle East and Africa Market Y-o-Y Growth (%) Projections by Service Mode, 2025-2035
  • Figure 272: Middle East and Africa Market Value (USD Million) Analysis by Provider Type, 2020-2035
  • Figure 273: Middle East and Africa Market Volume (Units) Analysis by Provider Type, 2020-2035
  • Figure 274: Middle East and Africa Market Value Share (%) and BPS Analysis by Provider Type, 2025-2035
  • Figure 275: Middle East and Africa Market Y-o-Y Growth (%) Projections by Provider Type, 2025-2035
  • Figure 276: Middle East and Africa Market Value (USD Million) Analysis by Booking Speed, 2020-2035
  • Figure 277: Middle East and Africa Market Volume (Units) Analysis by Booking Speed, 2020-2035
  • Figure 278: Middle East and Africa Market Value Share (%) and BPS Analysis by Booking Speed, 2025-2035
  • Figure 279: Middle East and Africa Market Y-o-Y Growth (%) Projections by Booking Speed, 2025-2035
  • Figure 280: Middle East and Africa Market Value (USD Million) Analysis by Customer Type, 2020-2035
  • Figure 281: Middle East and Africa Market Volume (Units) Analysis by Customer Type, 2020-2035
  • Figure 282: Middle East and Africa Market Value Share (%) and BPS Analysis by Customer Type, 2025-2035
  • Figure 283: Middle East and Africa Market Y-o-Y Growth (%) Projections by Customer Type, 2025-2035
  • Figure 284: Middle East and Africa Market Value (USD Million) Analysis by Pricing Model, 2020-2035
  • Figure 285: Middle East and Africa Market Volume (Units) Analysis by Pricing Model, 2020-2035
  • Figure 286: Middle East and Africa Market Value Share (%) and BPS Analysis by Pricing Model, 2025-2035
  • Figure 287: Middle East and Africa Market Y-o-Y Growth (%) Projections by Pricing Model, 2025-2035
  • Figure 288: Middle East and Africa Market Attractiveness by Asset Type, 2025-2035
  • Figure 289: Middle East and Africa Market Attractiveness by Service Mode, 2025-2035
  • Figure 290: Middle East and Africa Market Attractiveness by Provider Type, 2025-2035
  • Figure 291: Middle East and Africa Market Attractiveness by Booking Speed, 2025-2035
  • Figure 292: Middle East and Africa Market Attractiveness by Customer Type, 2025-2035
  • Figure 293: Middle East and Africa Market Attractiveness by Pricing Model, 2025-2035
  • Figure 294: Middle East and Africa Market Attractiveness by Country, 2025-2035

Frequently Asked Questions

How big is the Global On-Demand Repair Services Market in 2025?

The global market is estimated at USD 21,876.0 million in 2025.

What will be the size of the Global On-Demand Repair Services Market in 2035?

The market is projected to reach USD 79,411.5 million by 2035.

How much will the Global On-Demand Repair Services Market grow between 2025 and 2035?

The market is expected to grow at a 13.8% CAGR between 2025 and 2035.

What are the key segments in the Global On-Demand Repair Services Market?

Asset type, service mode, provider type, booking speed, customer type, and pricing model.

Which segment will contribute a significant share in the Global On-Demand Repair Services Market in 2025?

At-home / on-site repair leads within service mode with a 58.3% share in 2025 (USD 12,753.71 million).

Which asset type has notable share in 2025?

Smartphones & tablets account for 32.4% in 2025 (USD 7,087.82 million).

Explore Similar Insights

Future Market Insights

On-Demand Repair Services Market