AI-based Research Services Market Size and Share Forecast Outlook 2025 to 2035

The AI-based Research Services Market is expected to record a valuation of USD 7,972.1 million in 2025 and USD 35,420.4 million in 2035, with an increase of USD 27,448.3 million, which equals a growth of 344% over the decade. The overall expansion represents a CAGR of 16.1% and a 4.4X increase in market size.
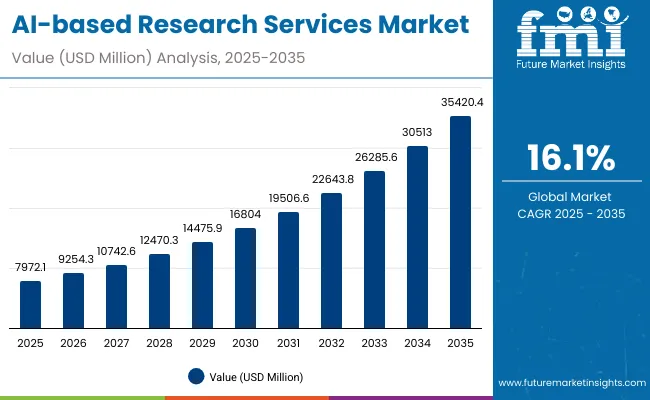
Quick Stats for AI-based Research Services Market

  • Market Value (2025): USD 7,972.1 million
  • Forecast Value (2035): USD 35,420.4 million
  • Forecast CAGR (2025 to 2035): 16.1%
  • Leading Segment in 2025: AI-accelerated survey analytics (38.3%)
  • Key Growth Regions: United States, China, India, Germany, Japan
  • Top Key Players: Qualtrics, Kantar, Ipsos, NIQ (NielsenIQ), Dynata, YouGov, Toluna, Zappi, Quantilope

Ai Based Research Services Market

AI-based Research Services Market Key Takeaway

Metric Value
Estimated Value in 2025E USD 7,972.1 million
Forecast Value in 2035F USD 35,420.4 million
Forecast CAGR (2025 to 2035) 16.1%

During the first five-year period from 2025 to 2030, the market increases from USD 7,972.1 million to USD 16,804.0 million, adding USD 8,831.9 million, which accounts for 32% of the total decade growth. This phase records steady adoption across consumer packaged goods (CPG) & retail, financial services, and technology industries, driven by the need for faster consumer insights and predictive analytics. AI-accelerated survey analytics dominates this period with 38.3% share, as enterprises increasingly automate survey feedback and real-time opinion tracking.

The second half from 2030 to 2035 contributes USD 18,616.4 million, equal to 68% of total growth, as the market jumps from USD 16,804.0 million to USD 35,420.4 million. This acceleration is powered by the widespread deployment of synthetic respondents, predictive AI models, and sentiment intelligence platforms across enterprises. Managed services hold a leading share of 61.7%, while China emerges as the fastest-growing country with a 14.3% CAGR, driven by large-scale use of AI-based text and social data analytics. By 2035, global players such as Qualtrics, Kantar, Ipsos, and Dynata expand their AI-driven SaaS and hybrid research platforms, fueling recurring subscription revenues.

From 2020 to 2024, the AI Market Research Services industry grew steadily as enterprises began experimenting with automation, predictive analytics, and social listening tools. During this phase, the competitive landscape was dominated by traditional research firms controlling the majority of revenue, with leaders such as Kantar, Ipsos, and NIQ leveraging established survey-based methodologies. Competitive differentiation largely relied on panel size, reach, and cost efficiency, while AI capabilities were often positioned as add-ons rather than core offerings. Pure-play AI-led service providers had limited traction, contributing less than 15% of the total market value.

Demand for AI-driven market research accelerates to USD 7,972.1 million in 2025, and the revenue mix shifts as platform-led models and managed services account for over 60% of growth. Traditional leaders now face rising competition from digital-first firms like Qualtrics, Zappi, and Quantilope, which offer self-serve SaaS platforms, virtual panel simulations, and subscription-based insights. Major incumbents are pivoting to hybrid delivery models, integrating analytics dashboards, synthetic respondents, and real-time sentiment engines to retain relevance. Emerging entrants specializing in cloud interoperability, predictive modeling, and multimodal data analytics (text, image, voice, and clickstream) are gaining share. The competitive edge is moving away from survey scale alone to ecosystem strength, speed, scalability, and recurring SaaS revenues.

Why the AI Market Research Services Market is growing?

The adoption of AI-driven respondent modeling is reducing dependency on costly, time-consuming human panels. Virtual simulations allow enterprises to test concepts, ads, and messaging instantly at scale, enabling faster time-to-insight. This structural shift is driving efficiency gains and boosting demand across consumer-focused industries.

Companies are increasingly leveraging AI to analyze unstructured datasets such as reviews, call transcripts, and shopper behavior telemetry. The ability to unify these data streams into predictive insights gives businesses a competitive edge, fueling adoption of AI-powered market research platforms in sectors like retail, technology, and financial services.

Segmental Analysis

The AI-based Research Services Market is segmented by service type, delivery model, data modality, end-use industry, pricing model, and region. Key service types include survey analytics, predictive forecasting, sentiment analytics, creative testing, and synthetic respondent simulations. Delivery spans SaaS platforms, managed services, and hybrid models, while data modalities cover text, image/video, behavioral, and voice sources. End-use industries range from CPG & retail, technology, and healthcare to finance, automotive, and media. Pricing models include subscription, project-based, and API usage. Regionally, North America and Europe remain strongholds, with Asia-Pacific, especially China and India, showing the fastest growth.
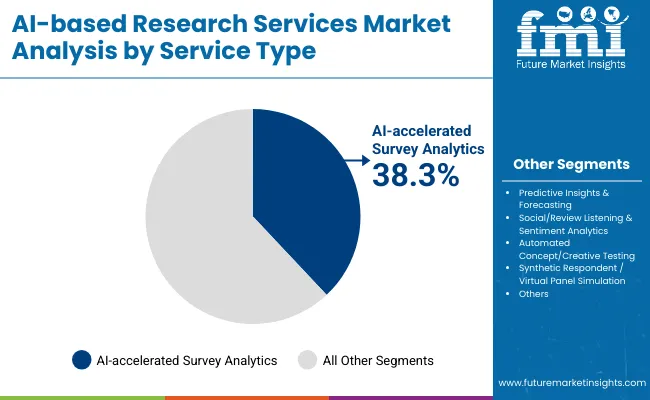
Insights into the Service Type Segment with AI-Accelerated Survey Analytics Leading

Ai Based Research Services Market By Service

Service Type Value Share% 2025
AI-accelerated survey analytics 38.3%
Others 61.7%

The AI-accelerated survey analytics segment is projected to contribute 38.3% of the AI-based Research Services revenue in 2025, maintaining its lead as the dominant service category. Growth is driven by enterprises adopting automated tools to streamline survey design, capture real-time feedback, and generate predictive insights at scale. Organizations are prioritizing these solutions for their ability to reduce costs, minimize human bias, and accelerate decision-making across industries.

The segment’s expansion is also supported by the integration of natural language processing (NLP) and generative AI, which enhance analysis depth and enable multilingual, multi-market survey deployment. As hybrid research models and cloud-based platforms become more prevalent, AI-accelerated survey analytics is expected to remain the backbone of AI-driven market research, powering both consumer insights and enterprise intelligence functions.
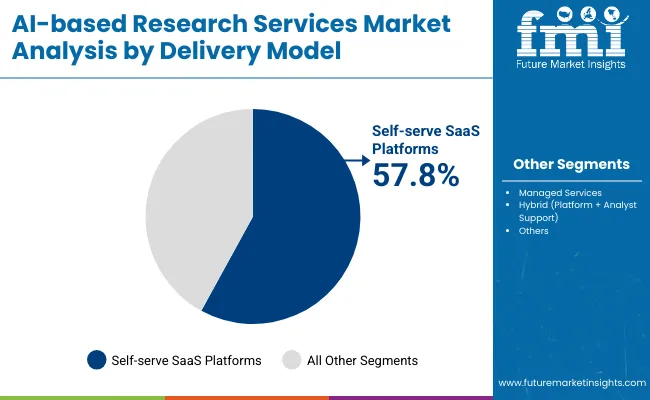
Insights into the Delivery Model Segment with Self-Serve SaaS Platforms Dominating the Demand

Ai Based Research Services Market By Delivery

Delivery Model Value Share% 2025
Self-serve SaaS platforms 57.8%
Others 42.2%

The Self-serve SaaS platforms segment is forecasted to hold 57.8% of the market share in 2025, driven by its ease of deployment, scalability, and cost efficiency. These platforms allow businesses to quickly adopt AI solutions without requiring heavy infrastructure investments, making them particularly attractive for SMEs and enterprises aiming for rapid AI integration. Their user-friendly interfaces, subscription-based pricing, and ability to deliver real-time insights have facilitated widespread adoption across industries such as retail, healthcare, BFSI, and manufacturing. The segment’s growth is further bolstered by advancements in cloud computing and low-code/no-code tools that simplify AI implementation.
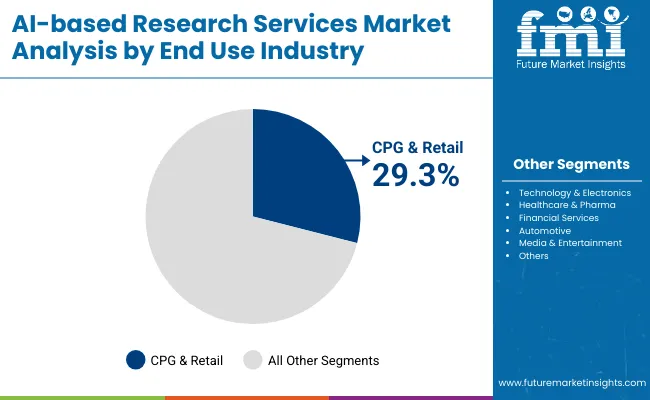
Insights into the End Use Industry Segment with CPG & Retail Leading

Ai Based Research Services Market By End Use

End Use Industry Value Share% 2025
CPG & Retail 29.3%
Others 70.7%

The CPG & Retail segment is projected to account for 29.3% of the AI-based Research Services revenue in 2025, establishing it as the leading end-use industry. This segment is driving adoption due to its constant need for real-time consumer insights, demand forecasting, and competitive benchmarking. Retailers and consumer goods companies are increasingly relying on AI to analyze shopper behavior, track sentiment across digital channels, and optimize product launches.

Its suitability for capturing large-scale consumer feedback and integrating diverse data sources such as reviews, social media, and clickstream analytics has made it a natural fit for this industry. Advancements in predictive modeling and virtual panel simulations further enhance decision-making speed, enabling brands to respond quickly to shifting consumer preferences. Given its scale and innovation intensity, CPG & Retail is expected to maintain its leading role in the AI-based Research Services Market throughout the forecast period.

What are the Drivers, Restraints, and Key Trends of the AI-based Research Services Market?

Rise of Synthetic Respondents and Virtual Panels

One of the strongest growth drivers is the emergence of synthetic respondents and AI-powered virtual panels. Traditional research methods rely on time-intensive human panels that are costly, prone to fatigue, and geographically limited. By contrast, synthetic respondents simulate human-like behavior and decision-making, enabling companies to test concepts, advertisements, and product ideas instantly and at scale. This innovation reduces dependence on panel recruitment and accelerates feedback cycles from months to hours. As consumer-facing industries such as CPG, media, and retail increasingly prioritize speed-to-insight, the adoption of virtual panels is expected to expand sharply, driving the structural shift from conventional market research to AI-driven methodologies.

Multimodal Data Integration Enhancing Predictive Insights

The ability to unify and analyze diverse data streams text from surveys and reviews, image/video from creative tests, behavioral clickstream data, and voice from call transcriptsis a significant growth catalyst. Unlike traditional methods that focus heavily on structured survey data, AI enables cross-modal insights by detecting correlations between sentiment, behavior, and purchasing intent. For example, retailers can combine shopper telemetry with social sentiment to forecast demand more accurately, while financial services firms can integrate voice analytics with transaction data to identify emerging risks. This holistic, predictive capability is reshaping how organizations interpret markets, making AI-powered research indispensable for strategy and innovation.

Data Privacy and Ethical Constraints in AI-driven Research

A major restraint in the AI-based Research Services industry is the challenge of data privacy and ethical governance. AI platforms often process sensitive consumer data, including behavioral telemetry, voice transcripts, and sentiment extracted from social platforms. Ensuring compliance with global frameworks such as GDPR, CCPA, and emerging AI regulations adds complexity and cost to deployment. Additionally, concerns about algorithmic bias in synthetic respondents and sentiment models can undermine trust if outputs appear skewed. Enterprises adopting these solutions must balance innovation with ethical safeguards, which slows adoption among highly regulated industries such as healthcare and finance. This restraint could limit rapid scaling unless vendors proactively address transparency and compliance requirements.

Shift Toward Hybrid Delivery Models Combining SaaS Platforms with Analyst Expertise

A key trend shaping the market is the transition from purely managed research services to hybrid delivery models, where AI platforms handle data processing and visualization, while human analysts provide strategic interpretation. Enterprises increasingly seek a balance between automation efficiency and expert contextualization, particularly for high-stakes decisions like product launches or M&A analysis. Hybrid models allow clients to self-serve for routine projects while relying on expert validation for complex studies, ensuring credibility and depth. This trend is also tied to monetization shifts, as providers blend subscription-based SaaS revenue with premium analyst consulting fees, creating sustainable, recurring income streams while maintaining competitive differentiation.
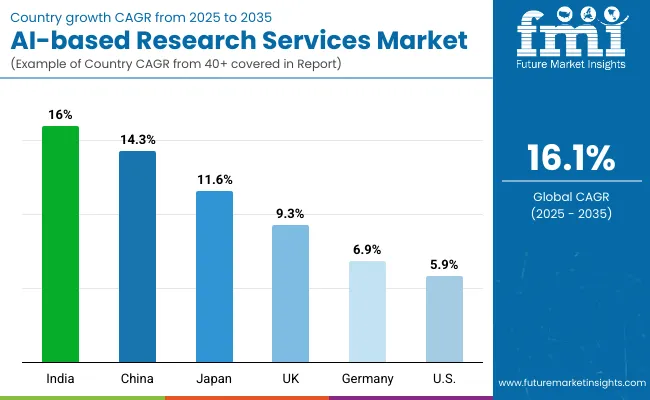
Analysis of AI-based Research Services Market By Key Countries

Ai Based Research Services Market By Country

Countries Estimated CAGR (2025 to 2035)
China 14.3%
USA 5.9%
India 16.0%
UK 9.3%
Germany 6.9%
Japan 11.6%

The global AI-based Research Services sector shows clear regional disparities, strongly shaped by digital adoption, enterprise cloud migration, and regulatory frameworks. Asia-Pacific emerges as the fastest-growing region, anchored by China at 14.3% CAGR and India at 16.0% CAGR. Growth here is fueled by heavy investment in AI-enabled consumer insights platforms, government-backed digitalization programs, and expanding e-commerce ecosystems. India’s trajectory reflects rapid enterprise SaaS adoption and increasing outsourcing demand for AI-driven market analytics.

Europe maintains strong momentum, led by the UK at 9.3% and Germany at 6.9%, supported by strict data privacy regulations, corporate ESG compliance reporting, and adoption of AI-driven consumer behavior tracking. Vendors here are leveraging AI to align with GDPR standards while enabling advanced sentiment and predictive analytics.

North America shows steady but mature growth, with the USA at 5.9% CAGR, where AI-based Research Services are deeply integrated into enterprises but shifting toward specialized use cases like hyper-personalized marketing and real-time consumer journey mapping. Japan, at 11.6% CAGR, demonstrates strong adoption of AI-driven retail and CPG research platforms, supported by its innovation focus in customer engagement and digital experience optimization.
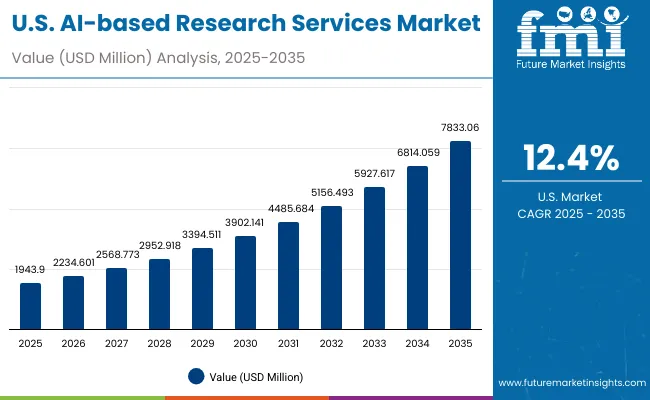
Sales Outlook for AI-based Research Services in the United States

Ai Based Research Services Market Usa

Year USA AI-based Research Services
2025 1943.90
2026 2234.60
2027 2568.77
2028 2952.91
2029 3394.51
2030 3902.14
2031 4485.68
2032 5156.49
2033 5927.61
2034 6814.05
2035 7833.06

The USA AI-based Research Services sector is projected to grow from USD 1,943.9 million in 2025 to USD 7,833.1 million by 2035, reflecting a CAGR of 12.4%. Growth is driven by rising adoption of AI-accelerated consumer insights, predictive analytics, and real-time sentiment tracking across industries.

Adoption is particularly strong in retail, CPG, and financial services, leveraging AI for hyper-personalized campaigns and behavioral modeling. Healthcare and pharma are integrating AI-driven research for patient-centric strategies and drug commercialization, while entertainment and education increasingly deploy AI for adaptive content and audience analytics.

The market is also shifting toward SaaS-based AI platforms, enabling faster, scalable insights delivery. Collaborations between research providers and cloud AI vendors are strengthening competitive positioning.

Key Drivers in the USA

  • Expansion of predictive analytics in CPG and retail.
  • Rising adoption in healthcare and pharma.
  • Shift toward SaaS-based, cloud-integrated delivery models.

Growth and Expansion Outlook for AI-based Research Services in the United Kingdom

The AI-based Research Services sector in the United Kingdom is projected to grow at a CAGR of 9.3%, driven by adoption across consumer-centric industries and public initiatives. Retail and CPG firms are leveraging AI-driven insights for real-time demand sensing, predictive merchandising, and dynamic pricing models. Financial institutions are increasingly using AI to track market sentiment, fraud indicators, and evolving consumer behavior. Government-backed innovation hubs and university-led AI research programs are boosting adoption, particularly among SMEs. Meanwhile, media and entertainment companies are integrating AI for audience engagement analytics and targeted content personalization.

  • Retailers are applying AI to forecast consumer demand and optimize pricing strategies.
  • Financial institutions are adopting AI-driven research to track sentiment and behavioral shifts.
  • Media & entertainment players are using AI for content personalization and viewer analytics.

Growth and Expansion Outlook for AI-based Research Services in India

India is set to register one of the fastest growth trajectories in the AI-based Research Services sector, with a projected CAGR of 16.0% through 2035. The expansion is fueled by rising adoption among MSMEs in tier-2 and tier-3 cities, supported by lower entry costs and cloud-based platforms. Consumer goods firms are using AI-driven analytics for distribution optimization and rural demand forecasting, while telecom players are leveraging AI to track churn and digital service uptake. Academic institutions and skilling centers are embedding AI tools into research curricula, preparing talent pipelines for AI-enabled industries. Government-backed Digital India initiatives and data localization policies are further accelerating adoption across public and private sectors.
  • MSMEs are adopting affordable AI research tools for consumer trend forecasting.
  • Telecom firms are leveraging AI to reduce churn and analyze digital adoption patterns.
  • Academic institutes are introducing AI-driven analytics in training and research programs.

Sales Outlook for AI-based Research Services in China

Ai Based Research Services Market China

The AI-based Research Services sector in China is expected to grow at a CAGR of 14.3%, the highest among leading economies. Growth is driven by smart city programs, large-scale digital transformation projects, and aggressive competition among local AI providers. Consumer electronics and automotive firms are deploying AI-driven research to accelerate product development and customer insights. Municipal governments are integrating AI-based analytics into urban planning, mobility solutions, and public service optimization. The rise of cost-effective AI platforms from domestic companies is expanding access across education, retail, and e-commerce ecosystems. With strong state support and cross-industry digitization, China is cementing itself as a global AI research hub.

  • Smart city initiatives are accelerating AI-driven analytics in infrastructure planning.
  • Electronics and automotive firms are adopting AI research for R&D and consumer analysis.
  • Local AI platforms are enabling mass adoption through competitive pricing and scalability.

In-depth Analysis of AI-based Research Services in Germany

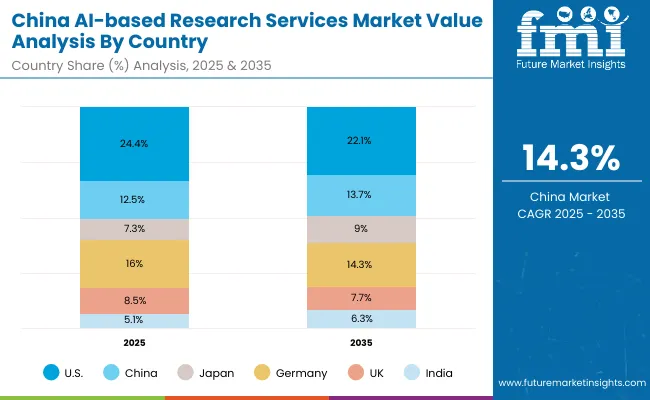
Countries 2025 Share (%)
USA 24.4%
China 12.5%
Japan 7.3%
Germany 16.0%
UK 8.5%
India 5.1%
Countries 2035 Share (%)
USA 22.1%
China 13.7%
Japan 9.0%
Germany 14.3%
UK 7.7%
India 6.3%

Germany holds a 16.0% global share in 2025, projected to decline slightly to 14.3% by 2035, though the market will still expand in absolute terms at a CAGR of 6.9%. Growth is underpinned by precision engineering strengths, Industry 4.0 adoption, and compliance-driven innovation. German enterprises are integrating AI-powered research platforms with industrial automation to enable real-time quality assurance and efficiency gains.

Manufacturing firms are adopting AI-driven insights for CNC workflow optimization, predictive maintenance, and supply chain forecasting, while healthcare labs are shifting toward digital modeling in dental and orthopedic care, reducing errors and turnaround time. Strict EU compliance standards and a strong emphasis on sustainable prototyping and production are further accelerating adoption across traditional and advanced manufacturing.
  • AI platforms are integrated with robotics for quality assurance and dimensional validation.
  • Manufacturing relies on AI insights for CNC optimization and predictive maintenance.
  • Healthcare labs are advancing digital modeling in dental and orthopedic care.

Growth Outlook for AI-based Research Services in USA

Ai Based Research Services Market Usa 2

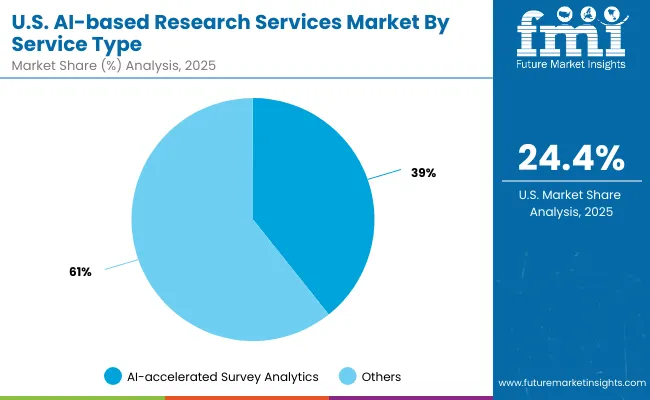
USA By Service Type Value Share% 2025
AI-accelerated survey analytics 39.3%
Others 60.7%

The USA accounts for 24.4% of the global AI-based Research Services share in 2025, projected to ease slightly to 22.1% by 2035, though the market will continue expanding in absolute terms. Growth is driven by the country’s leadership in AI-accelerated analytics, cloud infrastructure, and enterprise digital transformation. By 2025, AI-accelerated survey analytics alone represent 39.3% of the USA market, reflecting strong demand for faster, more accurate consumer insights.

Enterprises are increasingly embedding AI into survey design, sentiment analysis, and behavioral prediction to enhance decision-making across retail, finance, and healthcare. Advanced cloud ecosystems, combined with large-scale structured and unstructured datasets, further strengthen the USA position as a hub for innovation. Regulatory flexibility and the presence of major AI vendors also foster rapid commercialization of AI-driven market research platforms.
  • AI-accelerated survey analytics account for 39.3% of USA market share in 2025.
  • Enterprises deploy AI for sentiment analysis, campaign optimization, and predictive insights.
  • Strong cloud and big data infrastructure underpins scalability and rapid adoption.

Opportunity Analysis of China AI-based Research Services

Ai Based Research Services Market China 2

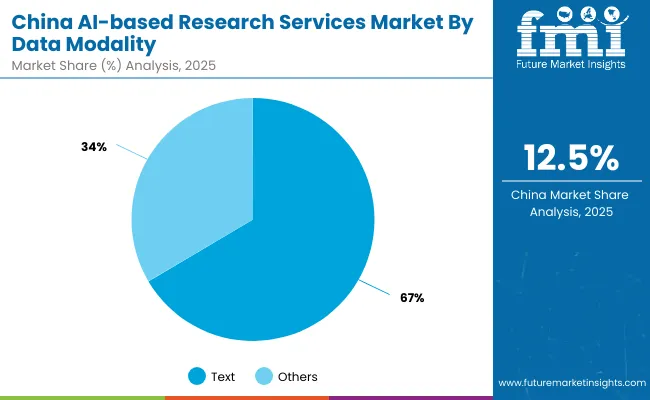
China By Data Modality Value Share% 2025
Text 66.5%
Others 33.5%

China holds 12.5% of the global AI-based Research Services share in 2025, projected to rise to 13.7% by 2035, supported by its massive digital ecosystem, government-backed AI programs, and strong local tech players. By modality, text-based data dominates with 66.5% share in 2025, reflecting the overwhelming scale of e-commerce, social media, and mobile-first interactions that generate vast volumes of text-rich consumer data.

Chinese enterprises are increasingly leveraging AI-driven NLP platforms to analyze consumer sentiment, optimize digital campaigns, and predict buying behavior across retail and financial services. The availability of large, local-language datasets provides a competitive advantage, enabling algorithms that capture cultural nuance with higher accuracy than global peers. Beyond text, demand for voice and video analytics is rising in smart city initiatives, compliance monitoring, and retail operations.
  • Text modality leads with 66.5% share in 2025, driven by digital-first consumer interactions.
  • Government support and smart city initiatives expand opportunities in multimodal analytics.
  • Rising demand for voice and video AI in compliance, retail monitoring, and financial services.

Competitive Landscape of AI-based Research Services Market

Ai Based Research Services Market By Company

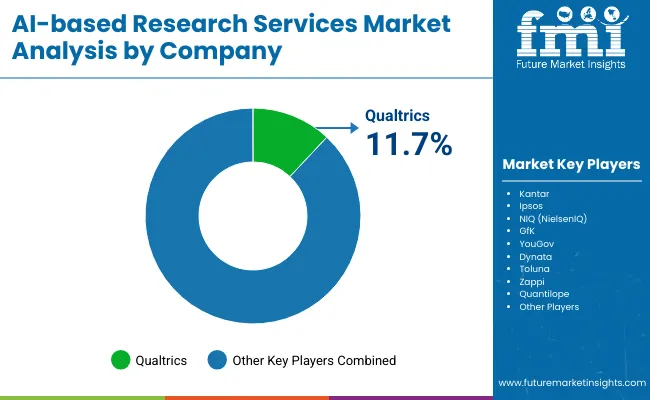
In 2025, Qualtrics holds 11.7% of the global AI-based Research Services share, while the remaining 88.3% is split among a wide range of competitors, indicating a moderately fragmented landscape. The market is shaped by a mix of global technology leaders, mid-sized innovators, and niche-focused providers, each targeting distinct service models and client segments.

Global leaders such as Qualtrics, NielsenIQ, and Ipsos are driving adoption through AI-accelerated survey analytics, predictive modeling, and cloud-based platforms that integrate seamlessly with enterprise software ecosystems. Their strategies increasingly focus on end-to-end research automation, real-time consumer insight generation, and integration with business intelligence platforms.

Mid-sized innovators including SurveyMonkey (Momentive), Dynata, and Lucid are differentiating by offering cost-efficient SaaS research tools powered by AI-based text, voice, and image analytics. They emphasize portability, user-friendliness, and integration with marketing and CRM systems, making them especially relevant for SMEs and digital-first enterprises.

Specialist providers such as Remesh, Black Swan Data, and Zappi focus on niche AI applications, including conversational AI for focus groups, predictive trend analysis, and rapid product testing. Their competitive strength lies in customization, agility, and regional adaptability, often outperforming larger firms in targeted use cases.

Competitive differentiation is increasingly shifting away from traditional survey design toward AI-driven ecosystems, where predictive analytics, multimodal insights, and subscription-based service models are key levers of market success.

Key Developments in AI-based Research Services Market

  • 2024 - Generative AI Adoption in Research Platforms: Major players like Qualtrics and Ipsos introduced GenAI-powered assistants that automate survey creation, analyze open-text responses, and generate real-time insights, reducing project turnaround times significantly.
  • 2025 - Rise of Multimodal Analytics: Platforms expanded beyond text to include voice, video, and image data processing, enabling richer sentiment and behavioral analysis, with adoption accelerating across retail, media, and healthcare sectors.

Scope of the Report

Item Value
Quantitative Units USD 7,972.1 Million
Service Type AI-accelerated survey analytics, Predictive insights & forecasting, Social/review listening & sentiment analytics, Automated concept/creative testing, Synthetic respondent / virtual panel simulation
Delivery Model Self-serve SaaS platforms, Managed services, Hybrid (platform + analyst support)
Data Modality Text (surveys, reviews, social), Image/video (creative tests, shelf/UX sims), Behavioral/clickstream & telemetry, Audio/voice (call/chat transcripts)
End Use Industry CPG & Retail, Technology & Electronics, Healthcare & Pharma, Financial Services, Automotive, Media & Entertainment
Pricing Model Subscription, Project-based, Usage-based/API
Regions Covered North America, Europe, Asia-Pacific, Latin America, Middle East & Africa
Country Covered United States, Canada, Germany, France, United Kingdom, China, Japan, India, Brazil, South Africa
Key Companies Profiled Qualtrics, Kantar, Ipsos, NIQ ( NielsenIQ ), GfK, YouGov, Dynata, Toluna, Zappi, Quantilope
Additional Attributes Dollar sales by scanner type and end-use industry, adoption trends in reverse engineering and quality control, rising demand for handheld and portable 3D scanners, sector-specific growth in aerospace, automotive, and healthcare, software and services revenue segmentation, integration with AR/VR and digital twin technologies, regional trends influenced by digitization initiatives, and innovations in laser triangulation, structured light, and photogrammetry methods.

Key Segments

By Service Type:

  • AI-accelerated survey analytics
  • Predictive insights & forecasting
  • Social/review listening & sentiment analytics
  • Automated concept/creative testing
  • Synthetic respondent / virtual panel simulation

By Delivery Model:

  • Self-serve SaaS platforms
  • Managed services
  • Hybrid (platform + analyst support)

By Data Modality:

  • Text (surveys, reviews, social)
  • Image/video (creative tests, shelf/UX sims)
  • Behavioral/clickstream & telemetry
  • Audio/voice (call/chat transcripts)

By End Use Industry:

  • CPG & Retail
  • Technology & Electronics
  • Healthcare & Pharma
  • Financial Services
  • Automotive
  • Media & Entertainment

By Pricing Model:

  • Subscription
  • Project-based
  • Usage-based/API

By Booking Channel:

  • App / web booking
  • Walk-in / phone

By Region:

  • North America
  • Latin America
  • Europe
  • East Asia
  • South Asia & Pacific
  • Middle East and Africa

Table of Content

  1. Executive Summary
    • Global Market Outlook
    • Demand-side Trends
    • Supply-side Trends
    • Technology Roadmap Analysis
    • Analysis and Recommendations
  2. Market Overview
    • Market Coverage / Taxonomy
    • Market Definition / Scope / Limitations
  3. Market Background
    • Market Dynamics
      • Drivers
      • Restraints
      • Opportunity
      • Trends
    • Scenario Forecast
      • Demand in Optimistic Scenario
      • Demand in Likely Scenario
      • Demand in Conservative Scenario
    • Opportunity Map Analysis
    • Product Life Cycle Analysis
    • Supply Chain Analysis
      • Supply Side Participants and their Roles
        • Producers
        • Mid-Level Participants (Traders/ Agents/ Brokers)
        • Wholesalers and Distributors
      • Value Added and Value Created at Node in the Supply Chain
      • List of Raw Material Suppliers
      • List of Existing and Potential Buyer’s
    • Investment Feasibility Matrix
    • Value Chain Analysis
      • Profit Margin Analysis
      • Wholesalers and Distributors
      • Retailers
    • PESTLE and Porter’s Analysis
    • Regulatory Landscape
      • By Key Regions
      • By Key Countries
    • Regional Parent Market Outlook
    • Production and Consumption Statistics
    • Import and Export Statistics
  4. Global Market Analysis 2020 to 2024 and Forecast, 2025 to 2035
    • Historical Market Size Value (USD Million) & Volume (Units) Analysis, 2020 to 2024
    • Current and Future Market Size Value (USD Million) & Volume (Units) Projections, 2025 to 2035
      • Y-o-Y Growth Trend Analysis
      • Absolute $ Opportunity Analysis
  5. Global Market Analysis 2020 to 2024 and Forecast 2025 to 2035, By Service Type
    • Introduction / Key Findings
    • Historical Market Size Value (USD Million) & Volume (Units) Analysis By Service Type, 2020 to 2024
    • Current and Future Market Size Value (USD Million) & Volume (Units) Analysis and Forecast By Service Type, 2025 to 2035
      • AI-accelerated survey analytics
      • Predictive insights & forecasting
      • Social/review listening & sentiment analytics
      • Automated concept/creative testing
      • Synthetic respondent / virtual panel simulation
    • Y-o-Y Growth Trend Analysis By Service Type, 2020 to 2024
    • Absolute $ Opportunity Analysis By Service Type, 2025 to 2035
  6. Global Market Analysis 2020 to 2024 and Forecast 2025 to 2035, By Delivery Model
    • Introduction / Key Findings
    • Historical Market Size Value (USD Million) & Volume (Units) Analysis By Delivery Model, 2020 to 2024
    • Current and Future Market Size Value (USD Million) & Volume (Units) Analysis and Forecast By Delivery Model, 2025 to 2035
      • Self-serve SaaS platforms
      • Managed services
      • Hybrid (platform + analyst support)
    • Y-o-Y Growth Trend Analysis By Delivery Model, 2020 to 2024
    • Absolute $ Opportunity Analysis By Delivery Model, 2025 to 2035
  7. Global Market Analysis 2020 to 2024 and Forecast 2025 to 2035, By Data Modality
    • Introduction / Key Findings
    • Historical Market Size Value (USD Million) & Volume (Units) Analysis By Data Modality, 2020 to 2024
    • Current and Future Market Size Value (USD Million) & Volume (Units) Analysis and Forecast By Data Modality, 2025 to 2035
      • Text (surveys, reviews, social)
      • Image/video (creative tests, shelf/UX sims)
      • Behavioral/clickstream & telemetry
      • Audio/voice (call/chat transcripts)
    • Y-o-Y Growth Trend Analysis By Data Modality, 2020 to 2024
    • Absolute $ Opportunity Analysis By Data Modality, 2025 to 2035
  8. Global Market Analysis 2020 to 2024 and Forecast 2025 to 2035, By End Use Industry
    • Introduction / Key Findings
    • Historical Market Size Value (USD Million) & Volume (Units) Analysis By End Use Industry, 2020 to 2024
    • Current and Future Market Size Value (USD Million) & Volume (Units) Analysis and Forecast By End Use Industry, 2025 to 2035
      • CPG & Retail
      • Technology & Electronics
      • Healthcare & Pharma
      • Financial Services
      • Automotive
      • Media & Entertainment
    • Y-o-Y Growth Trend Analysis By End Use Industry, 2020 to 2024
    • Absolute $ Opportunity Analysis By End Use Industry, 2025 to 2035
  9. Global Market Analysis 2020 to 2024 and Forecast 2025 to 2035, By Pricing Model
    • Introduction / Key Findings
    • Historical Market Size Value (USD Million) & Volume (Units) Analysis By Pricing Model, 2020 to 2024
    • Current and Future Market Size Value (USD Million) & Volume (Units) Analysis and Forecast By Pricing Model, 2025 to 2035
      • Subscription
      • Project-based
      • Usage-based/API
    • Y-o-Y Growth Trend Analysis By Pricing Model, 2020 to 2024
    • Absolute $ Opportunity Analysis By Pricing Model, 2025 to 2035
  10. Global Market Analysis 2020 to 2024 and Forecast 2025 to 2035, By Booking Channel
    • Introduction / Key Findings
    • Historical Market Size Value (USD Million) & Volume (Units) Analysis By Booking Channel, 2020 to 2024
    • Current and Future Market Size Value (USD Million) & Volume (Units) Analysis and Forecast By Booking Channel, 2025 to 2035
      • App / web booking
      • Walk-in / phone
    • Y-o-Y Growth Trend Analysis By Booking Channel, 2020 to 2024
    • Absolute $ Opportunity Analysis By Booking Channel, 2025 to 2035
  11. Global Market Analysis 2020 to 2024 and Forecast 2025 to 2035, By Region
    • Introduction
    • Historical Market Size Value (USD Million) & Volume (Units) Analysis By Region, 2020 to 2024
    • Current Market Size Value (USD Million) & Volume (Units) Analysis and Forecast By Region, 2025 to 2035
      • North America
      • Latin America
      • Europe
      • East Asia
      • South Asia & Pacific
      • Middle East and Africa
    • Market Attractiveness Analysis By Region
  12. North America Market Analysis 2020 to 2024 and Forecast 2025 to 2035, By Country
    • Historical Market Size Value (USD Million) & Volume (Units) Trend Analysis By Market Taxonomy, 2020 to 2024
    • Market Size Value (USD Million) & Volume (Units) Forecast By Market Taxonomy, 2025 to 2035
      • By Country
        • USA
        • Canada
      • By Service Type
      • By Delivery Model
      • By Data Modality
      • By End Use Industry
      • By Pricing Model
      • By Booking Channel
    • Market Attractiveness Analysis
      • By Country
      • By Service Type
      • By Delivery Model
      • By Data Modality
      • By End Use Industry
      • By Pricing Model
      • By Booking Channel
    • Key Takeaways
  13. Latin America Market Analysis 2020 to 2024 and Forecast 2025 to 2035, By Country
    • Historical Market Size Value (USD Million) & Volume (Units) Trend Analysis By Market Taxonomy, 2020 to 2024
    • Market Size Value (USD Million) & Volume (Units) Forecast By Market Taxonomy, 2025 to 2035
      • By Country
        • Brazil
        • Mexico
        • Colombia
        • Rest of Latin America
      • By Service Type
      • By Delivery Model
      • By Data Modality
      • By End Use Industry
      • By Pricing Model
      • By Booking Channel
    • Market Attractiveness Analysis
      • By Country
      • By Service Type
      • By Delivery Model
      • By Data Modality
      • By End Use Industry
      • By Pricing Model
      • By Booking Channel
    • Key Takeaways
  14. Europe Market Analysis 2020 to 2024 and Forecast 2025 to 2035, By Country
    • Historical Market Size Value (USD Million) & Volume (Units) Trend Analysis By Market Taxonomy, 2020 to 2024
    • Market Size Value (USD Million) & Volume (Units) Forecast By Market Taxonomy, 2025 to 2035
      • By Country
        • Germany
        • UK
        • France
        • Italy
        • Spain
        • Belgium
        • Netherlands
        • Nordic
        • Switzerland
        • Russia
        • Poland
        • Rest of Europe
      • By Service Type
      • By Delivery Model
      • By Data Modality
      • By End Use Industry
      • By Pricing Model
      • By Booking Channel
    • Market Attractiveness Analysis
      • By Country
      • By Service Type
      • By Delivery Model
      • By Data Modality
      • By End Use Industry
      • By Pricing Model
      • By Booking Channel
    • Key Takeaways
  15. East Asia Market Analysis 2020 to 2024 and Forecast 2025 to 2035, By Country
    • Historical Market Size Value (USD Million) & Volume (Units) Trend Analysis By Market Taxonomy, 2020 to 2024
    • Market Size Value (USD Million) & Volume (Units) Forecast By Market Taxonomy, 2025 to 2035
      • By Country
        • China
        • Japan
        • South Korea
      • By Service Type
      • By Delivery Model
      • By Data Modality
      • By End Use Industry
      • By Pricing Model
      • By Booking Channel
    • Market Attractiveness Analysis
      • By Country
      • By Service Type
      • By Delivery Model
      • By Data Modality
      • By End Use Industry
      • By Pricing Model
      • By Booking Channel
    • Key Takeaways
  16. South Asia & Pacific Market Analysis 2020 to 2024 and Forecast 2025 to 2035, By Country
    • Historical Market Size Value (USD Million) & Volume (Units) Trend Analysis By Market Taxonomy, 2020 to 2024
    • Market Size Value (USD Million) & Volume (Units) Forecast By Market Taxonomy, 2025 to 2035
      • By Country
        • India
        • Thailand
        • Malaysia
        • Indonesia
        • Singapore
        • Vietnam
        • Australia
        • New Zealand
        • Rest of South Asia
      • By Service Type
      • By Delivery Model
      • By Data Modality
      • By End Use Industry
      • By Pricing Model
      • By Booking Channel
    • Market Attractiveness Analysis
      • By Country
      • By Service Type
      • By Delivery Model
      • By Data Modality
      • By End Use Industry
      • By Pricing Model
      • By Booking Channel
    • Key Takeaways
  17. Middle East and Africa Market Analysis 2020 to 2024 and Forecast 2025 to 2035, By Country
    • Historical Market Size Value (USD Million) & Volume (Units) Trend Analysis By Market Taxonomy, 2020 to 2024
    • Market Size Value (USD Million) & Volume (Units) Forecast By Market Taxonomy, 2025 to 2035
      • By Country
        • Turkey
        • UAE
        • Saudi Arabia
        • Israel
        • Other GCC Countries
        • North Africa
        • South Africa
      • By Service Type
      • By Delivery Model
      • By Data Modality
      • By End Use Industry
      • By Pricing Model
      • By Booking Channel
    • Market Attractiveness Analysis
      • By Country
      • By Service Type
      • By Delivery Model
      • By Data Modality
      • By End Use Industry
      • By Pricing Model
      • By Booking Channel
    • Key Takeaways
  18. Key Countries Market Analysis
    • USA
      • Pricing Analysis
      • Market Share Analysis, 2024
        • By Service Type
        • By Delivery Model
        • By Data Modality
        • By End Use Industry
        • By Pricing Model
        • By Booking Channel
    • Canada
      • Pricing Analysis
      • Market Share Analysis, 2024
        • By Service Type
        • By Delivery Model
        • By Data Modality
        • By End Use Industry
        • By Pricing Model
        • By Booking Channel
    • Brazil
      • Pricing Analysis
      • Market Share Analysis, 2024
        • By Service Type
        • By Delivery Model
        • By Data Modality
        • By End Use Industry
        • By Pricing Model
        • By Booking Channel
    • Mexico
      • Pricing Analysis
      • Market Share Analysis, 2024
        • By Service Type
        • By Delivery Model
        • By Data Modality
        • By End Use Industry
        • By Pricing Model
        • By Booking Channel
    • Colombia
      • Pricing Analysis
      • Market Share Analysis, 2024
        • By Service Type
        • By Delivery Model
        • By Data Modality
        • By End Use Industry
        • By Pricing Model
        • By Booking Channel
    • Germany
      • Pricing Analysis
      • Market Share Analysis, 2024
        • By Service Type
        • By Delivery Model
        • By Data Modality
        • By End Use Industry
        • By Pricing Model
        • By Booking Channel
    • UK
      • Pricing Analysis
      • Market Share Analysis, 2024
        • By Service Type
        • By Delivery Model
        • By Data Modality
        • By End Use Industry
        • By Pricing Model
        • By Booking Channel
    • France
      • Pricing Analysis
      • Market Share Analysis, 2024
        • By Service Type
        • By Delivery Model
        • By Data Modality
        • By End Use Industry
        • By Pricing Model
        • By Booking Channel
    • Italy
      • Pricing Analysis
      • Market Share Analysis, 2024
        • By Service Type
        • By Delivery Model
        • By Data Modality
        • By End Use Industry
        • By Pricing Model
        • By Booking Channel
    • Spain
      • Pricing Analysis
      • Market Share Analysis, 2024
        • By Service Type
        • By Delivery Model
        • By Data Modality
        • By End Use Industry
        • By Pricing Model
        • By Booking Channel
    • Belgium
      • Pricing Analysis
      • Market Share Analysis, 2024
        • By Service Type
        • By Delivery Model
        • By Data Modality
        • By End Use Industry
        • By Pricing Model
        • By Booking Channel
    • Netherlands
      • Pricing Analysis
      • Market Share Analysis, 2024
        • By Service Type
        • By Delivery Model
        • By Data Modality
        • By End Use Industry
        • By Pricing Model
        • By Booking Channel
    • Nordic
      • Pricing Analysis
      • Market Share Analysis, 2024
        • By Service Type
        • By Delivery Model
        • By Data Modality
        • By End Use Industry
        • By Pricing Model
        • By Booking Channel
    • Switzerland
      • Pricing Analysis
      • Market Share Analysis, 2024
        • By Service Type
        • By Delivery Model
        • By Data Modality
        • By End Use Industry
        • By Pricing Model
        • By Booking Channel
    • Russia
      • Pricing Analysis
      • Market Share Analysis, 2024
        • By Service Type
        • By Delivery Model
        • By Data Modality
        • By End Use Industry
        • By Pricing Model
        • By Booking Channel
    • Poland
      • Pricing Analysis
      • Market Share Analysis, 2024
        • By Service Type
        • By Delivery Model
        • By Data Modality
        • By End Use Industry
        • By Pricing Model
        • By Booking Channel
    • China
      • Pricing Analysis
      • Market Share Analysis, 2024
        • By Service Type
        • By Delivery Model
        • By Data Modality
        • By End Use Industry
        • By Pricing Model
        • By Booking Channel
    • Japan
      • Pricing Analysis
      • Market Share Analysis, 2024
        • By Service Type
        • By Delivery Model
        • By Data Modality
        • By End Use Industry
        • By Pricing Model
        • By Booking Channel
    • South Korea
      • Pricing Analysis
      • Market Share Analysis, 2024
        • By Service Type
        • By Delivery Model
        • By Data Modality
        • By End Use Industry
        • By Pricing Model
        • By Booking Channel
    • India
      • Pricing Analysis
      • Market Share Analysis, 2024
        • By Service Type
        • By Delivery Model
        • By Data Modality
        • By End Use Industry
        • By Pricing Model
        • By Booking Channel
    • Thailand
      • Pricing Analysis
      • Market Share Analysis, 2024
        • By Service Type
        • By Delivery Model
        • By Data Modality
        • By End Use Industry
        • By Pricing Model
        • By Booking Channel
    • Indonesia
      • Pricing Analysis
      • Market Share Analysis, 2024
        • By Service Type
        • By Delivery Model
        • By Data Modality
        • By End Use Industry
        • By Pricing Model
        • By Booking Channel
    • Australia
      • Pricing Analysis
      • Market Share Analysis, 2024
        • By Service Type
        • By Delivery Model
        • By Data Modality
        • By End Use Industry
        • By Pricing Model
        • By Booking Channel
    • New Zealand
      • Pricing Analysis
      • Market Share Analysis, 2024
        • By Service Type
        • By Delivery Model
        • By Data Modality
        • By End Use Industry
        • By Pricing Model
        • By Booking Channel
    • Turkey
      • Pricing Analysis
      • Market Share Analysis, 2024
        • By Service Type
        • By Delivery Model
        • By Data Modality
        • By End Use Industry
        • By Pricing Model
        • By Booking Channel
    • UAE
      • Pricing Analysis
      • Market Share Analysis, 2024
        • By Service Type
        • By Delivery Model
        • By Data Modality
        • By End Use Industry
        • By Pricing Model
        • By Booking Channel
    • Saudi Arabia
      • Pricing Analysis
      • Market Share Analysis, 2024
        • By Service Type
        • By Delivery Model
        • By Data Modality
        • By End Use Industry
        • By Pricing Model
        • By Booking Channel
    • Israel
      • Pricing Analysis
      • Market Share Analysis, 2024
        • By Service Type
        • By Delivery Model
        • By Data Modality
        • By End Use Industry
        • By Pricing Model
        • By Booking Channel
    • North Africa
      • Pricing Analysis
      • Market Share Analysis, 2024
        • By Service Type
        • By Delivery Model
        • By Data Modality
        • By End Use Industry
        • By Pricing Model
        • By Booking Channel
    • South Africa
      • Pricing Analysis
      • Market Share Analysis, 2024
        • By Service Type
        • By Delivery Model
        • By Data Modality
        • By End Use Industry
        • By Pricing Model
        • By Booking Channel
  19. Market Structure Analysis
    • Competition Dashboard
    • Competition Benchmarking
    • Market Share Analysis of Top Players
      • By Regional
      • By Service Type
      • By Delivery Model
      • By Data Modality
      • By End Use Industry
      • By Pricing Model
      • By Booking Channel
  20. Competition Analysis
    • Competition Deep Dive
      • Qualtrics
        • Overview
        • Product Portfolio
        • Profitability by Market Segments (Product/Age /Sales Channel/Region)
        • Sales Footprint
        • Strategy Overview
          • Marketing Strategy
          • Product Strategy
          • Channel Strategy
      • Kantar
        • Overview
        • Product Portfolio
        • Profitability by Market Segments (Product/Age /Sales Channel/Region)
        • Sales Footprint
        • Strategy Overview
          • Marketing Strategy
          • Product Strategy
          • Channel Strategy
      • Ipsos
        • Overview
        • Product Portfolio
        • Profitability by Market Segments (Product/Age /Sales Channel/Region)
        • Sales Footprint
        • Strategy Overview
          • Marketing Strategy
          • Product Strategy
          • Channel Strategy
      • NIQ (NielsenIQ)
        • Overview
        • Product Portfolio
        • Profitability by Market Segments (Product/Age /Sales Channel/Region)
        • Sales Footprint
        • Strategy Overview
          • Marketing Strategy
          • Product Strategy
          • Channel Strategy
      • GfK
        • Overview
        • Product Portfolio
        • Profitability by Market Segments (Product/Age /Sales Channel/Region)
        • Sales Footprint
        • Strategy Overview
          • Marketing Strategy
          • Product Strategy
          • Channel Strategy
      • YouGov
        • Overview
        • Product Portfolio
        • Profitability by Market Segments (Product/Age /Sales Channel/Region)
        • Sales Footprint
        • Strategy Overview
          • Marketing Strategy
          • Product Strategy
          • Channel Strategy
      • Dynata
        • Overview
        • Product Portfolio
        • Profitability by Market Segments (Product/Age /Sales Channel/Region)
        • Sales Footprint
        • Strategy Overview
          • Marketing Strategy
          • Product Strategy
          • Channel Strategy
      • Toluna
        • Overview
        • Product Portfolio
        • Profitability by Market Segments (Product/Age /Sales Channel/Region)
        • Sales Footprint
        • Strategy Overview
          • Marketing Strategy
          • Product Strategy
          • Channel Strategy
      • Zappi
        • Overview
        • Product Portfolio
        • Profitability by Market Segments (Product/Age /Sales Channel/Region)
        • Sales Footprint
        • Strategy Overview
          • Marketing Strategy
          • Product Strategy
          • Channel Strategy
      • Quantilope
        • Overview
        • Product Portfolio
        • Profitability by Market Segments (Product/Age /Sales Channel/Region)
        • Sales Footprint
        • Strategy Overview
          • Marketing Strategy
          • Product Strategy
          • Channel Strategy
  21. Assumptions & Acronyms Used
  22. Research Methodology

List of Tables

  • Table 1: Global Market Value (USD Million) Forecast by Region, 2020-2035
  • Table 2: Global Market Volume (Units) Forecast by Region, 2020-2035
  • Table 3: Global Market Value (USD Million) Forecast by Service Type, 2020-2035
  • Table 4: Global Market Volume (Units) Forecast by Service Type, 2020-2035
  • Table 5: Global Market Value (USD Million) Forecast by Delivery Model, 2020-2035
  • Table 6: Global Market Volume (Units) Forecast by Delivery Model, 2020-2035
  • Table 7: Global Market Value (USD Million) Forecast by Data Modality, 2020-2035
  • Table 8: Global Market Volume (Units) Forecast by Data Modality, 2020-2035
  • Table 9: Global Market Value (USD Million) Forecast by End Use Industry, 2020-2035
  • Table 10: Global Market Volume (Units) Forecast by End Use Industry, 2020-2035
  • Table 11: Global Market Value (USD Million) Forecast by Pricing Model, 2020-2035
  • Table 12: Global Market Volume (Units) Forecast by Pricing Model, 2020-2035
  • Table 13: Global Market Value (USD Million) Forecast by Booking Channel, 2020-2035
  • Table 14: Global Market Volume (Units) Forecast by Booking Channel, 2020-2035
  • Table 15: North America Market Value (USD Million) Forecast by Country, 2020-2035
  • Table 16: North America Market Volume (Units) Forecast by Country, 2020-2035
  • Table 17: North America Market Value (USD Million) Forecast by Service Type, 2020-2035
  • Table 18: North America Market Volume (Units) Forecast by Service Type, 2020-2035
  • Table 19: North America Market Value (USD Million) Forecast by Delivery Model, 2020-2035
  • Table 20: North America Market Volume (Units) Forecast by Delivery Model, 2020-2035
  • Table 21: North America Market Value (USD Million) Forecast by Data Modality, 2020-2035
  • Table 22: North America Market Volume (Units) Forecast by Data Modality, 2020-2035
  • Table 23: North America Market Value (USD Million) Forecast by End Use Industry, 2020-2035
  • Table 24: North America Market Volume (Units) Forecast by End Use Industry, 2020-2035
  • Table 25: North America Market Value (USD Million) Forecast by Pricing Model, 2020-2035
  • Table 26: North America Market Volume (Units) Forecast by Pricing Model, 2020-2035
  • Table 27: North America Market Value (USD Million) Forecast by Booking Channel, 2020-2035
  • Table 28: North America Market Volume (Units) Forecast by Booking Channel, 2020-2035
  • Table 29: Latin America Market Value (USD Million) Forecast by Country, 2020-2035
  • Table 30: Latin America Market Volume (Units) Forecast by Country, 2020-2035
  • Table 31: Latin America Market Value (USD Million) Forecast by Service Type, 2020-2035
  • Table 32: Latin America Market Volume (Units) Forecast by Service Type, 2020-2035
  • Table 33: Latin America Market Value (USD Million) Forecast by Delivery Model, 2020-2035
  • Table 34: Latin America Market Volume (Units) Forecast by Delivery Model, 2020-2035
  • Table 35: Latin America Market Value (USD Million) Forecast by Data Modality, 2020-2035
  • Table 36: Latin America Market Volume (Units) Forecast by Data Modality, 2020-2035
  • Table 37: Latin America Market Value (USD Million) Forecast by End Use Industry, 2020-2035
  • Table 38: Latin America Market Volume (Units) Forecast by End Use Industry, 2020-2035
  • Table 39: Latin America Market Value (USD Million) Forecast by Pricing Model, 2020-2035
  • Table 40: Latin America Market Volume (Units) Forecast by Pricing Model, 2020-2035
  • Table 41: Latin America Market Value (USD Million) Forecast by Booking Channel, 2020-2035
  • Table 42: Latin America Market Volume (Units) Forecast by Booking Channel, 2020-2035
  • Table 43: Europe Market Value (USD Million) Forecast by Country, 2020-2035
  • Table 44: Europe Market Volume (Units) Forecast by Country, 2020-2035
  • Table 45: Europe Market Value (USD Million) Forecast by Service Type, 2020-2035
  • Table 46: Europe Market Volume (Units) Forecast by Service Type, 2020-2035
  • Table 47: Europe Market Value (USD Million) Forecast by Delivery Model, 2020-2035
  • Table 48: Europe Market Volume (Units) Forecast by Delivery Model, 2020-2035
  • Table 49: Europe Market Value (USD Million) Forecast by Data Modality, 2020-2035
  • Table 50: Europe Market Volume (Units) Forecast by Data Modality, 2020-2035
  • Table 51: Europe Market Value (USD Million) Forecast by End Use Industry, 2020-2035
  • Table 52: Europe Market Volume (Units) Forecast by End Use Industry, 2020-2035
  • Table 53: Europe Market Value (USD Million) Forecast by Pricing Model, 2020-2035
  • Table 54: Europe Market Volume (Units) Forecast by Pricing Model, 2020-2035
  • Table 55: Europe Market Value (USD Million) Forecast by Booking Channel, 2020-2035
  • Table 56: Europe Market Volume (Units) Forecast by Booking Channel, 2020-2035
  • Table 57: East Asia Market Value (USD Million) Forecast by Country, 2020-2035
  • Table 58: East Asia Market Volume (Units) Forecast by Country, 2020-2035
  • Table 59: East Asia Market Value (USD Million) Forecast by Service Type, 2020-2035
  • Table 60: East Asia Market Volume (Units) Forecast by Service Type, 2020-2035
  • Table 61: East Asia Market Value (USD Million) Forecast by Delivery Model, 2020-2035
  • Table 62: East Asia Market Volume (Units) Forecast by Delivery Model, 2020-2035
  • Table 63: East Asia Market Value (USD Million) Forecast by Data Modality, 2020-2035
  • Table 64: East Asia Market Volume (Units) Forecast by Data Modality, 2020-2035
  • Table 65: East Asia Market Value (USD Million) Forecast by End Use Industry, 2020-2035
  • Table 66: East Asia Market Volume (Units) Forecast by End Use Industry, 2020-2035
  • Table 67: East Asia Market Value (USD Million) Forecast by Pricing Model, 2020-2035
  • Table 68: East Asia Market Volume (Units) Forecast by Pricing Model, 2020-2035
  • Table 69: East Asia Market Value (USD Million) Forecast by Booking Channel, 2020-2035
  • Table 70: East Asia Market Volume (Units) Forecast by Booking Channel, 2020-2035
  • Table 71: South Asia & Pacific Market Value (USD Million) Forecast by Country, 2020-2035
  • Table 72: South Asia & Pacific Market Volume (Units) Forecast by Country, 2020-2035
  • Table 73: South Asia & Pacific Market Value (USD Million) Forecast by Service Type, 2020-2035
  • Table 74: South Asia & Pacific Market Volume (Units) Forecast by Service Type, 2020-2035
  • Table 75: South Asia & Pacific Market Value (USD Million) Forecast by Delivery Model, 2020-2035
  • Table 76: South Asia & Pacific Market Volume (Units) Forecast by Delivery Model, 2020-2035
  • Table 77: South Asia & Pacific Market Value (USD Million) Forecast by Data Modality, 2020-2035
  • Table 78: South Asia & Pacific Market Volume (Units) Forecast by Data Modality, 2020-2035
  • Table 79: South Asia & Pacific Market Value (USD Million) Forecast by End Use Industry, 2020-2035
  • Table 80: South Asia & Pacific Market Volume (Units) Forecast by End Use Industry, 2020-2035
  • Table 81: South Asia & Pacific Market Value (USD Million) Forecast by Pricing Model, 2020-2035
  • Table 82: South Asia & Pacific Market Volume (Units) Forecast by Pricing Model, 2020-2035
  • Table 83: South Asia & Pacific Market Value (USD Million) Forecast by Booking Channel, 2020-2035
  • Table 84: South Asia & Pacific Market Volume (Units) Forecast by Booking Channel, 2020-2035
  • Table 85: Middle East and Africa Market Value (USD Million) Forecast by Country, 2020-2035
  • Table 86: Middle East and Africa Market Volume (Units) Forecast by Country, 2020-2035
  • Table 87: Middle East and Africa Market Value (USD Million) Forecast by Service Type, 2020-2035
  • Table 88: Middle East and Africa Market Volume (Units) Forecast by Service Type, 2020-2035
  • Table 89: Middle East and Africa Market Value (USD Million) Forecast by Delivery Model, 2020-2035
  • Table 90: Middle East and Africa Market Volume (Units) Forecast by Delivery Model, 2020-2035
  • Table 91: Middle East and Africa Market Value (USD Million) Forecast by Data Modality, 2020-2035
  • Table 92: Middle East and Africa Market Volume (Units) Forecast by Data Modality, 2020-2035
  • Table 93: Middle East and Africa Market Value (USD Million) Forecast by End Use Industry, 2020-2035
  • Table 94: Middle East and Africa Market Volume (Units) Forecast by End Use Industry, 2020-2035
  • Table 95: Middle East and Africa Market Value (USD Million) Forecast by Pricing Model, 2020-2035
  • Table 96: Middle East and Africa Market Volume (Units) Forecast by Pricing Model, 2020-2035
  • Table 97: Middle East and Africa Market Value (USD Million) Forecast by Booking Channel, 2020-2035
  • Table 98: Middle East and Africa Market Volume (Units) Forecast by Booking Channel, 2020-2035

List of Figures

  • Figure 1: Global Market Value (USD Million) by Service Type, 2025-2035
  • Figure 2: Global Market Value (USD Million) by Delivery Model, 2025-2035
  • Figure 3: Global Market Value (USD Million) by Data Modality, 2025-2035
  • Figure 4: Global Market Value (USD Million) by End Use Industry, 2025-2035
  • Figure 5: Global Market Value (USD Million) by Pricing Model, 2025-2035
  • Figure 6: Global Market Value (USD Million) by Booking Channel, 2025-2035
  • Figure 7: Global Market Value (USD Million) by Region, 2025-2035
  • Figure 8: Global Market Value (USD Million) Analysis by Region, 2020-2035
  • Figure 9: Global Market Volume (Units) Analysis by Region, 2020-2035
  • Figure 10: Global Market Value Share (%) and BPS Analysis by Region, 2025-2035
  • Figure 11: Global Market Y-o-Y Growth (%) Projections by Region, 2025-2035
  • Figure 12: Global Market Value (USD Million) Analysis by Service Type, 2020-2035
  • Figure 13: Global Market Volume (Units) Analysis by Service Type, 2020-2035
  • Figure 14: Global Market Value Share (%) and BPS Analysis by Service Type, 2025-2035
  • Figure 15: Global Market Y-o-Y Growth (%) Projections by Service Type, 2025-2035
  • Figure 16: Global Market Value (USD Million) Analysis by Delivery Model, 2020-2035
  • Figure 17: Global Market Volume (Units) Analysis by Delivery Model, 2020-2035
  • Figure 18: Global Market Value Share (%) and BPS Analysis by Delivery Model, 2025-2035
  • Figure 19: Global Market Y-o-Y Growth (%) Projections by Delivery Model, 2025-2035
  • Figure 20: Global Market Value (USD Million) Analysis by Data Modality, 2020-2035
  • Figure 21: Global Market Volume (Units) Analysis by Data Modality, 2020-2035
  • Figure 22: Global Market Value Share (%) and BPS Analysis by Data Modality, 2025-2035
  • Figure 23: Global Market Y-o-Y Growth (%) Projections by Data Modality, 2025-2035
  • Figure 24: Global Market Value (USD Million) Analysis by End Use Industry, 2020-2035
  • Figure 25: Global Market Volume (Units) Analysis by End Use Industry, 2020-2035
  • Figure 26: Global Market Value Share (%) and BPS Analysis by End Use Industry, 2025-2035
  • Figure 27: Global Market Y-o-Y Growth (%) Projections by End Use Industry, 2025-2035
  • Figure 28: Global Market Value (USD Million) Analysis by Pricing Model, 2020-2035
  • Figure 29: Global Market Volume (Units) Analysis by Pricing Model, 2020-2035
  • Figure 30: Global Market Value Share (%) and BPS Analysis by Pricing Model, 2025-2035
  • Figure 31: Global Market Y-o-Y Growth (%) Projections by Pricing Model, 2025-2035
  • Figure 32: Global Market Value (USD Million) Analysis by Booking Channel, 2020-2035
  • Figure 33: Global Market Volume (Units) Analysis by Booking Channel, 2020-2035
  • Figure 34: Global Market Value Share (%) and BPS Analysis by Booking Channel, 2025-2035
  • Figure 35: Global Market Y-o-Y Growth (%) Projections by Booking Channel, 2025-2035
  • Figure 36: Global Market Attractiveness by Service Type, 2025-2035
  • Figure 37: Global Market Attractiveness by Delivery Model, 2025-2035
  • Figure 38: Global Market Attractiveness by Data Modality, 2025-2035
  • Figure 39: Global Market Attractiveness by End Use Industry, 2025-2035
  • Figure 40: Global Market Attractiveness by Pricing Model, 2025-2035
  • Figure 41: Global Market Attractiveness by Booking Channel, 2025-2035
  • Figure 42: Global Market Attractiveness by Region, 2025-2035
  • Figure 43: North America Market Value (USD Million) by Service Type, 2025-2035
  • Figure 44: North America Market Value (USD Million) by Delivery Model, 2025-2035
  • Figure 45: North America Market Value (USD Million) by Data Modality, 2025-2035
  • Figure 46: North America Market Value (USD Million) by End Use Industry, 2025-2035
  • Figure 47: North America Market Value (USD Million) by Pricing Model, 2025-2035
  • Figure 48: North America Market Value (USD Million) by Booking Channel, 2025-2035
  • Figure 49: North America Market Value (USD Million) by Country, 2025-2035
  • Figure 50: North America Market Value (USD Million) Analysis by Country, 2020-2035
  • Figure 51: North America Market Volume (Units) Analysis by Country, 2020-2035
  • Figure 52: North America Market Value Share (%) and BPS Analysis by Country, 2025-2035
  • Figure 53: North America Market Y-o-Y Growth (%) Projections by Country, 2025-2035
  • Figure 54: North America Market Value (USD Million) Analysis by Service Type, 2020-2035
  • Figure 55: North America Market Volume (Units) Analysis by Service Type, 2020-2035
  • Figure 56: North America Market Value Share (%) and BPS Analysis by Service Type, 2025-2035
  • Figure 57: North America Market Y-o-Y Growth (%) Projections by Service Type, 2025-2035
  • Figure 58: North America Market Value (USD Million) Analysis by Delivery Model, 2020-2035
  • Figure 59: North America Market Volume (Units) Analysis by Delivery Model, 2020-2035
  • Figure 60: North America Market Value Share (%) and BPS Analysis by Delivery Model, 2025-2035
  • Figure 61: North America Market Y-o-Y Growth (%) Projections by Delivery Model, 2025-2035
  • Figure 62: North America Market Value (USD Million) Analysis by Data Modality, 2020-2035
  • Figure 63: North America Market Volume (Units) Analysis by Data Modality, 2020-2035
  • Figure 64: North America Market Value Share (%) and BPS Analysis by Data Modality, 2025-2035
  • Figure 65: North America Market Y-o-Y Growth (%) Projections by Data Modality, 2025-2035
  • Figure 66: North America Market Value (USD Million) Analysis by End Use Industry, 2020-2035
  • Figure 67: North America Market Volume (Units) Analysis by End Use Industry, 2020-2035
  • Figure 68: North America Market Value Share (%) and BPS Analysis by End Use Industry, 2025-2035
  • Figure 69: North America Market Y-o-Y Growth (%) Projections by End Use Industry, 2025-2035
  • Figure 70: North America Market Value (USD Million) Analysis by Pricing Model, 2020-2035
  • Figure 71: North America Market Volume (Units) Analysis by Pricing Model, 2020-2035
  • Figure 72: North America Market Value Share (%) and BPS Analysis by Pricing Model, 2025-2035
  • Figure 73: North America Market Y-o-Y Growth (%) Projections by Pricing Model, 2025-2035
  • Figure 74: North America Market Value (USD Million) Analysis by Booking Channel, 2020-2035
  • Figure 75: North America Market Volume (Units) Analysis by Booking Channel, 2020-2035
  • Figure 76: North America Market Value Share (%) and BPS Analysis by Booking Channel, 2025-2035
  • Figure 77: North America Market Y-o-Y Growth (%) Projections by Booking Channel, 2025-2035
  • Figure 78: North America Market Attractiveness by Service Type, 2025-2035
  • Figure 79: North America Market Attractiveness by Delivery Model, 2025-2035
  • Figure 80: North America Market Attractiveness by Data Modality, 2025-2035
  • Figure 81: North America Market Attractiveness by End Use Industry, 2025-2035
  • Figure 82: North America Market Attractiveness by Pricing Model, 2025-2035
  • Figure 83: North America Market Attractiveness by Booking Channel, 2025-2035
  • Figure 84: North America Market Attractiveness by Country, 2025-2035
  • Figure 85: Latin America Market Value (USD Million) by Service Type, 2025-2035
  • Figure 86: Latin America Market Value (USD Million) by Delivery Model, 2025-2035
  • Figure 87: Latin America Market Value (USD Million) by Data Modality, 2025-2035
  • Figure 88: Latin America Market Value (USD Million) by End Use Industry, 2025-2035
  • Figure 89: Latin America Market Value (USD Million) by Pricing Model, 2025-2035
  • Figure 90: Latin America Market Value (USD Million) by Booking Channel, 2025-2035
  • Figure 91: Latin America Market Value (USD Million) by Country, 2025-2035
  • Figure 92: Latin America Market Value (USD Million) Analysis by Country, 2020-2035
  • Figure 93: Latin America Market Volume (Units) Analysis by Country, 2020-2035
  • Figure 94: Latin America Market Value Share (%) and BPS Analysis by Country, 2025-2035
  • Figure 95: Latin America Market Y-o-Y Growth (%) Projections by Country, 2025-2035
  • Figure 96: Latin America Market Value (USD Million) Analysis by Service Type, 2020-2035
  • Figure 97: Latin America Market Volume (Units) Analysis by Service Type, 2020-2035
  • Figure 98: Latin America Market Value Share (%) and BPS Analysis by Service Type, 2025-2035
  • Figure 99: Latin America Market Y-o-Y Growth (%) Projections by Service Type, 2025-2035
  • Figure 100: Latin America Market Value (USD Million) Analysis by Delivery Model, 2020-2035
  • Figure 101: Latin America Market Volume (Units) Analysis by Delivery Model, 2020-2035
  • Figure 102: Latin America Market Value Share (%) and BPS Analysis by Delivery Model, 2025-2035
  • Figure 103: Latin America Market Y-o-Y Growth (%) Projections by Delivery Model, 2025-2035
  • Figure 104: Latin America Market Value (USD Million) Analysis by Data Modality, 2020-2035
  • Figure 105: Latin America Market Volume (Units) Analysis by Data Modality, 2020-2035
  • Figure 106: Latin America Market Value Share (%) and BPS Analysis by Data Modality, 2025-2035
  • Figure 107: Latin America Market Y-o-Y Growth (%) Projections by Data Modality, 2025-2035
  • Figure 108: Latin America Market Value (USD Million) Analysis by End Use Industry, 2020-2035
  • Figure 109: Latin America Market Volume (Units) Analysis by End Use Industry, 2020-2035
  • Figure 110: Latin America Market Value Share (%) and BPS Analysis by End Use Industry, 2025-2035
  • Figure 111: Latin America Market Y-o-Y Growth (%) Projections by End Use Industry, 2025-2035
  • Figure 112: Latin America Market Value (USD Million) Analysis by Pricing Model, 2020-2035
  • Figure 113: Latin America Market Volume (Units) Analysis by Pricing Model, 2020-2035
  • Figure 114: Latin America Market Value Share (%) and BPS Analysis by Pricing Model, 2025-2035
  • Figure 115: Latin America Market Y-o-Y Growth (%) Projections by Pricing Model, 2025-2035
  • Figure 116: Latin America Market Value (USD Million) Analysis by Booking Channel, 2020-2035
  • Figure 117: Latin America Market Volume (Units) Analysis by Booking Channel, 2020-2035
  • Figure 118: Latin America Market Value Share (%) and BPS Analysis by Booking Channel, 2025-2035
  • Figure 119: Latin America Market Y-o-Y Growth (%) Projections by Booking Channel, 2025-2035
  • Figure 120: Latin America Market Attractiveness by Service Type, 2025-2035
  • Figure 121: Latin America Market Attractiveness by Delivery Model, 2025-2035
  • Figure 122: Latin America Market Attractiveness by Data Modality, 2025-2035
  • Figure 123: Latin America Market Attractiveness by End Use Industry, 2025-2035
  • Figure 124: Latin America Market Attractiveness by Pricing Model, 2025-2035
  • Figure 125: Latin America Market Attractiveness by Booking Channel, 2025-2035
  • Figure 126: Latin America Market Attractiveness by Country, 2025-2035
  • Figure 127: Europe Market Value (USD Million) by Service Type, 2025-2035
  • Figure 128: Europe Market Value (USD Million) by Delivery Model, 2025-2035
  • Figure 129: Europe Market Value (USD Million) by Data Modality, 2025-2035
  • Figure 130: Europe Market Value (USD Million) by End Use Industry, 2025-2035
  • Figure 131: Europe Market Value (USD Million) by Pricing Model, 2025-2035
  • Figure 132: Europe Market Value (USD Million) by Booking Channel, 2025-2035
  • Figure 133: Europe Market Value (USD Million) by Country, 2025-2035
  • Figure 134: Europe Market Value (USD Million) Analysis by Country, 2020-2035
  • Figure 135: Europe Market Volume (Units) Analysis by Country, 2020-2035
  • Figure 136: Europe Market Value Share (%) and BPS Analysis by Country, 2025-2035
  • Figure 137: Europe Market Y-o-Y Growth (%) Projections by Country, 2025-2035
  • Figure 138: Europe Market Value (USD Million) Analysis by Service Type, 2020-2035
  • Figure 139: Europe Market Volume (Units) Analysis by Service Type, 2020-2035
  • Figure 140: Europe Market Value Share (%) and BPS Analysis by Service Type, 2025-2035
  • Figure 141: Europe Market Y-o-Y Growth (%) Projections by Service Type, 2025-2035
  • Figure 142: Europe Market Value (USD Million) Analysis by Delivery Model, 2020-2035
  • Figure 143: Europe Market Volume (Units) Analysis by Delivery Model, 2020-2035
  • Figure 144: Europe Market Value Share (%) and BPS Analysis by Delivery Model, 2025-2035
  • Figure 145: Europe Market Y-o-Y Growth (%) Projections by Delivery Model, 2025-2035
  • Figure 146: Europe Market Value (USD Million) Analysis by Data Modality, 2020-2035
  • Figure 147: Europe Market Volume (Units) Analysis by Data Modality, 2020-2035
  • Figure 148: Europe Market Value Share (%) and BPS Analysis by Data Modality, 2025-2035
  • Figure 149: Europe Market Y-o-Y Growth (%) Projections by Data Modality, 2025-2035
  • Figure 150: Europe Market Value (USD Million) Analysis by End Use Industry, 2020-2035
  • Figure 151: Europe Market Volume (Units) Analysis by End Use Industry, 2020-2035
  • Figure 152: Europe Market Value Share (%) and BPS Analysis by End Use Industry, 2025-2035
  • Figure 153: Europe Market Y-o-Y Growth (%) Projections by End Use Industry, 2025-2035
  • Figure 154: Europe Market Value (USD Million) Analysis by Pricing Model, 2020-2035
  • Figure 155: Europe Market Volume (Units) Analysis by Pricing Model, 2020-2035
  • Figure 156: Europe Market Value Share (%) and BPS Analysis by Pricing Model, 2025-2035
  • Figure 157: Europe Market Y-o-Y Growth (%) Projections by Pricing Model, 2025-2035
  • Figure 158: Europe Market Value (USD Million) Analysis by Booking Channel, 2020-2035
  • Figure 159: Europe Market Volume (Units) Analysis by Booking Channel, 2020-2035
  • Figure 160: Europe Market Value Share (%) and BPS Analysis by Booking Channel, 2025-2035
  • Figure 161: Europe Market Y-o-Y Growth (%) Projections by Booking Channel, 2025-2035
  • Figure 162: Europe Market Attractiveness by Service Type, 2025-2035
  • Figure 163: Europe Market Attractiveness by Delivery Model, 2025-2035
  • Figure 164: Europe Market Attractiveness by Data Modality, 2025-2035
  • Figure 165: Europe Market Attractiveness by End Use Industry, 2025-2035
  • Figure 166: Europe Market Attractiveness by Pricing Model, 2025-2035
  • Figure 167: Europe Market Attractiveness by Booking Channel, 2025-2035
  • Figure 168: Europe Market Attractiveness by Country, 2025-2035
  • Figure 169: East Asia Market Value (USD Million) by Service Type, 2025-2035
  • Figure 170: East Asia Market Value (USD Million) by Delivery Model, 2025-2035
  • Figure 171: East Asia Market Value (USD Million) by Data Modality, 2025-2035
  • Figure 172: East Asia Market Value (USD Million) by End Use Industry, 2025-2035
  • Figure 173: East Asia Market Value (USD Million) by Pricing Model, 2025-2035
  • Figure 174: East Asia Market Value (USD Million) by Booking Channel, 2025-2035
  • Figure 175: East Asia Market Value (USD Million) by Country, 2025-2035
  • Figure 176: East Asia Market Value (USD Million) Analysis by Country, 2020-2035
  • Figure 177: East Asia Market Volume (Units) Analysis by Country, 2020-2035
  • Figure 178: East Asia Market Value Share (%) and BPS Analysis by Country, 2025-2035
  • Figure 179: East Asia Market Y-o-Y Growth (%) Projections by Country, 2025-2035
  • Figure 180: East Asia Market Value (USD Million) Analysis by Service Type, 2020-2035
  • Figure 181: East Asia Market Volume (Units) Analysis by Service Type, 2020-2035
  • Figure 182: East Asia Market Value Share (%) and BPS Analysis by Service Type, 2025-2035
  • Figure 183: East Asia Market Y-o-Y Growth (%) Projections by Service Type, 2025-2035
  • Figure 184: East Asia Market Value (USD Million) Analysis by Delivery Model, 2020-2035
  • Figure 185: East Asia Market Volume (Units) Analysis by Delivery Model, 2020-2035
  • Figure 186: East Asia Market Value Share (%) and BPS Analysis by Delivery Model, 2025-2035
  • Figure 187: East Asia Market Y-o-Y Growth (%) Projections by Delivery Model, 2025-2035
  • Figure 188: East Asia Market Value (USD Million) Analysis by Data Modality, 2020-2035
  • Figure 189: East Asia Market Volume (Units) Analysis by Data Modality, 2020-2035
  • Figure 190: East Asia Market Value Share (%) and BPS Analysis by Data Modality, 2025-2035
  • Figure 191: East Asia Market Y-o-Y Growth (%) Projections by Data Modality, 2025-2035
  • Figure 192: East Asia Market Value (USD Million) Analysis by End Use Industry, 2020-2035
  • Figure 193: East Asia Market Volume (Units) Analysis by End Use Industry, 2020-2035
  • Figure 194: East Asia Market Value Share (%) and BPS Analysis by End Use Industry, 2025-2035
  • Figure 195: East Asia Market Y-o-Y Growth (%) Projections by End Use Industry, 2025-2035
  • Figure 196: East Asia Market Value (USD Million) Analysis by Pricing Model, 2020-2035
  • Figure 197: East Asia Market Volume (Units) Analysis by Pricing Model, 2020-2035
  • Figure 198: East Asia Market Value Share (%) and BPS Analysis by Pricing Model, 2025-2035
  • Figure 199: East Asia Market Y-o-Y Growth (%) Projections by Pricing Model, 2025-2035
  • Figure 200: East Asia Market Value (USD Million) Analysis by Booking Channel, 2020-2035
  • Figure 201: East Asia Market Volume (Units) Analysis by Booking Channel, 2020-2035
  • Figure 202: East Asia Market Value Share (%) and BPS Analysis by Booking Channel, 2025-2035
  • Figure 203: East Asia Market Y-o-Y Growth (%) Projections by Booking Channel, 2025-2035
  • Figure 204: East Asia Market Attractiveness by Service Type, 2025-2035
  • Figure 205: East Asia Market Attractiveness by Delivery Model, 2025-2035
  • Figure 206: East Asia Market Attractiveness by Data Modality, 2025-2035
  • Figure 207: East Asia Market Attractiveness by End Use Industry, 2025-2035
  • Figure 208: East Asia Market Attractiveness by Pricing Model, 2025-2035
  • Figure 209: East Asia Market Attractiveness by Booking Channel, 2025-2035
  • Figure 210: East Asia Market Attractiveness by Country, 2025-2035
  • Figure 211: South Asia & Pacific Market Value (USD Million) by Service Type, 2025-2035
  • Figure 212: South Asia & Pacific Market Value (USD Million) by Delivery Model, 2025-2035
  • Figure 213: South Asia & Pacific Market Value (USD Million) by Data Modality, 2025-2035
  • Figure 214: South Asia & Pacific Market Value (USD Million) by End Use Industry, 2025-2035
  • Figure 215: South Asia & Pacific Market Value (USD Million) by Pricing Model, 2025-2035
  • Figure 216: South Asia & Pacific Market Value (USD Million) by Booking Channel, 2025-2035
  • Figure 217: South Asia & Pacific Market Value (USD Million) by Country, 2025-2035
  • Figure 218: South Asia & Pacific Market Value (USD Million) Analysis by Country, 2020-2035
  • Figure 219: South Asia & Pacific Market Volume (Units) Analysis by Country, 2020-2035
  • Figure 220: South Asia & Pacific Market Value Share (%) and BPS Analysis by Country, 2025-2035
  • Figure 221: South Asia & Pacific Market Y-o-Y Growth (%) Projections by Country, 2025-2035
  • Figure 222: South Asia & Pacific Market Value (USD Million) Analysis by Service Type, 2020-2035
  • Figure 223: South Asia & Pacific Market Volume (Units) Analysis by Service Type, 2020-2035
  • Figure 224: South Asia & Pacific Market Value Share (%) and BPS Analysis by Service Type, 2025-2035
  • Figure 225: South Asia & Pacific Market Y-o-Y Growth (%) Projections by Service Type, 2025-2035
  • Figure 226: South Asia & Pacific Market Value (USD Million) Analysis by Delivery Model, 2020-2035
  • Figure 227: South Asia & Pacific Market Volume (Units) Analysis by Delivery Model, 2020-2035
  • Figure 228: South Asia & Pacific Market Value Share (%) and BPS Analysis by Delivery Model, 2025-2035
  • Figure 229: South Asia & Pacific Market Y-o-Y Growth (%) Projections by Delivery Model, 2025-2035
  • Figure 230: South Asia & Pacific Market Value (USD Million) Analysis by Data Modality, 2020-2035
  • Figure 231: South Asia & Pacific Market Volume (Units) Analysis by Data Modality, 2020-2035
  • Figure 232: South Asia & Pacific Market Value Share (%) and BPS Analysis by Data Modality, 2025-2035
  • Figure 233: South Asia & Pacific Market Y-o-Y Growth (%) Projections by Data Modality, 2025-2035
  • Figure 234: South Asia & Pacific Market Value (USD Million) Analysis by End Use Industry, 2020-2035
  • Figure 235: South Asia & Pacific Market Volume (Units) Analysis by End Use Industry, 2020-2035
  • Figure 236: South Asia & Pacific Market Value Share (%) and BPS Analysis by End Use Industry, 2025-2035
  • Figure 237: South Asia & Pacific Market Y-o-Y Growth (%) Projections by End Use Industry, 2025-2035
  • Figure 238: South Asia & Pacific Market Value (USD Million) Analysis by Pricing Model, 2020-2035
  • Figure 239: South Asia & Pacific Market Volume (Units) Analysis by Pricing Model, 2020-2035
  • Figure 240: South Asia & Pacific Market Value Share (%) and BPS Analysis by Pricing Model, 2025-2035
  • Figure 241: South Asia & Pacific Market Y-o-Y Growth (%) Projections by Pricing Model, 2025-2035
  • Figure 242: South Asia & Pacific Market Value (USD Million) Analysis by Booking Channel, 2020-2035
  • Figure 243: South Asia & Pacific Market Volume (Units) Analysis by Booking Channel, 2020-2035
  • Figure 244: South Asia & Pacific Market Value Share (%) and BPS Analysis by Booking Channel, 2025-2035
  • Figure 245: South Asia & Pacific Market Y-o-Y Growth (%) Projections by Booking Channel, 2025-2035
  • Figure 246: South Asia & Pacific Market Attractiveness by Service Type, 2025-2035
  • Figure 247: South Asia & Pacific Market Attractiveness by Delivery Model, 2025-2035
  • Figure 248: South Asia & Pacific Market Attractiveness by Data Modality, 2025-2035
  • Figure 249: South Asia & Pacific Market Attractiveness by End Use Industry, 2025-2035
  • Figure 250: South Asia & Pacific Market Attractiveness by Pricing Model, 2025-2035
  • Figure 251: South Asia & Pacific Market Attractiveness by Booking Channel, 2025-2035
  • Figure 252: South Asia & Pacific Market Attractiveness by Country, 2025-2035
  • Figure 253: Middle East and Africa Market Value (USD Million) by Service Type, 2025-2035
  • Figure 254: Middle East and Africa Market Value (USD Million) by Delivery Model, 2025-2035
  • Figure 255: Middle East and Africa Market Value (USD Million) by Data Modality, 2025-2035
  • Figure 256: Middle East and Africa Market Value (USD Million) by End Use Industry, 2025-2035
  • Figure 257: Middle East and Africa Market Value (USD Million) by Pricing Model, 2025-2035
  • Figure 258: Middle East and Africa Market Value (USD Million) by Booking Channel, 2025-2035
  • Figure 259: Middle East and Africa Market Value (USD Million) by Country, 2025-2035
  • Figure 260: Middle East and Africa Market Value (USD Million) Analysis by Country, 2020-2035
  • Figure 261: Middle East and Africa Market Volume (Units) Analysis by Country, 2020-2035
  • Figure 262: Middle East and Africa Market Value Share (%) and BPS Analysis by Country, 2025-2035
  • Figure 263: Middle East and Africa Market Y-o-Y Growth (%) Projections by Country, 2025-2035
  • Figure 264: Middle East and Africa Market Value (USD Million) Analysis by Service Type, 2020-2035
  • Figure 265: Middle East and Africa Market Volume (Units) Analysis by Service Type, 2020-2035
  • Figure 266: Middle East and Africa Market Value Share (%) and BPS Analysis by Service Type, 2025-2035
  • Figure 267: Middle East and Africa Market Y-o-Y Growth (%) Projections by Service Type, 2025-2035
  • Figure 268: Middle East and Africa Market Value (USD Million) Analysis by Delivery Model, 2020-2035
  • Figure 269: Middle East and Africa Market Volume (Units) Analysis by Delivery Model, 2020-2035
  • Figure 270: Middle East and Africa Market Value Share (%) and BPS Analysis by Delivery Model, 2025-2035
  • Figure 271: Middle East and Africa Market Y-o-Y Growth (%) Projections by Delivery Model, 2025-2035
  • Figure 272: Middle East and Africa Market Value (USD Million) Analysis by Data Modality, 2020-2035
  • Figure 273: Middle East and Africa Market Volume (Units) Analysis by Data Modality, 2020-2035
  • Figure 274: Middle East and Africa Market Value Share (%) and BPS Analysis by Data Modality, 2025-2035
  • Figure 275: Middle East and Africa Market Y-o-Y Growth (%) Projections by Data Modality, 2025-2035
  • Figure 276: Middle East and Africa Market Value (USD Million) Analysis by End Use Industry, 2020-2035
  • Figure 277: Middle East and Africa Market Volume (Units) Analysis by End Use Industry, 2020-2035
  • Figure 278: Middle East and Africa Market Value Share (%) and BPS Analysis by End Use Industry, 2025-2035
  • Figure 279: Middle East and Africa Market Y-o-Y Growth (%) Projections by End Use Industry, 2025-2035
  • Figure 280: Middle East and Africa Market Value (USD Million) Analysis by Pricing Model, 2020-2035
  • Figure 281: Middle East and Africa Market Volume (Units) Analysis by Pricing Model, 2020-2035
  • Figure 282: Middle East and Africa Market Value Share (%) and BPS Analysis by Pricing Model, 2025-2035
  • Figure 283: Middle East and Africa Market Y-o-Y Growth (%) Projections by Pricing Model, 2025-2035
  • Figure 284: Middle East and Africa Market Value (USD Million) Analysis by Booking Channel, 2020-2035
  • Figure 285: Middle East and Africa Market Volume (Units) Analysis by Booking Channel, 2020-2035
  • Figure 286: Middle East and Africa Market Value Share (%) and BPS Analysis by Booking Channel, 2025-2035
  • Figure 287: Middle East and Africa Market Y-o-Y Growth (%) Projections by Booking Channel, 2025-2035
  • Figure 288: Middle East and Africa Market Attractiveness by Service Type, 2025-2035
  • Figure 289: Middle East and Africa Market Attractiveness by Delivery Model, 2025-2035
  • Figure 290: Middle East and Africa Market Attractiveness by Data Modality, 2025-2035
  • Figure 291: Middle East and Africa Market Attractiveness by End Use Industry, 2025-2035
  • Figure 292: Middle East and Africa Market Attractiveness by Pricing Model, 2025-2035
  • Figure 293: Middle East and Africa Market Attractiveness by Booking Channel, 2025-2035
  • Figure 294: Middle East and Africa Market Attractiveness by Country, 2025-2035

Frequently Asked Questions

How big is the AI-based Research Services Market in 2025?

The global AI-based Research Services Market is estimated to be valued at USD 7,972.1 million in 2025.

What will be the size of AI-based Research Services Market in 2035?

The market size for the AI-based Research Services Market is projected to reach USD 35,420.4 million by 2035.

How much will be the AI-based Research Services Market growth between 2025 and 2035?

The AI-based Research Services Market is expected to grow at a 16.1% CAGR between 2025 and 2035.

What are the key service types in the AI-based Research Services Market?

The key service types in AI-based Research Services Market are AI-accelerated survey analytics, Predictive insights & forecasting, Social/review listening & sentiment analytics, Automated concept/creative testing, Synthetic respondent / virtual panel simulation

Which service segment is expected to contribute significant share in the AI-based Research Services Market in 2025?

In terms of service type, AI-accelerated survey analytics is expected to command 39.3% share in the AI-based Research Services Market in 2025.

Explore Similar Insights

Future Market Insights

AI-based Research Services Market