The Managed Network Services Market is estimated to be valued at USD 83.6 billion in 2025 and is projected to reach USD 177.2 billion by 2035, registering a compound annual growth rate (CAGR) of 7.8% over the forecast period.
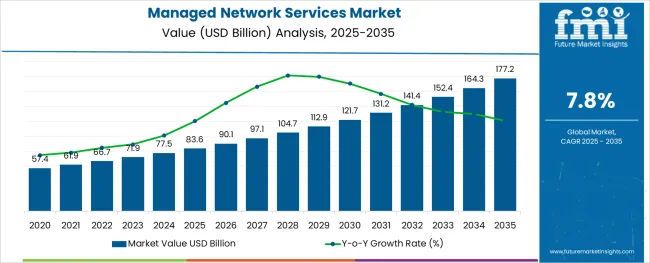
The managed network services market is expanding steadily due to growing enterprise demand for reliable and secure connectivity solutions. Digital transformation initiatives across industries have heightened the need for efficient management of wide area networks to support cloud adoption, remote work, and real-time data access. Organizations are increasingly outsourcing network management to specialized providers to reduce complexity, improve scalability, and enhance security.
Regulatory requirements for data protection and network uptime have also driven investments in managed network solutions. Moreover, the rise of hybrid work models has amplified the importance of resilient network infrastructures.
Future growth is expected to be fueled by advancements in software-defined networking and automation that optimize network performance and cost efficiency. Segmental growth is anticipated to be led by Managed WAN services and the Banking and Financial Services industry, where secure and uninterrupted connectivity is critical.
The market is segmented by Service and End-Use Industry and region. By Service, the market is divided into Managed WAN, MPaLS, ILL, Other Related Services, Managed LAN, Virtual Network Services, Network Security, NLD/ILD, and Other Services. In terms of End-Use Industry, the market is classified into Banking and Financial Services, Manufacturing, Communication, Media and Services, Retail and Wholesale, Healthcare, Utilities, Construction, Education, Government, and Agriculture. Regionally, the market is classified into North America, Latin America, Western Europe, Eastern Europe, Balkan & Baltic Countries, Russia & Belarus, Central Asia, East Asia, South Asia & Pacific, and the Middle East & Africa.
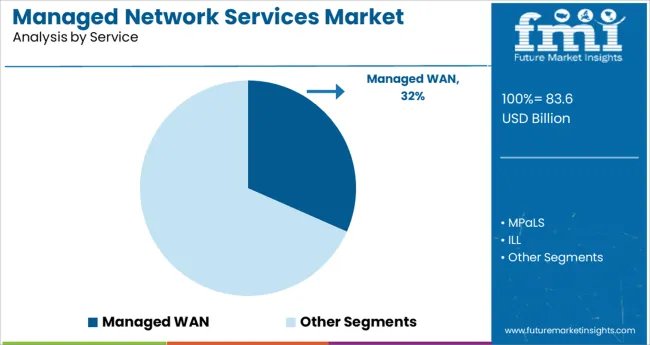
The Managed WAN segment is expected to hold 31.6% of the managed network services market revenue in 2025, positioning it as the leading service category. Growth in this segment is driven by the necessity to manage increasingly complex wide area networks connecting distributed enterprise locations.
Managed WAN services provide centralized control and monitoring, helping organizations optimize bandwidth usage and enhance application performance. The shift towards cloud-based applications and data centers has increased the reliance on WAN services that can dynamically adapt to changing network demands.
Additionally, managed WAN solutions offer enhanced security features to protect against cyber threats, a critical concern for enterprises. As businesses focus on operational continuity and cost-effective network management, Managed WAN is expected to maintain its market dominance.
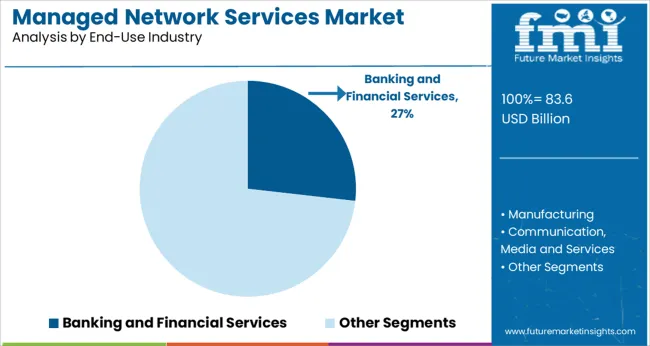
The Banking and Financial Services segment is projected to contribute 26.8% of the managed network services market revenue in 2025, remaining the largest end-use sector. This segment’s growth is driven by the critical need for secure, high-speed connectivity to support financial transactions, customer data protection, and compliance with regulatory standards.
Financial institutions have adopted managed network services to ensure low latency and high availability for digital banking and trading platforms. Additionally, the increasing use of mobile and online banking has necessitated robust network infrastructures capable of handling large volumes of real-time data.
The sector’s focus on mitigating cyber risks and ensuring disaster recovery capabilities has further accelerated managed network adoption. Given the sensitive nature of financial data and the growing complexity of digital services, the Banking and Financial Services segment is expected to sustain its leading position in the market.
The major factors boosting managed network services market trends are rising globalization, digitization and increasing use of cloud and BI/Analytics across all industry verticals.
With rising operational complexity due to organizations integrating more cloud, social, mobile, and big data, most CIOs are increasingly considering managed network services as a part of their network strategy, which increases the managed network services market key trends & opportunities.
The networks become more complex, and the need for managed services is getting higher in preference as financial companies and banks continue to integrate advanced technologies with their operations and expand their geographical reach to increase managed network services future trends in coming years.
Managed network services are expected to see high adoption in the BFSI sector. Furthermore, with increasing incidences of network security breaches, companies increasingly prefer adopting managed network services in-house maintenance to ensure high expertise deployment.
Lack of IT workforce skilled with expertise in the cloud era is another factor for organizations triggering them to deploy in the sales of managed network services.
Over the forecast period, as an organization become dependent on technologies such as IoT, AI, Augmented and Virtual Reality, Robotics and Automation, Network Services, Security, and Network Uptime is of crucial importance to rise the managed network services market growth.
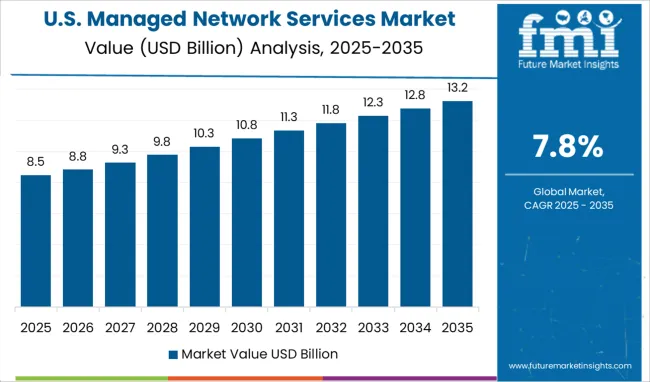
The North American region is likely to dominate the managed network services market statistics with a share of 32.1% all around the region and is likely to enlarge the market during the forecast period.
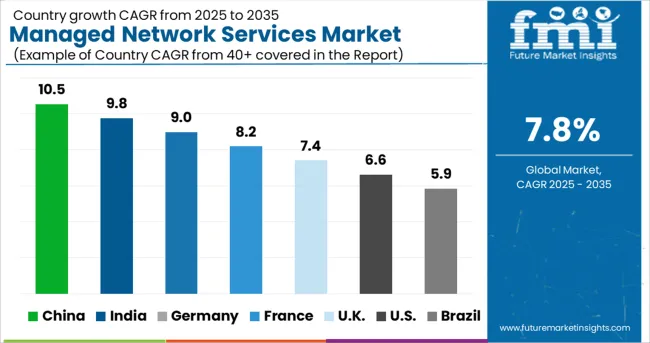
Europe is expected to grow with the managed network services market share of 21.7% during the forecast period.
The Europe managed network services market by country 2024 was dominated by the German market. The increased investment in cloud computing technologies is what essentially propels Europe's managed network services market.
The changing market and technologies are causing a change in business paradigms. With their contemporary techniques and enhanced technology, new managed network service market competitors are providing fierce rivalry to established participants.
Cloud-based network management software is offered by Ciena. It offers software tools that support network planning and infrastructure management across the course of the infrastructure's life. WDM solutions and photonic layer solutions make up its optical technology offering.
A network performance management system is offered by SevOne. To guarantee application performance and dependability, it provides real-time monitoring, debugging, and performance reporting solutions.
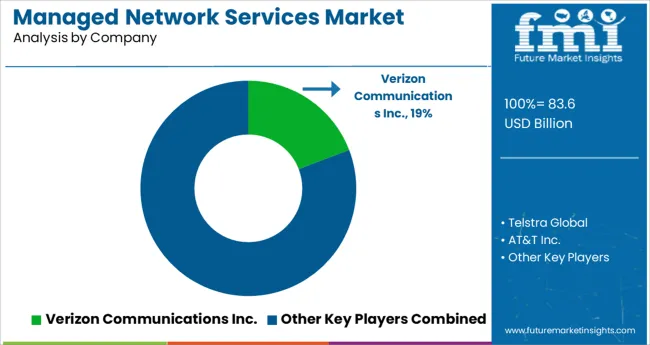
Several key competitors in the managed network services market are focusing on building a lion’s share in the market by adopting their various methodologies and plans. Some of the key competitors in the growth of managed network services market trends are:
In 2024, South Korea and Cisco announced their collaboration in the Cisco country’s digital acceleration program all around the country as it is a worldwide leader in technology.
In 2024, AT&T provides the ERIKS in the digital transport networks to rise in the managed network in the USA.
| Report Attribute | Details |
|---|---|
| Growth Rate | CAGR of 7.8% from 2025 to 2035 |
| Base Year for Estimation | 2024 |
| Historical Data | 2020 to 2024 |
| Forecast Period | 2025 to 2035 |
| Quantitative Units | Revenue in million and CAGR from 2025 to 2035 |
| Report Coverage | Revenue Forecast, Volume Forecast, Company Ranking, Competitive Landscape, Growth Factors, Trends and Pricing Analysis |
| Segments Covered | Service, End User, Region |
| Regions Covered | North America; Latin America; Europe; East Asia; South Asia; Oceania; Middle East and Africa |
| Key Countries Profiled | USA, Canada, Brazil, Argentina, Germany, UK, France, Spain, Italy, Nordics, BENELUX, Australia & New Zealand, China, India, ASEAN, GCC, South Africa |
| Key Companies Profiled | Verizon Communications Inc.; Telstra Global; AT&T Inc.; China Telecom; NTT Communications; HCL Technologies; Wipro Limited; Nokia Corporation; IBM Corporation; Cisco Systems Inc.; Vodafone Group plc; Tata Communication; Bharti Airtel; Reliance Communication; Sift Technologies Ltd. |
| Customization | Available Upon Request |
The global managed network services market is estimated to be valued at USD 83.6 billion in 2025.
It is projected to reach USD 177.2 billion by 2035.
The market is expected to grow at a 7.8% CAGR between 2025 and 2035.
The key product types are managed wan, mpals, ill, other related services, managed lan, virtual network services, network security, nld/ild and other services.
banking and financial services segment is expected to dominate with a 26.8% industry share in 2025.


Our Research Products

The "Full Research Suite" delivers actionable market intel, deep dives on markets or technologies, so clients act faster, cut risk, and unlock growth.

The Leaderboard benchmarks and ranks top vendors, classifying them as Established Leaders, Leading Challengers, or Disruptors & Challengers.

Locates where complements amplify value and substitutes erode it, forecasting net impact by horizon

We deliver granular, decision-grade intel: market sizing, 5-year forecasts, pricing, adoption, usage, revenue, and operational KPIs—plus competitor tracking, regulation, and value chains—across 60 countries broadly.

Spot the shifts before they hit your P&L. We track inflection points, adoption curves, pricing moves, and ecosystem plays to show where demand is heading, why it is changing, and what to do next across high-growth markets and disruptive tech

Real-time reads of user behavior. We track shifting priorities, perceptions of today’s and next-gen services, and provider experience, then pace how fast tech moves from trial to adoption, blending buyer, consumer, and channel inputs with social signals (#WhySwitch, #UX).

Partner with our analyst team to build a custom report designed around your business priorities. From analysing market trends to assessing competitors or crafting bespoke datasets, we tailor insights to your needs.
Supplier Intelligence
Discovery & Profiling
Capacity & Footprint
Performance & Risk
Compliance & Governance
Commercial Readiness
Who Supplies Whom
Scorecards & Shortlists
Playbooks & Docs
Category Intelligence
Definition & Scope
Demand & Use Cases
Cost Drivers
Market Structure
Supply Chain Map
Trade & Policy
Operating Norms
Deliverables
Buyer Intelligence
Account Basics
Spend & Scope
Procurement Model
Vendor Requirements
Terms & Policies
Entry Strategy
Pain Points & Triggers
Outputs
Pricing Analysis
Benchmarks
Trends
Should-Cost
Indexation
Landed Cost
Commercial Terms
Deliverables
Brand Analysis
Positioning & Value Prop
Share & Presence
Customer Evidence
Go-to-Market
Digital & Reputation
Compliance & Trust
KPIs & Gaps
Outputs
Full Research Suite comprises of:
Market outlook & trends analysis
Interviews & case studies
Strategic recommendations
Vendor profiles & capabilities analysis
5-year forecasts
8 regions and 60+ country-level data splits
Market segment data splits
12 months of continuous data updates
DELIVERED AS:
PDF EXCEL ONLINE
Managed File Transfer (MFT) Market Size and Share Forecast Outlook 2025 to 2035
Managed Travel Distribution Market Size and Share Forecast Outlook 2025 to 2035
Managed DDoS Protection Market Report - Growth & Forecast 2025 to 2035
Managed Detection and Response Market
Managed Services Market Analysis - Size, Share, and Forecast Outlook 2025 to 2035
Managed Print Services Market by Type by Industry & Region Forecast till 2035
Managed SD-WAN Services Market Size and Share Forecast Outlook 2025 to 2035
Managed Mobility Services Market Size and Share Forecast Outlook 2025 to 2035
Managed Database Services Market Report - Growth & Forecast 2025 to 2035
Managed Workplace Services Market Analysis – Growth & Forecast through 2035
Managed Blockchain Services Market Size and Share Forecast Outlook 2025 to 2035
Managed Infrastructure Services Market Analysis by Solution, Application, and Region Through 2035
USA Managed Workplace Services Market Insights – Trends, Demand & Growth 2025-2035
Cloud Managed Services Market
Japan Managed Workplace Services Market Growth – Trends, Demand & Innovations 2025-2035
Telecom Managed Service Market Trends - Growth & Forecast 2025 to 2035
Germany Managed Workplace Services Market Analysis – Demand, Growth & Forecast 2025-2035
UK Countries Managed Workplace Services Market Report – Demand, Trends & Industry Forecast 2025-2035
GCC Countries Managed Workplace Services Market Report – Growth, Demand & Forecast 2025-2035
Network Simulator Software Market Size and Share Forecast Outlook 2025 to 2035

Thank you!
You will receive an email from our Business Development Manager. Please be sure to check your SPAM/JUNK folder too.
Chat With
MaRIA