Reports

- Global Locations -

Headquarters

Future Market Insights, Inc.

Christiana Corporate, 200
Continental Drive, Suite 401,
Newark, Delaware - 19713,
United States

T: +1-845-579-5705

Americas

Future Market Insights, Inc.

616 Corporate Way, Suite 2-9018,
Valley Cottage, NY 10989, United States

T: +1-347-918-3531

MEA

Future Market Insights

1602-6 Jumeirah Bay X2 Tower, Plot No: JLT-PH2-X2A,
Jumeirah Lakes Towers, Dubai,
United Arab Emirates

Europe

Future Market Insights

3rd Floor, 207 Regent Street,
W1B 3HH London
United Kingdom

T: + 44 (0) 20 8123 9659
D: +44 (0) 20 3287 4268

Asia Pacific

Future Market Insights

IndiaLand Global Tech Park, Unit UG-1, Behind Grand HighStreet, Phase 1, Hinjawadi, MH, Pune – 411057, India

Mobile Hotspot Router Market Snapshot (2022 to 2032)

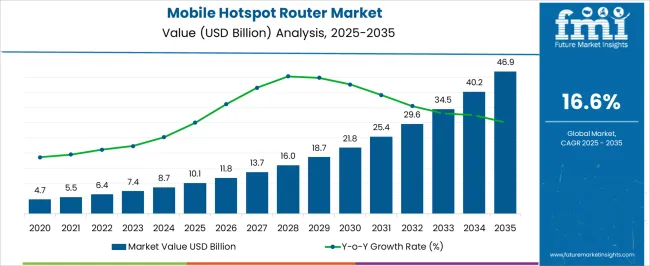
[299 Pages Report] The global mobile hotspot router market is anticipated to be valued at US$ 6,369.5 Million in 2022, forecast a CAGR of 16.6% to be valued at US$ 29,550 Million from 2022 to 2032. Growth is attributed to the increasing usage of IoT-based applications. From 2016 to 2021 a CAGR of 14.6% was registered for the mobile hotspot router market.

Data Points Key Statistics
Growth Rate (2016 to 2021) 14.6% CAGR
Projected Growth Rate (2022 to 2032) 16.6% CAGR
Expected Market Value (2022) US$ 6,369.5 Million
Anticipated Forecast Value (2032) US$ 29,550.0 Million

Recent technical advancements in wireless standards and growing demand for mobile broadband services triggers the rapid demand for mobile hotspot router in the global market. A mobile hotspot router is a device that connects to the Internet through 3G or 4G LTE services to share the wireless network connection with other Wi-fi-enabled devices.

Most portable hotspot devices use the 3G and 4G signals from network providers to enable the connection. Mobile Wi-fi hotspots therefore often need a SIM card that provides the connectivity. The mobile hotspot routers are equipped with an in-built battery with a pocket-friendly design.

Mobile hotspot routers also come with LCD screens, which display network strength, status messages, hotspot name data usage, and a number of connected devices. Mobile hotspot routers are charged using a USB cable and can be connected to laptops and other devices via a USB cable to access the internet.

Don't pay for what you don't need

Customize your report by selecting specific countries or regions and save 30%!

Which are Some Prominent Drivers Spearheading Mobile Hotspot Router Market Growth?

Technological Advancements in Connected Devices to Fuel Industry Expansion

Increasing demand for wireless broadband, increasing smartphone users, and growing awareness of the pay-as-you-go business model are the key factors contributing to the growth of the mobile hotspot router market globally. Increasing business travelers, expanding Wi-Fi-enabled smart devices, the growing trend of including Wi-Fi access in transportation services, and increasing adoption of long-term evolution (LTE) services are further accelerating the demand for the mobile hotspot router market globally.

Also, increasing preference for online services and continuous investment in communication infrastructure are expected to fuel the growth of the global mobile hotspot router market.

Rising disposable income increases the probability of consumer spending on media, entertainment, networking, and mobile communication - leading to higher potential sales of mobile hotspot routers. The global market is expected to witness substantial growth over the forecast period owing to advancements in the electronic, telecommunication, and e-commerce industries.

What are the Challenges Faced by the Mobile Hotspot Router Industry?

Although the mobile hotspot router market has numerous end-uses, there are numerous obstacles that likely pose a challenge to market growth. The cost and complexities related to the development of the product will hinder the growth of the market in the forecasting period.

However, limited Wi-Fi signal range, security, issues related to authentication, network performance, and increasing availability of public hotspots are identified as the restraints likely to deter the progression of the mobile hotspot router market globally.

Factors hindering the growth of the global mobile hotspot router market, are fluctuating price of raw materials being used to manufacture switches and the presence of low-quality cheap products by other manufacturers in the market key restraints of the global mobile hotspot router market.

Sudip Saha
Sudip Saha

Principal Consultant

Talk to Analyst

Find your sweet spots for generating winning opportunities in this market.

Why is North America Emerging as an Opportunistic Mobile Hotspot Router Market?

Rapid Development in Technology to Drive the Growth of the Market in the Forecast Period

North America dominated the global mobile hotspot router market in 2022. The region is likely to account for a market share of 38.6% in global enterprise key management market. Rapid digitalization, along with the rising demand for wireless and mobile broadband services, is one of the key factors driving the growth of the market.

Region-wise, North America is anticipated to dominate the global market over the forecast period owing to the increasing number of mobile subscribers and high internet penetration mainly smartphone users.  The increase in disposable incomes of middle-class households in the region is expected to augment the mobile hotspot router market.

How is Europe Contributing to the Growth of the Mobile Hotspot Router Market?

Presence of Leading Market Providers in the Region Market Growth

According to Future Market Insights, Europe is expected to provide immense growth opportunities for the mobile hotspot router market, due to an increase in sales of hotspot routers in the European region being fueled by technological developments and a growing consumer electronics market.

The Europe mobile hotspot router market will likely account for a 23.1% share of the total global market in 2022. The growing demand for more advanced handheld devices such as smartphones and tablets is expected to create demand for technologies with high internet speed. This, in turn, is expected to drive the growth of the mobile hotspot router market.

For instance, NETGEAR®, Inc. launched the NETGEAR AirCard® 790 Mobile Hotspot (AC790) in Europe. It is the first unlocked mobile hotspot to provide ultra-fast Category 6 4G LTE speeds combined with the latest 802.11ac WiFi that also offers complete freedom of choice in wireless service providers.

Get the data you need at a Fraction of the cost

Personalize your report by choosing insights you need
and save 40%!

Will the Asia Pacific emerge as an Attractive Mobile Hotspot Router Market?

Increasing Digitalization in The Region Boost the Market Growth in Coming Years

Asia Pacific is expected to show high growth rates in the next five years in the mobile hotspot router market. Some of the factors driving the growth of mobile hotspot routers in emerging markets are, rapid advancements being made in technology coupled with increasing investments in research and development is anticipated to further drive the market.

A significant change in lifestyle and increased smartphone penetration in the region are expected to drive the Asia Pacific mobile payment transaction market. Furthermore, there is an increasing involvement by the public authorities in this region to make the transaction an easy process, and they are making all efforts from their end to go cashless and promote digital transactions.

Start-Up Scenario

The new entrants in the mobile hotspot router market are continually indulging in several collaborations and highly investing in research and development activities to provide more convenient solutions to industry verticals. Some of the major start-ups that are leading the development of the market are- Milesight IoT, Four-Faith, Smile MBB,

  • Four-Faith - Founded in 2008, Four-Faith is the world's leading Internet of Things communication equipment and solution service provider. With technological innovation as the core, Four-Faith revolves around wireless communication technology, 5G, AI, etc. Four-Faith's key products include Industrial Routers, Lora&NB-IoT products, IoT surveillance systems, Gateway, Module, Fault Indicator, IP Modem, etc.

Market Competition

Some of the key participants present in the global mobile hotspot router market include Huawei Technologies Co., Ltd., Novatel Wireless, Inc., NETGEAR, TP-Link Technologies Co., Ltd., Belkin International, Inc., Internet on the Go, Karma Mobility, Inc., D-Link Corporation and XCom Global, Inc. Alcatel, among others.

Attributed to the presence of such a high number of participants, the market is highly competitive. While global players such as Huawei Technologies Co., Ltd., Novatel Wireless, Inc., NETGEAR, TP-Link Technologies Co., Ltd., and Belkin International, Inc. account for considerable market size, several regional-level players are also operating across key growth regions, particularly in Asia Pacific.

  • In January 2021- NETGEAR introduced the Nighthawk M5 Mobile Router, powered by the Qualcomm® Snapdragon™ X55 Mobile Platform to deliver premium performance and ground-breaking speeds*. With the latest Wi-Fi 6 technology, one can enjoy more capacity for connected devices anytime, anywhere. An unlocked device will accept all SIM cards; works best on AT&T and T-Mobile networks.
  • In February 2020, Huawei launched the NetEngine 8000 series, the industry's first E2E 400GE routers oriented towards the 5G and cloud era, which redefines the intelligent IP network with ultra-broadband and committed SLA.

Report Scope

Report Attribute Details
Growth Rate CAGR of 16.6% from 2022 to 2032
Expected Market Value (2022) US$ 6,369.5 Million
Anticipated Forecast Value (2032) US$ 29,550.0 Million
Base Year for Estimation 2021
Historical Data 2016 to 2021
Forecast Period 2022 to 2032
Quantitative Units Revenue in US$ Million, and CAGR from 2022 to 2032
Report Coverage Revenue Forecast, Volume Forecast, Company Ranking, Competitive Landscape, Growth Factors, Trends, and Pricing Analysis
Segments Covered
  • Type
  • End-user
  • Region
Regions Covered
  • North America
  • Latin America
  • Europe
  • Asia Pacific
  • Middle East and Africa
Key Countries Profiled
  • The USA
  • Canada
  • Mexico
  • Brazil
  • Germany
  • Italy
  • France
  • The United Kingdom
  • Spain
  • China
  • Japan
  • South Korea
  • Malaysia
  • Singapore
  • Australia
  • New Zealand
  • GCC
  • South Africa
  • Israel
Key Companies Profiled
  • Huawei Technologies Co., Ltd.
  • Novatel Wireless, Inc.
  • NETGEAR
  • TP-Link Technologies Co., Ltd.
  • Belkin International, Inc.
  • Internet on the Go
  • Karma Mobility, Inc.
  • D-Link Corporation
  • XCom Global, Inc.
  • Alcatel
Customization Available Upon Request

Key Segments Profiled in the Mobile Hotspot Router Industry Survey

Mobile Hotspot Router Market by Type:

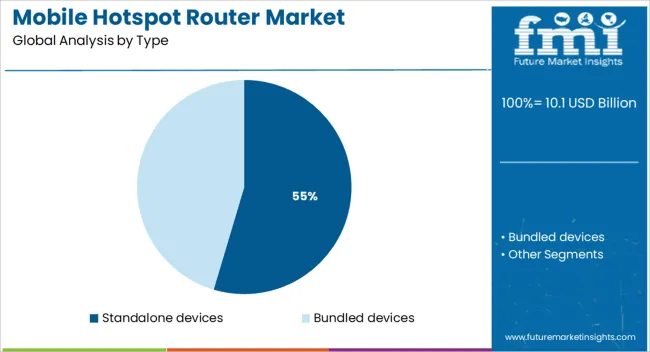
  • Standalone Mobile Hotspot Routers
  • Bundled Mobile Hotspot Routers

Mobile Hotspot Router Market by End User:

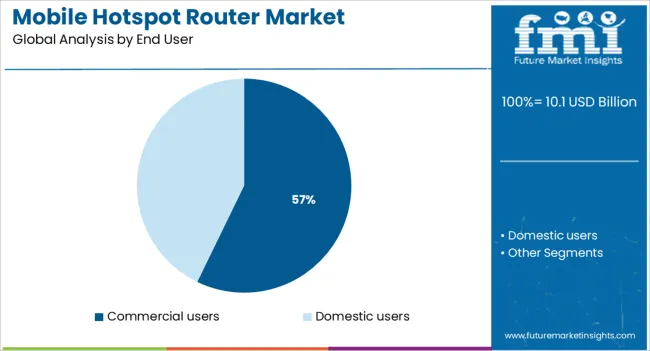
  • Mobile Hotspot Router for Domestic Use
  • Mobile Hotspot Router for Commercial Use

Mobile Hotspot Router Market by Region:

  • North America Mobile Hotspot Router Market
  • Latin America Mobile Hotspot Router Market
  • Europe Mobile Hotspot Router Market
  • Asia Pacific Mobile Hotspot Router Market
  • Middle East and Africa Mobile Hotspot Router Market

Frequently Asked Questions

What is the anticipated growth of the mobile hotspot router market until 2032?

FMI projects the global mobile hotspot router market to expand at a 16.6% value CAGR by 2032

Which region is forecast to be the most lucrative for mobile hotspot router market growth?

North America is expected to be the most opportunistic with a 38.6% share of the total mobile hotspot router market

Which are some prominent mobile hotspot router market manufacturers?

Huawei Technologies Co., Ltd., Novatel Wireless, Inc., NETGEAR, TP-Link Technologies Co., Ltd., Belkin International, Inc. are some prominent mobile hotspot router, market manufacturers.

Table of Content

1. Executive Summary | Mobile Hotspot Router Market

    1.1. Global Market Outlook

    1.2. Demand-side Trends

    1.3. Supply-side Trends

    1.4. Technology Roadmap Analysis

    1.5. Analysis and Recommendations

2. Market Overview

    2.1. Market Coverage / Taxonomy

    2.2. Market Definition / Scope / Limitations

3. Market Background

    3.1. Market Dynamics

        3.1.1. Drivers

        3.1.2. Restraints

        3.1.3. Opportunity

        3.1.4. Trends

    3.2. Scenario Forecast

        3.2.1. Demand in Optimistic Scenario

        3.2.2. Demand in Likely Scenario

        3.2.3. Demand in Conservative Scenario

    3.3. Opportunity Map Analysis

    3.4. Product Life Cycle Analysis

    3.5. Supply Chain Analysis

        3.5.1. Supply Side Participants and their Roles

            3.5.1.1. Producers

            3.5.1.2. Mid-Level Participants (Traders/ Agents/ Brokers)

            3.5.1.3. Wholesalers and Distributors

        3.5.2. Value Added and Value Created at Node in the Supply Chain

        3.5.3. List of Raw Material Suppliers

        3.5.4. List of Existing and Potential Buyer’s

    3.6. Investment Feasibility Matrix

    3.7. Value Chain Analysis

        3.7.1. Profit Margin Analysis

        3.7.2. Wholesalers and Distributors

        3.7.3. Retailers

    3.8. PESTLE and Porter’s Analysis

    3.9. Regulatory Landscape

        3.9.1. By Key Regions

        3.9.2. By Key Countries

    3.10. Regional Parent Market Outlook

    3.11. Production and Consumption Statistics

    3.12. Import and Export Statistics

4. Global Market Analysis 2016 to 2021 and Forecast, 2022 to 2032

    4.1. Historical Market Size Value (US$ million) & Volume (Units) Analysis, 2016 to 2021

    4.2. Current and Future Market Size Value (US$ million) & Volume (Units) Projections, 2022 to 2032

        4.2.1. Y-o-Y Growth Trend Analysis

        4.2.2. Absolute $ Opportunity Analysis

5. Global Market Analysis 2016 to 2021 and Forecast 2022 to 2032, By Type

    5.1. Introduction / Key Findings

    5.2. Historical Market Size Value (US$ million) & Volume (Units) Analysis By Type, 2016 to 2021

    5.3. Current and Future Market Size Value (US$ million) & Volume (Units) Analysis and Forecast By Type, 2022 to 2032

        5.3.1. Standalone devices

        5.3.2. Bundled devices

    5.4. Y-o-Y Growth Trend Analysis By Type, 2016 to 2021

    5.5. Absolute $ Opportunity Analysis By Type, 2022 to 2032

6. Global Market Analysis 2016 to 2021 and Forecast 2022 to 2032, By End User

    6.1. Introduction / Key Findings

    6.2. Historical Market Size Value (US$ million) & Volume (Units) Analysis By End User, 2016 to 2021

    6.3. Current and Future Market Size Value (US$ million) & Volume (Units) Analysis and Forecast By End User, 2022 to 2032

        6.3.1. Domestic users

        6.3.2. Commercial users

    6.4. Y-o-Y Growth Trend Analysis By End User, 2016 to 2021

    6.5. Absolute $ Opportunity Analysis By End User, 2022 to 2032

7. Global Market Analysis 2016 to 2021 and Forecast 2022 to 2032, By Region

    7.1. Introduction

    7.2. Historical Market Size Value (US$ million) & Volume (Units) Analysis By Region, 2016 to 2021

    7.3. Current Market Size Value (US$ million) & Volume (Units) Analysis and Forecast By Region, 2022 to 2032

        7.3.1. North America

        7.3.2. Latin America

        7.3.3. Europe

        7.3.4. Asia Pacific

        7.3.5. Middle East and Africa (MEA)

    7.4. Market Attractiveness Analysis By Region

8. North America Market Analysis 2016 to 2021 and Forecast 2022 to 2032, By Country

    8.1. Historical Market Size Value (US$ million) & Volume (Units) Trend Analysis By Market Taxonomy, 2016 to 2021

    8.2. Market Size Value (US$ million) & Volume (Units) Forecast By Market Taxonomy, 2022 to 2032

        8.2.1. By Country

            8.2.1.1. U.S.

            8.2.1.2. Canada

        8.2.2. By Type

        8.2.3. By End User

    8.3. Market Attractiveness Analysis

        8.3.1. By Country

        8.3.2. By Type

        8.3.3. By End User

    8.4. Key Takeaways

9. Latin America Market Analysis 2016 to 2021 and Forecast 2022 to 2032, By Country

    9.1. Historical Market Size Value (US$ million) & Volume (Units) Trend Analysis By Market Taxonomy, 2016 to 2021

    9.2. Market Size Value (US$ million) & Volume (Units) Forecast By Market Taxonomy, 2022 to 2032

        9.2.1. By Country

            9.2.1.1. Brazil

            9.2.1.2. Mexico

            9.2.1.3. Rest of Latin America

        9.2.2. By Type

        9.2.3. By End User

    9.3. Market Attractiveness Analysis

        9.3.1. By Country

        9.3.2. By Type

        9.3.3. By End User

    9.4. Key Takeaways

10. Europe Market Analysis 2016 to 2021 and Forecast 2022 to 2032, By Country

    10.1. Historical Market Size Value (US$ million) & Volume (Units) Trend Analysis By Market Taxonomy, 2016 to 2021

    10.2. Market Size Value (US$ million) & Volume (Units) Forecast By Market Taxonomy, 2022 to 2032

        10.2.1. By Country

            10.2.1.1. Germany

            10.2.1.2. U.K.

            10.2.1.3. France

            10.2.1.4. Spain

            10.2.1.5. Italy

            10.2.1.6. Rest of Europe

        10.2.2. By Type

        10.2.3. By End User

    10.3. Market Attractiveness Analysis

        10.3.1. By Country

        10.3.2. By Type

        10.3.3. By End User

    10.4. Key Takeaways

11. Asia Pacific Market Analysis 2016 to 2021 and Forecast 2022 to 2032, By Country

    11.1. Historical Market Size Value (US$ million) & Volume (Units) Trend Analysis By Market Taxonomy, 2016 to 2021

    11.2. Market Size Value (US$ million) & Volume (Units) Forecast By Market Taxonomy, 2022 to 2032

        11.2.1. By Country

            11.2.1.1. China

            11.2.1.2. Japan

            11.2.1.3. South Korea

            11.2.1.4. Malaysia

            11.2.1.5. Singapore

            11.2.1.6. Australia

            11.2.1.7. New Zealand

            11.2.1.8. Rest of APAC

        11.2.2. By Type

        11.2.3. By End User

    11.3. Market Attractiveness Analysis

        11.3.1. By Country

        11.3.2. By Type

        11.3.3. By End User

    11.4. Key Takeaways

12. MEA Market Analysis 2016 to 2021 and Forecast 2022 to 2032, By Country

    12.1. Historical Market Size Value (US$ million) & Volume (Units) Trend Analysis By Market Taxonomy, 2016 to 2021

    12.2. Market Size Value (US$ million) & Volume (Units) Forecast By Market Taxonomy, 2022 to 2032

        12.2.1. By Country

            12.2.1.1. GCC Countries

            12.2.1.2. South Africa

            12.2.1.3. Israel

            12.2.1.4. Rest of MEA

        12.2.2. By Type

        12.2.3. By End User

    12.3. Market Attractiveness Analysis

        12.3.1. By Country

        12.3.2. By Type

        12.3.3. By End User

    12.4. Key Takeaways

13. Key Countries Market Analysis

    13.1. U.S.

        13.1.1. Pricing Analysis

        13.1.2. Market Share Analysis, 2021

            13.1.2.1. By Type

            13.1.2.2. By End User

    13.2. Canada

        13.2.1. Pricing Analysis

        13.2.2. Market Share Analysis, 2021

            13.2.2.1. By Type

            13.2.2.2. By End User

    13.3. Brazil

        13.3.1. Pricing Analysis

        13.3.2. Market Share Analysis, 2021

            13.3.2.1. By Type

            13.3.2.2. By End User

    13.4. Mexico

        13.4.1. Pricing Analysis

        13.4.2. Market Share Analysis, 2021

            13.4.2.1. By Type

            13.4.2.2. By End User

    13.5. Germany

        13.5.1. Pricing Analysis

        13.5.2. Market Share Analysis, 2021

            13.5.2.1. By Type

            13.5.2.2. By End User

    13.6. U.K.

        13.6.1. Pricing Analysis

        13.6.2. Market Share Analysis, 2021

            13.6.2.1. By Type

            13.6.2.2. By End User

    13.7. France

        13.7.1. Pricing Analysis

        13.7.2. Market Share Analysis, 2021

            13.7.2.1. By Type

            13.7.2.2. By End User

    13.8. Spain

        13.8.1. Pricing Analysis

        13.8.2. Market Share Analysis, 2021

            13.8.2.1. By Type

            13.8.2.2. By End User

    13.9. Italy

        13.9.1. Pricing Analysis

        13.9.2. Market Share Analysis, 2021

            13.9.2.1. By Type

            13.9.2.2. By End User

    13.10. China

        13.10.1. Pricing Analysis

        13.10.2. Market Share Analysis, 2021

            13.10.2.1. By Type

            13.10.2.2. By End User

    13.11. Japan

        13.11.1. Pricing Analysis

        13.11.2. Market Share Analysis, 2021

            13.11.2.1. By Type

            13.11.2.2. By End User

    13.12. South Korea

        13.12.1. Pricing Analysis

        13.12.2. Market Share Analysis, 2021

            13.12.2.1. By Type

            13.12.2.2. By End User

    13.13. Malaysia

        13.13.1. Pricing Analysis

        13.13.2. Market Share Analysis, 2021

            13.13.2.1. By Type

            13.13.2.2. By End User

    13.14. Singapore

        13.14.1. Pricing Analysis

        13.14.2. Market Share Analysis, 2021

            13.14.2.1. By Type

            13.14.2.2. By End User

    13.15. Australia

        13.15.1. Pricing Analysis

        13.15.2. Market Share Analysis, 2021

            13.15.2.1. By Type

            13.15.2.2. By End User

    13.16. New Zealand

        13.16.1. Pricing Analysis

        13.16.2. Market Share Analysis, 2021

            13.16.2.1. By Type

            13.16.2.2. By End User

    13.17. GCC Countries

        13.17.1. Pricing Analysis

        13.17.2. Market Share Analysis, 2021

            13.17.2.1. By Type

            13.17.2.2. By End User

    13.18. South Africa

        13.18.1. Pricing Analysis

        13.18.2. Market Share Analysis, 2021

            13.18.2.1. By Type

            13.18.2.2. By End User

    13.19. Israel

        13.19.1. Pricing Analysis

        13.19.2. Market Share Analysis, 2021

            13.19.2.1. By Type

            13.19.2.2. By End User

14. Market Structure Analysis

    14.1. Competition Dashboard

    14.2. Competition Benchmarking

    14.3. Market Share Analysis of Top Players

        14.3.1. By Regional

        14.3.2. By Type

        14.3.3. By End User

15. Competition Analysis

    15.1. Competition Deep Dive

        15.1.1. Huawei Technologies Co., Ltd

            15.1.1.1. Overview

            15.1.1.2. Product Portfolio

            15.1.1.3. Profitability by Market Segments

            15.1.1.4. Sales Footprint

            15.1.1.5. Strategy Overview

                15.1.1.5.1. Marketing Strategy

                15.1.1.5.2. Product Strategy

                15.1.1.5.3. Channel Strategy

        15.1.2. Novatel Wireless

            15.1.2.1. Overview

            15.1.2.2. Product Portfolio

            15.1.2.3. Profitability by Market Segments

            15.1.2.4. Sales Footprint

            15.1.2.5. Strategy Overview

                15.1.2.5.1. Marketing Strategy

                15.1.2.5.2. Product Strategy

                15.1.2.5.3. Channel Strategy

        15.1.3. NETGEAR

            15.1.3.1. Overview

            15.1.3.2. Product Portfolio

            15.1.3.3. Profitability by Market Segments

            15.1.3.4. Sales Footprint

            15.1.3.5. Strategy Overview

                15.1.3.5.1. Marketing Strategy

                15.1.3.5.2. Product Strategy

                15.1.3.5.3. Channel Strategy

        15.1.4. TP-Link Technologies Co., Ltd.

            15.1.4.1. Overview

            15.1.4.2. Product Portfolio

            15.1.4.3. Profitability by Market Segments

            15.1.4.4. Sales Footprint

            15.1.4.5. Strategy Overview

                15.1.4.5.1. Marketing Strategy

                15.1.4.5.2. Product Strategy

                15.1.4.5.3. Channel Strategy

        15.1.5. Belkin International, Inc.

            15.1.5.1. Overview

            15.1.5.2. Product Portfolio

            15.1.5.3. Profitability by Market Segments

            15.1.5.4. Sales Footprint

            15.1.5.5. Strategy Overview

                15.1.5.5.1. Marketing Strategy

                15.1.5.5.2. Product Strategy

                15.1.5.5.3. Channel Strategy

        15.1.6. Internet on the Go

            15.1.6.1. Overview

            15.1.6.2. Product Portfolio

            15.1.6.3. Profitability by Market Segments

            15.1.6.4. Sales Footprint

            15.1.6.5. Strategy Overview

                15.1.6.5.1. Marketing Strategy

                15.1.6.5.2. Product Strategy

                15.1.6.5.3. Channel Strategy

        15.1.7. Karma Mobility, Inc.

            15.1.7.1. Overview

            15.1.7.2. Product Portfolio

            15.1.7.3. Profitability by Market Segments

            15.1.7.4. Sales Footprint

            15.1.7.5. Strategy Overview

                15.1.7.5.1. Marketing Strategy

                15.1.7.5.2. Product Strategy

                15.1.7.5.3. Channel Strategy

        15.1.8. D-Link Corporation

            15.1.8.1. Overview

            15.1.8.2. Product Portfolio

            15.1.8.3. Profitability by Market Segments

            15.1.8.4. Sales Footprint

            15.1.8.5. Strategy Overview

                15.1.8.5.1. Marketing Strategy

                15.1.8.5.2. Product Strategy

                15.1.8.5.3. Channel Strategy

        15.1.9. XCom Global, Inc.

            15.1.9.1. Overview

            15.1.9.2. Product Portfolio

            15.1.9.3. Profitability by Market Segments

            15.1.9.4. Sales Footprint

            15.1.9.5. Strategy Overview

                15.1.9.5.1. Marketing Strategy

                15.1.9.5.2. Product Strategy

                15.1.9.5.3. Channel Strategy

        15.1.10. Alcatel 

            15.1.10.1. Overview

            15.1.10.2. Product Portfolio

            15.1.10.3. Profitability by Market Segments

            15.1.10.4. Sales Footprint

            15.1.10.5. Strategy Overview

                15.1.10.5.1. Marketing Strategy

                15.1.10.5.2. Product Strategy

                15.1.10.5.3. Channel Strategy

16. Assumptions & Acronyms Used

17. Research Methodology

Don't pay for what you don't need

Customize your report by selecting specific countries or regions and save 30%!

List of Tables

Table 01: Global Market Value (US$ million) Forecast by Region, 2016 to 2032

Table 02: Global Market Volume (Units) Forecast by Region, 2016 to 2032

Table 03: Global Market Value (US$ million) Forecast by Type, 2016 to 2032

Table 04: Global Market Volume (Units) Forecast by Type, 2016 to 2032

Table 05: Global Market Value (US$ million) Forecast by End User, 2016 to 2032

Table 06: Global Market Volume (Units) Forecast by End User, 2016 to 2032

Table 07: North America Market Value (US$ million) Forecast by Country, 2016 to 2032

Table 08: North America Market Volume (Units) Forecast by Country, 2016 to 2032

Table 09: North America Market Value (US$ million) Forecast by Type, 2016 to 2032

Table 10: North America Market Volume (Units) Forecast by Type, 2016 to 2032

Table 11: North America Market Value (US$ million) Forecast by End User, 2016 to 2032

Table 12: North America Market Volume (Units) Forecast by End User, 2016 to 2032

Table 13: Latin America Market Value (US$ million) Forecast by Country, 2016 to 2032

Table 14: Latin America Market Volume (Units) Forecast by Country, 2016 to 2032

Table 15: Latin America Market Value (US$ million) Forecast by Type, 2016 to 2032

Table 16: Latin America Market Volume (Units) Forecast by Type, 2016 to 2032

Table 17: Latin America Market Value (US$ million) Forecast by End User, 2016 to 2032

Table 18: Latin America Market Volume (Units) Forecast by End User, 2016 to 2032

Table 19: Europe Market Value (US$ million) Forecast by Country, 2016 to 2032

Table 20: Europe Market Volume (Units) Forecast by Country, 2016 to 2032

Table 21: Europe Market Value (US$ million) Forecast by Type, 2016 to 2032

Table 22: Europe Market Volume (Units) Forecast by Type, 2016 to 2032

Table 23: Europe Market Value (US$ million) Forecast by End User, 2016 to 2032

Table 24: Europe Market Volume (Units) Forecast by End User, 2016 to 2032

Table 25: Asia Pacific Market Value (US$ million) Forecast by Country, 2016 to 2032

Table 26: Asia Pacific Market Volume (Units) Forecast by Country, 2016 to 2032

Table 27: Asia Pacific Market Value (US$ million) Forecast by Type, 2016 to 2032

Table 28: Asia Pacific Market Volume (Units) Forecast by Type, 2016 to 2032

Table 29: Asia Pacific Market Value (US$ million) Forecast by End User, 2016 to 2032

Table 30: Asia Pacific Market Volume (Units) Forecast by End User, 2016 to 2032

Table 31: MEA Market Value (US$ million) Forecast by Country, 2016 to 2032

Table 32: MEA Market Volume (Units) Forecast by Country, 2016 to 2032

Table 33: MEA Market Value (US$ million) Forecast by Type, 2016 to 2032

Table 34: MEA Market Volume (Units) Forecast by Type, 2016 to 2032

Table 35: MEA Market Value (US$ million) Forecast by End User, 2016 to 2032

Table 36: MEA Market Volume (Units) Forecast by End User, 2016 to 2032
Sudip Saha
Sudip Saha

Principal Consultant

Talk to Analyst

Find your sweet spots for generating winning opportunities in this market.

List of Charts

Figure 01: Global Market Value (US$ million) by Type, 2022 to 2032

Figure 02: Global Market Value (US$ million) by End User, 2022 to 2032

Figure 03: Global Market Value (US$ million) by Region, 2022 to 2032

Figure 04: Global Market Value (US$ million) Analysis by Region, 2016 to 2032

Figure 05: Global Market Volume (Units) Analysis by Region, 2016 to 2032

Figure 06: Global Market Value Share (%) and BPS Analysis by Region, 2022 to 2032

Figure 07: Global Market Y-o-Y Growth (%) Projections by Region, 2022 to 2032

Figure 08: Global Market Value (US$ million) Analysis by Type, 2016 to 2032

Figure 09: Global Market Volume (Units) Analysis by Type, 2016 to 2032

Figure 10: Global Market Value Share (%) and BPS Analysis by Type, 2022 to 2032

Figure 11: Global Market Y-o-Y Growth (%) Projections by Type, 2022 to 2032

Figure 12: Global Market Value (US$ million) Analysis by End User, 2016 to 2032

Figure 13: Global Market Volume (Units) Analysis by End User, 2016 to 2032

Figure 14: Global Market Value Share (%) and BPS Analysis by End User, 2022 to 2032

Figure 15: Global Market Y-o-Y Growth (%) Projections by End User, 2022 to 2032

Figure 16: Global Market Attractiveness by Type, 2022 to 2032

Figure 17: Global Market Attractiveness by End User, 2022 to 2032

Figure 18: Global Market Attractiveness by Region, 2022 to 2032

Figure 19: North America Market Value (US$ million) by Type, 2022 to 2032

Figure 20: North America Market Value (US$ million) by End User, 2022 to 2032

Figure 21: North America Market Value (US$ million) by Country, 2022 to 2032

Figure 22: North America Market Value (US$ million) Analysis by Country, 2016 to 2032

Figure 23: North America Market Volume (Units) Analysis by Country, 2016 to 2032

Figure 24: North America Market Value Share (%) and BPS Analysis by Country, 2022 to 2032

Figure 25: North America Market Y-o-Y Growth (%) Projections by Country, 2022 to 2032

Figure 26: North America Market Value (US$ million) Analysis by Type, 2016 to 2032

Figure 27: North America Market Volume (Units) Analysis by Type, 2016 to 2032

Figure 28: North America Market Value Share (%) and BPS Analysis by Type, 2022 to 2032

Figure 29: North America Market Y-o-Y Growth (%) Projections by Type, 2022 to 2032

Figure 30: North America Market Value (US$ million) Analysis by End User, 2016 to 2032

Figure 31: North America Market Volume (Units) Analysis by End User, 2016 to 2032

Figure 32: North America Market Value Share (%) and BPS Analysis by End User, 2022 to 2032

Figure 33: North America Market Y-o-Y Growth (%) Projections by End User, 2022 to 2032

Figure 34: North America Market Attractiveness by Type, 2022 to 2032

Figure 35: North America Market Attractiveness by End User, 2022 to 2032

Figure 36: North America Market Attractiveness by Country, 2022 to 2032

Figure 37: Latin America Market Value (US$ million) by Type, 2022 to 2032

Figure 38: Latin America Market Value (US$ million) by End User, 2022 to 2032

Figure 39: Latin America Market Value (US$ million) by Country, 2022 to 2032

Figure 40: Latin America Market Value (US$ million) Analysis by Country, 2016 to 2032

Figure 41: Latin America Market Volume (Units) Analysis by Country, 2016 to 2032

Figure 42: Latin America Market Value Share (%) and BPS Analysis by Country, 2022 to 2032

Figure 43: Latin America Market Y-o-Y Growth (%) Projections by Country, 2022 to 2032

Figure 44: Latin America Market Value (US$ million) Analysis by Type, 2016 to 2032

Figure 45: Latin America Market Volume (Units) Analysis by Type, 2016 to 2032

Figure 46: Latin America Market Value Share (%) and BPS Analysis by Type, 2022 to 2032

Figure 47: Latin America Market Y-o-Y Growth (%) Projections by Type, 2022 to 2032

Figure 48: Latin America Market Value (US$ million) Analysis by End User, 2016 to 2032

Figure 49: Latin America Market Volume (Units) Analysis by End User, 2016 to 2032

Figure 50: Latin America Market Value Share (%) and BPS Analysis by End User, 2022 to 2032

Figure 51: Latin America Market Y-o-Y Growth (%) Projections by End User, 2022 to 2032

Figure 52: Latin America Market Attractiveness by Type, 2022 to 2032

Figure 53: Latin America Market Attractiveness by End User, 2022 to 2032

Figure 54: Latin America Market Attractiveness by Country, 2022 to 2032

Figure 55: Europe Market Value (US$ million) by Type, 2022 to 2032

Figure 56: Europe Market Value (US$ million) by End User, 2022 to 2032

Figure 57: Europe Market Value (US$ million) by Country, 2022 to 2032

Figure 58: Europe Market Value (US$ million) Analysis by Country, 2016 to 2032

Figure 59: Europe Market Volume (Units) Analysis by Country, 2016 to 2032

Figure 60: Europe Market Value Share (%) and BPS Analysis by Country, 2022 to 2032

Figure 61: Europe Market Y-o-Y Growth (%) Projections by Country, 2022 to 2032

Figure 62: Europe Market Value (US$ million) Analysis by Type, 2016 to 2032

Figure 63: Europe Market Volume (Units) Analysis by Type, 2016 to 2032

Figure 64: Europe Market Value Share (%) and BPS Analysis by Type, 2022 to 2032

Figure 65: Europe Market Y-o-Y Growth (%) Projections by Type, 2022 to 2032

Figure 66: Europe Market Value (US$ million) Analysis by End User, 2016 to 2032

Figure 67: Europe Market Volume (Units) Analysis by End User, 2016 to 2032

Figure 68: Europe Market Value Share (%) and BPS Analysis by End User, 2022 to 2032

Figure 69: Europe Market Y-o-Y Growth (%) Projections by End User, 2022 to 2032

Figure 70: Europe Market Attractiveness by Type, 2022 to 2032

Figure 71: Europe Market Attractiveness by End User, 2022 to 2032

Figure 72: Europe Market Attractiveness by Country, 2022 to 2032

Figure 73: Asia Pacific Market Value (US$ million) by Type, 2022 to 2032

Figure 74: Asia Pacific Market Value (US$ million) by End User, 2022 to 2032

Figure 75: Asia Pacific Market Value (US$ million) by Country, 2022 to 2032

Figure 76: Asia Pacific Market Value (US$ million) Analysis by Country, 2016 to 2032

Figure 77: Asia Pacific Market Volume (Units) Analysis by Country, 2016 to 2032

Figure 78: Asia Pacific Market Value Share (%) and BPS Analysis by Country, 2022 to 2032

Figure 79: Asia Pacific Market Y-o-Y Growth (%) Projections by Country, 2022 to 2032

Figure 80: Asia Pacific Market Value (US$ million) Analysis by Type, 2016 to 2032

Figure 81: Asia Pacific Market Volume (Units) Analysis by Type, 2016 to 2032

Figure 82: Asia Pacific Market Value Share (%) and BPS Analysis by Type, 2022 to 2032

Figure 83: Asia Pacific Market Y-o-Y Growth (%) Projections by Type, 2022 to 2032

Figure 84: Asia Pacific Market Value (US$ million) Analysis by End User, 2016 to 2032

Figure 85: Asia Pacific Market Volume (Units) Analysis by End User, 2016 to 2032

Figure 86: Asia Pacific Market Value Share (%) and BPS Analysis by End User, 2022 to 2032

Figure 87: Asia Pacific Market Y-o-Y Growth (%) Projections by End User, 2022 to 2032

Figure 88: Asia Pacific Market Attractiveness by Type, 2022 to 2032

Figure 89: Asia Pacific Market Attractiveness by End User, 2022 to 2032

Figure 90: Asia Pacific Market Attractiveness by Country, 2022 to 2032

Figure 91: MEA Market Value (US$ million) by Type, 2022 to 2032

Figure 92: MEA Market Value (US$ million) by End User, 2022 to 2032

Figure 93: MEA Market Value (US$ million) by Country, 2022 to 2032

Figure 94: MEA Market Value (US$ million) Analysis by Country, 2016 to 2032

Figure 95: MEA Market Volume (Units) Analysis by Country, 2016 to 2032

Figure 96: MEA Market Value Share (%) and BPS Analysis by Country, 2022 to 2032

Figure 97: MEA Market Y-o-Y Growth (%) Projections by Country, 2022 to 2032

Figure 98: MEA Market Value (US$ million) Analysis by Type, 2016 to 2032

Figure 99: MEA Market Volume (Units) Analysis by Type, 2016 to 2032

Figure 100: MEA Market Value Share (%) and BPS Analysis by Type, 2022 to 2032

Figure 101: MEA Market Y-o-Y Growth (%) Projections by Type, 2022 to 2032

Figure 102: MEA Market Value (US$ million) Analysis by End User, 2016 to 2032

Figure 103: MEA Market Volume (Units) Analysis by End User, 2016 to 2032

Figure 104: MEA Market Value Share (%) and BPS Analysis by End User, 2022 to 2032

Figure 105: MEA Market Y-o-Y Growth (%) Projections by End User, 2022 to 2032

Figure 106: MEA Market Attractiveness by Type, 2022 to 2032

Figure 107: MEA Market Attractiveness by End User, 2022 to 2032

Figure 108: MEA Market Attractiveness by Country, 2022 to 2032

Recommendations

Technology

Gigabit Wi-Fi Access Point Market

Published : March 2024

Technology

Mobile Data Protection Market

Published : December 2022

Technology

Voice Over LTE (VOLTE) And Voice Over Wi-Fi Market

Published : November 2022

Technology

Micro Mobile Data Center Market

Published : October 2022

Explore Technology Insights

View Reports

Mobile Hotspot Router Market