The blockchain messaging apps market is estimated to be valued at USD 94.6 billion in 2025 and is projected to reach USD 3501.3 billion by 2035, registering a compound annual growth rate (CAGR) of 43.5% over the forecast period.
Application developers evaluate blockchain integration specifications based on consensus mechanisms, transaction throughput, and encryption protocols when designing messaging platforms that balance security features with user experience requirements. Technology stack decisions involve analyzing smart contract capabilities, node infrastructure requirements, and token economics while considering scalability constraints, energy consumption patterns, and regulatory compliance frameworks across different jurisdictions. Development investment priorities balance initial platform creation costs against operational efficiency metrics including message delivery speed, network resilience, and user acquisition costs that influence long-term platform viability.
Infrastructure requirements encompass distributed node networks, cryptocurrency wallet integration, and peer-to-peer communication protocols that eliminate centralized server dependencies while maintaining message reliability and delivery confirmation capabilities. Network architecture involves coordination between blockchain validators, message relay nodes, and storage networks while managing bandwidth optimization, latency minimization, and fault tolerance mechanisms that ensure consistent service availability. Quality assurance procedures address cryptographic implementation verification, smart contract auditing, and penetration testing that validate security effectiveness while maintaining user interface responsiveness across diverse device configurations.
Cross-functional challenges arise between security specialists implementing advanced cryptographic features and user experience designers creating intuitive interfaces that accommodate mainstream adoption without compromising privacy protection capabilities. Platform monetization strategies involve token distribution mechanisms, subscription models, and transaction fee structures while avoiding traditional advertising-based revenue models that compromise user privacy objectives. Development coordination involves blockchain engineers, mobile application developers, and cybersecurity experts collaborating to optimize platform performance while maintaining decentralized architecture principles.
Technology advancement emphasizes quantum-resistant encryption, interoperability protocols, and scalability solutions that address blockchain network limitations while maintaining security effectiveness. Platform developers integrate layer-two solutions, sidechains, and off-chain processing mechanisms that improve transaction throughput and reduce network fees while preserving decentralized architecture benefits. Integration capabilities encompass file sharing systems, voice communication features, and video conferencing tools that provide comprehensive communication solutions without compromising privacy protection objectives.
User acquisition strategies focus on privacy-conscious demographics including journalists, activists, healthcare professionals, and financial services personnel who require secure communication channels for sensitive information exchange. Marketing approaches emphasize data ownership principles, censorship resistance, and surveillance protection while educating potential users about blockchain technology benefits and cryptocurrency integration requirements. Community building initiatives involve open-source development participation, privacy advocacy partnerships, and educational content creation that supports platform adoption and network effect development.
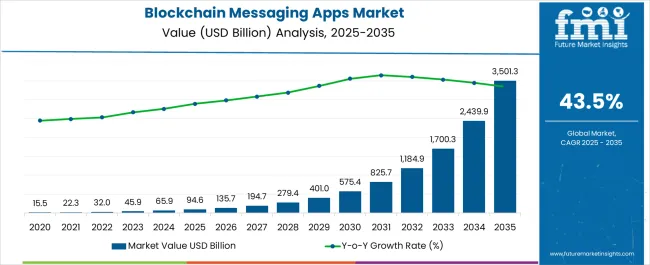
| Metric | Value |
|---|---|
| Blockchain Messaging Apps Market Estimated Value in (2025 E) | USD 94.6 billion |
| Blockchain Messaging Apps Market Forecast Value in (2035 F) | USD 3501.3 billion |
| Forecast CAGR (2025 to 2035) | 43.5% |
The blockchain messaging apps market is experiencing rapid momentum supported by increasing concerns over data privacy, security breaches, and the demand for decentralized communication platforms. Rising adoption of blockchain technology across multiple industries has reinforced trust in its ability to provide tamper proof, encrypted messaging solutions that prioritize user control and transparency.
Advancements in peer to peer networking, token based incentives, and decentralized identity management are further enhancing platform attractiveness. Governments and enterprises are also emphasizing secure communication channels in light of cyber threats, thereby accelerating adoption.
The market outlook remains favorable as consumer preferences shift toward secure, user centric platforms while developers focus on integrating blockchain features such as smart contracts and distributed storage for next generation messaging ecosystems.
The market is segmented by Operating System, Application, and End-user and region. By Operating System, the market is divided into Android and iOS. In terms of Application, the market is classified into Message and Payment. Based on End-user, the market is segmented into Individual and Business. Regionally, the market is classified into North America, Latin America, Western Europe, Eastern Europe, Balkan & Baltic Countries, Russia & Belarus, Central Asia, East Asia, South Asia & Pacific, and the Middle East & Africa.
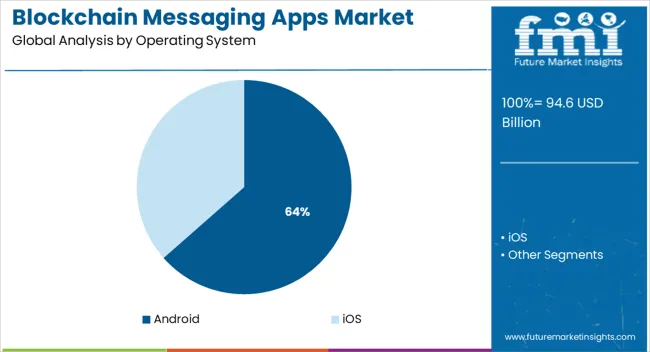
The Android operating system segment is expected to account for 63.50% of the total revenue by 2025, making it the most prominent operating system in the market. This dominance is attributed to the widespread global penetration of Android smartphones, affordability of devices, and strong developer community support.
The flexibility of the platform allows faster integration of blockchain based messaging applications, increasing accessibility across both developed and emerging markets. Additionally, frequent updates and open source adaptability provide developers with greater freedom to innovate.
These advantages have established Android as the preferred choice for blockchain messaging applications.
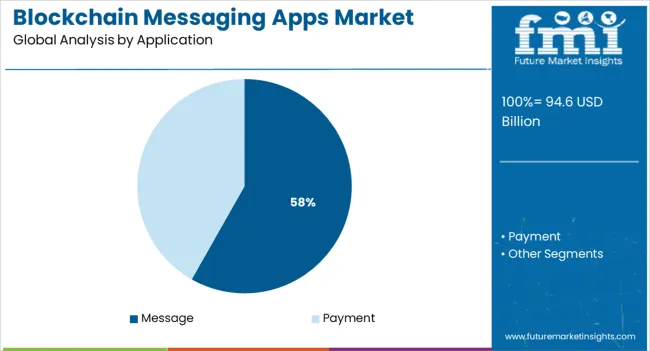
The message application segment is projected to contribute 58.20% of overall revenue by 2025, positioning it as the leading application category. This growth is being driven by increasing demand for secure, end to end encrypted communication and rising concerns over centralized data storage practices.
Blockchain based messaging offers enhanced privacy and transparency, enabling individuals to exchange sensitive information with higher confidence. The growing preference for decentralized networks that eliminate third party interference has further reinforced adoption in this segment.
The ability of blockchain messaging to combine speed, low cost, and secure infrastructure continues to strengthen its dominance in the application category.
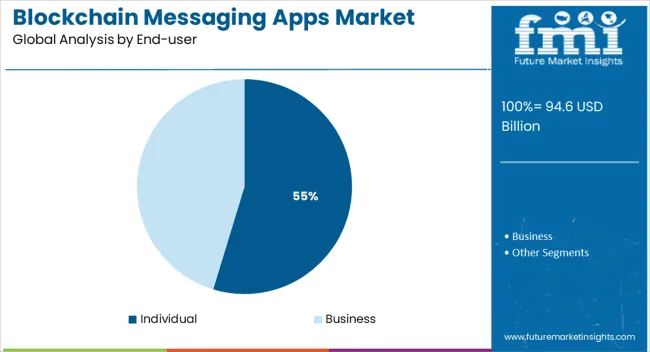
The individual end user segment is expected to hold 54.70% of the total market revenue by 2025, making it the largest contributor within the end user category. This leadership is being fueled by heightened consumer awareness about personal data protection, growing concerns about surveillance, and the increasing adoption of blockchain solutions for daily communication.
Individuals are increasingly seeking platforms that provide anonymity, transparency, and security while retaining ease of use. The rise of peer to peer networks and decentralized identity frameworks is supporting further expansion.
As consumers continue prioritizing privacy and ownership of data, the individual segment is expected to maintain its leading position in driving the blockchain messaging apps market.
Driven by the growth of the global healthcare industry, the blockchain messaging apps market is anticipated to rise at 43.5% CAGR from 2025 to 2035, compared to the 42% CAGR registered from 2020 to 2025.
Due to their decentralized software structure, blockchain messengers are significantly reliable. Transaction processing is distributed between several nodes, so the network is not overloaded. Blockchain technology emphasizes protecting user privacy, since it doesn't rely on centralized servers.
Even if several nodes are hacked, the network won't be wiped out. Blockchain technology may also be secure, since it doesn't use centralized servers. There is no way to save user information or previous messages on corporate servers with blockchain messaging applications. Therefore, blockchain messaging applications are much safer and private than traditional messaging applications.
| Historical CAGR (2020 to 2025) | 42% |
|---|---|
| Historical Market Value (2025) | USD 32.5 billion |
| Forecast CAGR (2025 to 2035) | 43.5% |
Centralized Messaging Applications Lack Privacy-Protection Features
Messenger apps, such as WhatsApp and Facebook Messenger, are widely used messaging and communication tools on the market. There are several centralized messengers, all of which are organized similarly. In addition to owning the messengers, private firms also control the applications.
Businesses are responsible for handling user communications and data storage. Although some centralized messengers claim they do not keep messages on file, others make it quite clear that they do.
The Benefit of the Applications’ Decentralized Nature
The centralized nature of modern messaging applications opens up a wide range of technological problems. Apps like WhatsApp and Facebook Messenger are prone to frequent interruptions and network issues. As a result of the widespread use of a centralized operating system, catastrophic accidents often occur.
It is difficult to maintain the smooth operation of a system that has hundreds of millions of users. An app update, for example, can ruin a corporate messaging system. As the procedure is handled by a central data processing system, the entire network must be continually updated.
Advancement in Technology
Message applications have become more functional due to the development of operating systems and smartphones. Many blockchain messaging applications, like Signal, enable users to send cryptocurrencies to their contacts.
Innovations like this are expected to propel market growth. Furthermore, as the percentage of adult social media users in the USA has increased from 5% in 2005 to 79% in 2020, factors such as the growing number of social media users are also good news for the market's growth.
The growing investments by venture capital firms in the market are further anticipated to offer new growth opportunities for the market. For instance, Minds Inc., a blockchain-based social network, announced in June 2024 that it had raised USD 10 million from the tech freedom organization Futo.
In order to provide control in the hands of users, Minds, Inc. planned to utilize funds for its mission of building one of the leading crypto social networks in the world. Moreover, partnerships and collaborations between the market players and technology companies are also positive indicators of the market's development.
Lack of Skilled Professionals Hinders Market Growth
There has been an increase in cyberattacks and threats among industries as a result of digital transformation. However, organizations do not have skilled professionals to cope with the risk factors. As a result, technologically advanced solutions are being adopted slowly and are expected to negatively impact the market for the next few years.
In addition, developing countries, such as India, Peru, and Mexico, lack awareness of the dangers associated with data protection. Consequently, the adoption of technology is likely to stagnate for a few years.
Operating System Insights:
Based on operating system type, the Android segment has emerged as a leading contributor to growth. The segment is likely to account for over 40% of sales in 2025. A key reason for the growth of Android is its dominance in the mobile operating system world.
For example, according to Business of Apps, an app industry information and media brand, Android is the most popular operating system around the world. It has almost 2.5 million active users in 190 countries. As a result, market players launching blockchain messaging apps like Signal, Secretum, and others now support Android devices, making it possible for Android users to download and use those messaging apps. As a result, the segment's growth is expected to be fueled by the factors outlined above.
Application Insights:
The message segment is expected to surpass the share of over 75% in the year 2025. Blockchain messaging apps are becoming more prevalent across the globe as a way to enhance privacy and security when texts are exchanged.
Nansen, the blockchain analytics platform based in Singapore, announced in June 2025 that it would launch Nansen Connect, a messaging app that runs on Web3. The app includes end-to-end encryption based on blockchain technology for one-to-one messaging
It is expected that the payment segment is likely to grow significantly during the forecast period, due to the increasing popularity of cryptocurrency worldwide. By 2025, TripleA estimates that there are 320 million crypto users worldwide. Furthermore, the increasing launch of payment features in blockchain-based messaging apps should also contribute to the growth of the segment.
Regional Insights:
In 2025, North America is expected to dominate the market, capturing over 28.0% of global revenues. This growth is attributed to prominent market players, such as Dust and Signal, among others. A number of factors contribute to the growth of the market in the region. This includes the legalization of cryptocurrency and the high adoption of blockchain technology.
In addition, market players are increasingly launching apps and partnering with technology companies, which continue to drive regional growth.
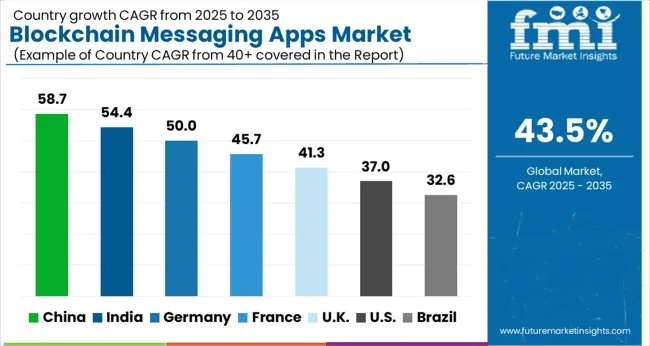
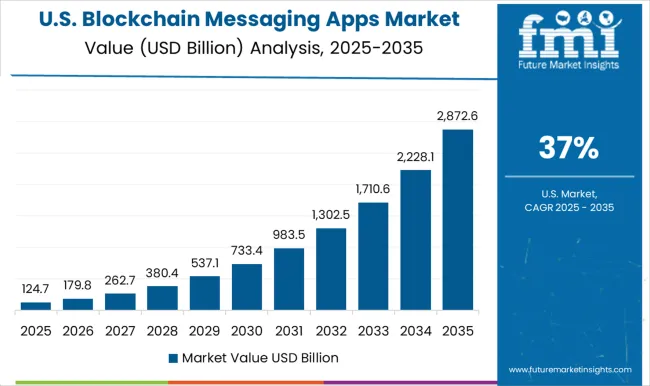
North America is predicted to remain one of the most attractive markets during the forecast period. According to the study, the United States is expected to account for over 74.5% of the North American market through 2035. As a result of increasing interest in blockchain, multiple blockchain development efforts have been launched in the United States in the last few years.
While rivals actively incorporate blockchain, data, and the information ecosystem now, the United States government views blockchain as a "technology of the future". Internet subscription rates were higher among families with greater incomes and households with more education. As a result, blockchain-based applications are becoming popular in the area.
The demand for blockchain messaging apps in the United Kingdom is expected to rise at nearly 35.2% CAGR over the forecast period. The blockchain messaging apps market in the country is evolving steadily as a result of factors. The presence of key market companies is credited with the region's development.
Furthermore, the legalization of cryptocurrencies and the widespread use of blockchain technology bode well for the future of the sector. During the forecast period, market participants are expected to introduce new applications and collaborate with tech firms, which increases regionally.
India is forecast to hold a significant share of the market during the forecast period. This is due to the growing population and increasing smartphone and internet penetration across the countries. This is expected to drive the growth of the regional blockchain messaging apps market.
For example, the Indian government is actively investing in blockchain technology for the development of its digital economy, which is driving the growth of the blockchain messaging apps market in India. Moreover, market players such as Signal have launched applications and provided blockchain messaging apps to individuals within the region.
Despite fierce competition in the blockchain messaging apps market, manufacturers are constantly upgrading their products and coming up with new features to differentiate their products from others. Aside from that, start-ups and companies participate in fundraising activities in order to expand their capacities.
In order to meet the demands of customers and organizations, players are developing a wide variety of distributed ledger solutions. Introducing innovative solutions helps players maintain their competitive edge. Also, an existing product portfolio can be upgraded and expanded to improve a vendor's market position.
Digital ledgers are being advanced by market players to address security issues faced by small and medium-sized businesses. This also gives businesses access to real-time data. It was announced, in April 2024, that Social Technologies LLC was launching the first phase of its decentralized social networking protocol. This was intended to give the users ownership and control over global social networks.
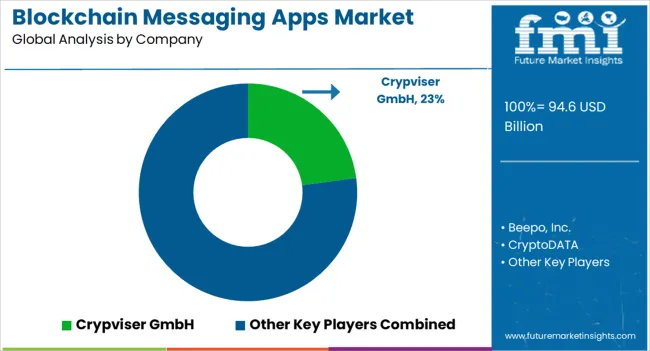
The blockchain messaging apps market is expanding rapidly due to the growing demand for secure, decentralized, and private communication platforms, particularly as concerns over data privacy and cyber threats intensify. Key players in the market include Crypviser GmbH, CryptoDATA, Sappchat, Beepo Inc., Radical App LLC (Cyber Dust / Dust), Wickr Inc., Telegram, and the Solana Foundation, each offering unique solutions built on blockchain technology to enhance privacy and security.
Crypviser GmbH and CryptoDATA provide encrypted messaging services that utilize blockchain to ensure user anonymity and protect communication from interception. Sappchat and Beepo Inc. focus on integrating blockchain for decentralized communication, allowing users to maintain full control over their messages and data.
Radical App LLC (Cyber Dust / Dust) is known for its focus on secure, ephemeral messaging, providing a platform where messages are automatically deleted after being read, with blockchain ensuring data integrity. Wickr Inc. offers end-to-end encryption and privacy features, making it a popular choice among businesses and individuals who prioritize security.
Telegram, while primarily a cloud-based messaging platform, has implemented blockchain technology to enhance privacy features, and Solana Foundation is exploring the integration of blockchain with messaging apps for fast and secure communication.
| Attribute | Details |
|---|---|
| Forecast Period | 2025 to 2035 |
| Historical Data Available for | 2020 to 2025 |
| Market Analysis | USD billion for Value and MT for Volume |
| Key Regions Covered | North America; Latin America; Europe; The Middle East and Africa; East Asia |
| Key Countries Covered | USA, Canada, Brazil, Mexico, Chile, Peru, Germany, UK, Spain, Italy, France, Russia, Poland, China, India, Japan, Australia, New Zealand, GCC Countries, North Africa, South Africa, and Turkey |
| Key Segments Covered | Operating System, Application, End-user, Region |
| Key Companies Profiled | Crypviser GmbH, CryptoDATA, Sappchat, Beepo Inc., Radical App LLC (Cyber Dust / Dust), Wickr Inc., Telegram, Solana Foundation |
| Report Coverage | Market Forecast, Company Share Analysis, Competition Intelligence, DROT Analysis, Market Dynamics and Challenges, and Strategic Growth Initiatives |
| Customization & Pricing | Available upon Request |
The global blockchain messaging apps market is estimated to be valued at USD 94.6 billion in 2025.
The market size for the blockchain messaging apps market is projected to reach USD 3,501.3 billion by 2035.
The blockchain messaging apps market is expected to grow at a 43.5% CAGR between 2025 and 2035.
The key product types in blockchain messaging apps market are android and ios.
In terms of application, message segment to command 58.2% share in the blockchain messaging apps market in 2025.


Our Research Products

The "Full Research Suite" delivers actionable market intel, deep dives on markets or technologies, so clients act faster, cut risk, and unlock growth.

The Leaderboard benchmarks and ranks top vendors, classifying them as Established Leaders, Leading Challengers, or Disruptors & Challengers.

Locates where complements amplify value and substitutes erode it, forecasting net impact by horizon

We deliver granular, decision-grade intel: market sizing, 5-year forecasts, pricing, adoption, usage, revenue, and operational KPIs—plus competitor tracking, regulation, and value chains—across 60 countries broadly.

Spot the shifts before they hit your P&L. We track inflection points, adoption curves, pricing moves, and ecosystem plays to show where demand is heading, why it is changing, and what to do next across high-growth markets and disruptive tech

Real-time reads of user behavior. We track shifting priorities, perceptions of today’s and next-gen services, and provider experience, then pace how fast tech moves from trial to adoption, blending buyer, consumer, and channel inputs with social signals (#WhySwitch, #UX).

Partner with our analyst team to build a custom report designed around your business priorities. From analysing market trends to assessing competitors or crafting bespoke datasets, we tailor insights to your needs.
Supplier Intelligence
Discovery & Profiling
Capacity & Footprint
Performance & Risk
Compliance & Governance
Commercial Readiness
Who Supplies Whom
Scorecards & Shortlists
Playbooks & Docs
Category Intelligence
Definition & Scope
Demand & Use Cases
Cost Drivers
Market Structure
Supply Chain Map
Trade & Policy
Operating Norms
Deliverables
Buyer Intelligence
Account Basics
Spend & Scope
Procurement Model
Vendor Requirements
Terms & Policies
Entry Strategy
Pain Points & Triggers
Outputs
Pricing Analysis
Benchmarks
Trends
Should-Cost
Indexation
Landed Cost
Commercial Terms
Deliverables
Brand Analysis
Positioning & Value Prop
Share & Presence
Customer Evidence
Go-to-Market
Digital & Reputation
Compliance & Trust
KPIs & Gaps
Outputs
Full Research Suite comprises of:
Market outlook & trends analysis
Interviews & case studies
Strategic recommendations
Vendor profiles & capabilities analysis
5-year forecasts
8 regions and 60+ country-level data splits
Market segment data splits
12 months of continuous data updates
DELIVERED AS:
PDF EXCEL ONLINE
Blockchain Interoperability Market Size and Share Forecast Outlook 2025 to 2035
Blockchain Food Traceability Market Size and Share Forecast Outlook 2025 to 2035
Blockchain AI Market Size and Share Forecast Outlook 2025 to 2035
Blockchain in Logistics Market Size and Share Forecast Outlook 2025 to 2035
Blockchain Market Size and Share Forecast Outlook 2025 to 2035
Blockchain in Energy Market Size and Share Forecast Outlook 2025 to 2035
Blockchain Identity Management Market Size and Share Forecast Outlook 2025 to 2035
Blockchain in Agriculture and Food Supply Chain Market Size and Share Forecast Outlook 2025 to 2035
Blockchain Technology Market Analysis & Forecast 2025 to 2035, By Solution, Use Case, Enterprise Size, Industry, and Region
Blockchain in Banking Market
Blockchain in Agriculture Market Analysis – Size, Share & Forecast 2024-2034
Managed Blockchain Services Market Size and Share Forecast Outlook 2025 to 2035
Web 3.0 Blockchain Market Report – Growth, Demand & Forecast 2024-2034
Automotive Blockchain Market Size and Share Forecast Outlook 2025 to 2035
A2P Messaging Market Size and Share Forecast Outlook 2025 to 2035
Web3 Messaging Tools Market Report - Growth & Forecast 2025 to 2035
Mobile Messaging Market Size and Share Forecast Outlook 2025 to 2035
Omni Channel Messaging Software Market Size and Share Forecast Outlook 2025 to 2035
HIPAA-Compliant Messaging Services Market
A2P & P2A Messaging – AI-Driven Communication & Security

Thank you!
You will receive an email from our Business Development Manager. Please be sure to check your SPAM/JUNK folder too.
Chat With
MaRIA