Blockchain Interoperability Market Size and Share Forecast Outlook From 2025 to 2035

The Blockchain Interoperability Market is estimated to be valued at USD 332.8 million in 2025 and is projected to reach USD 1832.3 million by 2035, registering a compound annual growth rate (CAGR) of 18.6% over the forecast period.

The blockchain interoperability market is witnessing significant expansion, driven by the growing demand for cross-network communication and asset transfer capabilities across decentralized ecosystems. Increasing adoption of multiple blockchain platforms in finance, supply chain, and digital identity management has emphasized the need for seamless interoperability.

The market is benefiting from the proliferation of decentralized applications (dApps) and smart contract-based ecosystems, where interoperability solutions enhance efficiency, reduce latency, and mitigate data silos. Technological advancements in protocol design and the emergence of multi-chain frameworks have further strengthened integration potential.

Regulatory developments encouraging transparency and cross-border digital asset transactions are also contributing to market maturity. Looking ahead, rising institutional adoption of blockchain infrastructure and the growing complexity of multi-chain networks are expected to sustain growth, positioning interoperability as a foundational enabler for the next phase of blockchain scalability and collaboration..
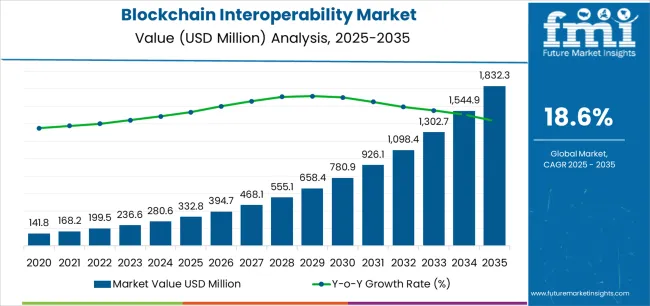
Quick Stats for Blockchain Interoperability Market

  • Blockchain Interoperability Market Industry Value (2025): USD 332.8 million
  • Blockchain Interoperability Market Forecast Value (2035): USD 1832.3 million
  • Blockchain Interoperability Market Forecast CAGR: 18.6%
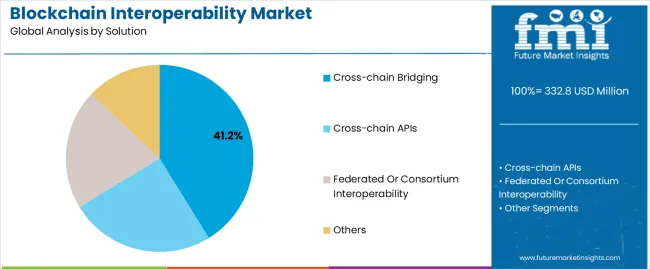
  • Leading Segment in Blockchain Interoperability Market in 2025: Cross-chain Bridging (41.2%)
  • Key Growth Region in Blockchain Interoperability Market: North America, Asia-Pacific, Europe
  • Top Key Players in Blockchain Interoperability Market: Oracle Corporation, R3, LeewayHertz, Ontology, INERY PTE. LTD., Datachain, Inc., Quant Network Limited, Band Protocol, LiquidApps, Orb Labs

Blockchain Interoperability Market Market Value Analysis

Metric Value
Blockchain Interoperability Market Estimated Value in (2025 E) USD 332.8 million
Blockchain Interoperability Market Forecast Value in (2035 F) USD 1832.3 million
Forecast CAGR (2025 to 2035) 18.6%

Segmental Analysis

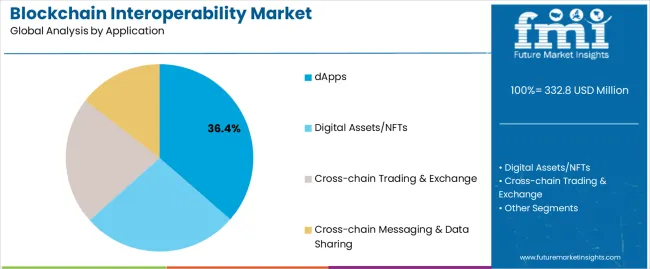
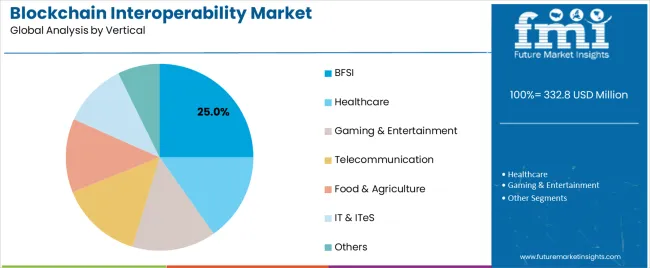
The market is segmented by Solution, Application, and Vertical and region. By Solution, the market is divided into Cross-chain Bridging, Cross-chain APIs, Federated Or Consortium Interoperability, and Others. In terms of Application, the market is classified into dApps, Digital Assets/NFTs, Cross-chain Trading & Exchange, and Cross-chain Messaging & Data Sharing. Based on Vertical, the market is segmented into BFSI, Healthcare, Gaming & Entertainment, Telecommunication, Food & Agriculture, IT & ITeS, and Others. Regionally, the market is classified into North America, Latin America, Western Europe, Eastern Europe, Balkan & Baltic Countries, Russia & Belarus, Central Asia, East Asia, South Asia & Pacific, and the Middle East & Africa.
Insights into the Cross-Chain Bridging Segment

Blockchain Interoperability Market Analysis By Solution

The cross-chain bridging segment dominates the solution category with approximately 41.20% share, reflecting its essential role in facilitating asset transfers and data exchange between distinct blockchain networks. This solution allows decentralized ecosystems to operate cohesively, improving liquidity flow and enabling multi-platform interoperability.

Its adoption has been accelerated by the expansion of decentralized finance (DeFi) applications, where users demand cross-network access without intermediaries. The segment’s growth is reinforced by ongoing innovations in bridge security and efficiency, addressing vulnerabilities associated with early-generation protocols.

Institutional blockchain projects are increasingly integrating bridging solutions to streamline asset management across public and private chains. With interoperability becoming central to blockchain scalability, the cross-chain bridging segment is expected to maintain its dominance through continued technical refinement and integration into multi-chain infrastructures..
Insights into the dApps Segment

Blockchain Interoperability Market Analysis By Application

The dApps segment leads the application category with approximately 36.40% share, driven by the growing need for seamless connectivity across decentralized platforms. Blockchain interoperability enhances the operational capabilities of dApps by enabling them to access data and resources from multiple chains simultaneously.

This functionality expands use cases in gaming, decentralized exchanges, and digital identity, creating richer and more efficient ecosystems. The segment benefits from developer initiatives to design interoperable frameworks that improve scalability and transaction speed.

Increased venture capital investment in cross-chain development projects has also supported adoption. As multi-chain dApp ecosystems mature and demand for fluid data exchange intensifies, the dApps segment is expected to continue leading the application landscape in blockchain interoperability..
Insights into the BFSI Segment

Blockchain Interoperability Market Analysis By Vertical

The BFSI segment holds approximately 25.00% share within the vertical category, underscoring its pivotal role in early adoption of interoperability solutions. Financial institutions are leveraging cross-chain frameworks to improve settlement efficiency, reduce transaction costs, and facilitate digital asset interoperability across networks.

The segment benefits from regulatory support for secure digital ledger integration and the growing adoption of tokenized assets in cross-border payments. Interoperability enhances transparency, enabling real-time reconciliation across diverse financial systems.

Strategic collaborations between blockchain firms and traditional banks have further accelerated deployment. With the sector’s focus on secure and efficient digital transaction infrastructure, the BFSI segment is expected to remain a key driver of blockchain interoperability adoption..

Sales Trend Analysis from 2020 to 2024 Compared to Market Outlook for 2025 to 2035

The global demand for the blockchain interoperability market was estimated to reach a valuation of USD 141.8 million in 2020, according to a report from Future Market Insights. From 2020 to 2025, sales witnessed significant growth in the blockchain interoperability market, registering a stellar CAGR of 31%.

Historical CAGR from 2020 to 2025 31%
Forecast CAGR from 2025 to 2035 27.5%

The market for blockchain interoperability is driven by the growing need for decentralized exchanges (DEXs) and cross-chain asset swaps. Consumers who manage digital assets across many blockchain networks look for autonomy and liquidity. The creation of interoperability solutions, which enable smooth asset movement and exchange between various platforms, is fueled by this need.

Some important factors that will boost the market growth through 2035 are:

  • Decentralized finance (DeFi) applications are becoming more and more popular, which will increase the need for interoperable solutions to facilitate smooth asset transfers between various networks.
  • The emergence of blockchain alliances and consortiums will promote standardization and cooperation, accelerating the development of interoperability.
  • Cross-chain functionality will be improved by developments in interoperability protocols and technology, increasing the effectiveness and scalability of interoperability.
  • Regulatory clarity and support will foster interoperability innovation as well as adoption, attracting investment and development to the global market.

Key Growth Drivers for the Blockchain Interoperability Market

Rising Popularity of DeFi Apps to boost Demand

The market for blockchain interoperability is being driven in part by the growing popularity of decentralized financial (DeFi) applications. Interoperability solutions are becoming more and more necessary as DeFi gains popularity in order to facilitate asset transfers and smooth communication between various blockchain networks.

DeFi protocols require interoperability in order to access a wider variety of assets and liquidity pools. This promotes the growth of the blockchain interoperability market and allows for the development of novel financial services.

Growth of Blockchain Alliances and Consortiums to bolster demand Globally

The growth of blockchain alliances and consortiums is a major factor propelling the market for blockchain interoperability. To create interoperability standards, protocols, and solutions, these cooperative projects bring together industry players, including businesses, startups, and technology suppliers.

Blockchain consortiums promote the adoption of interoperable solutions and drive market growth by promoting collaboration and shared innovation. They also promote best practices and information sharing, which advances the creation and application of blockchain interoperability technology.

Factors Restraining the Growth of the Blockchain Interoperability Market

Regulatory Uncertainties and Scalability Issues to Impede the Market Growth

Interoperability attempts may be hampered by adoption difficulties brought forth by conflicting standards and unclear regulations. Technical difficulties including security flaws and scalability problems might impede the creation and application of interoperable solutions.

Cooperation across diverse blockchain networks and stakeholders is necessary for interoperability, which may provide governance and coordination issues. Effectively overcoming these challenges is essential to guaranteeing the market for blockchain interoperability continues to expand.

Blockchain Interoperability Industry Analysis by Top Investment Segments

This section focuses on providing detailed analysis of two particular market segments for blockchain interoperability, the dominant solution type and the significant application type. The two main segments discussed below are cross-chain bridging and dApps.

Cross-chain Bridging Solution is anticipated to boost the Market Share during Forecast Period

Solution Cross-chain Bridging
CAGR from 2025 to 2035 27.3%

During the forecast period, the cross-chain bridging segment is likely to garner a 27.3% CAGR. Since cross-chain bridging may resolve interoperability issues across different blockchain networks, it is the best option available globally.

Through the smooth movement of assets and communication across chains, cross-chain bridging improves the functionality, accessibility, and liquidity of the blockchain ecosystem.

By encouraging cooperation and integration amongst many platforms, this approach opens up new possibilities for supply chain management, decentralized finance, and other applications. Cross-chain bridging is becoming an increasingly important means of enabling blockchain interoperability as the need for cross-chain functionality increases.

By Application, dApps is likely to Dominate the global Market

Application dApps
Market Share in 2025 50.9%

In 2025, the dApps segment is likely to acquire a 52.3% global market share. The inherent benefits of decentralized apps (dApps) will likely cause them to dominate the market. They support the principles of blockchain technology by providing transparency, immutability, and resistance to censorship. Decentralized applications (dApps) remove middlemen, saving money and improving productivity.

dApps make it possible for transactions to be automated and trustless with programmable smart contracts. dApps are becoming the go-to option for a wide range of applications, from supply chain management to finance, as the need for decentralized solutions increases. This is propelling dApps' dominance in the market by application type.

Analysis of Top Regions Advancing Blockchain Interoperability Solutions

The markets for blockchain interoperability in a few significant countries, including the United States, the United Kingdom, China, Japan, and South Korea, will be covered in detail in this section. This section will concentrate on the major variables that are increasing the demand in these nations for blockchain interoperability.

Countries Forecast CAGR from 2025 to 2035
The United States 27.7%
The United Kingdom 29%
China 28%
Japan 28.2%
South Korea 29.2%

Diverse Blockchain Ecosystem in the United States to Enhance Demand

The United States blockchain interoperability landscape is anticipated to gain a CAGR of 27.7% through 2035. The United States has a diversified blockchain atmosphere, with tech-heavy areas like Austin, New York City, as well as San Francisco serving as innovation hotspots.

This dynamic ecosystem encourages investment, cooperation, and entrepreneurship, which propels the creation of revolutionary blockchain solutions across a range of sectors.

Numerous regulatory agencies oversee the complicated regulatory environment in the United States around cryptocurrencies and blockchain technology. While this complexity presents issues, it also provides opportunity for regulatory clarity and innovation as authorities strive to find a balance between promoting innovation and safeguarding consumers.

Academic Excellence in Blockchain in the United Kingdom to Propel Demand

The market in the United Kingdom is expected to expand with a 29% CAGR through 2035. The United Kingdom is positioning itself as a centre of regulatory innovation for companies involved in blockchain and cryptocurrencies.

The United Kingdom offers a favorable regulatory framework for blockchain enterprises to flourish and evolve, including programs like the Financial Conduct Authority's (FCA) regulatory sandbox, which enables entrepreneurs to test novel products in a supervised setting.

The country has a long history of being a leader in blockchain and distributed ledger technology (DLT) academia. Prominent academic institutions like Imperial College London and the University of Cambridge aggressively pursue blockchain research and work with business partners to spur innovation.

This academic environment promotes a vibrant flow of knowledge and skills, strengthening the United Kingdom's standing as a leading hub for blockchain innovation and knowledge globally.

Emerging Blockchain Applications in China to Spur Growth

The blockchain interoperability ecosystem in China is anticipated to develop with a 28% CAGR from 2025 to 2035. China leads in blockchain infrastructure, accounting for a sizable portion of the global blockchain patents and hosting several of the major blockchain platforms and mining activities. Due to its advanced technology and extensive internet connectivity, the nation is well-positioned to develop and use blockchain technology on a large scale.

China is seeing a rise in innovative blockchain applications, especially in the domains of government services, digital identification, and supply chain management.

Companies and governmental organizations are using blockchain technology to increase efficiency, traceability, and transparency across a range of industries, demonstrating the creative approach of China to the adoption and application of blockchain technology.

Regulatory Support and Clarity in Japan to Bolster Demand

The blockchain interoperability industry in Japan is anticipated to reach a 28.2% CAGR from 2025 to 2035. Japan has developed precise legislation pertaining to blockchain technology and cryptocurrencies, giving investors and companies’ confidence. The encouraging outlook encourages investment and creativity in blockchain initiatives, which helps the sector expand.

The robust history of industry-academia partnership in Japan fosters innovation in blockchain technology. In order to develop innovative blockchain solutions, universities and research centers collaborate closely with companies, making use of the abundant talent and knowledge base of the region.

Robust Technological Infrastructure and Skilled Workforce in South Korea to Enhance Demand

The blockchain interoperability ecosystem in South Korea is likely to evolve with a 29.2% CAGR during the forecast period. The government of South Korea actively supports blockchain projects by providing financing and providing clear regulations, creating an atmosphere that encourages innovation.

Blockchain technology has been adopted by South Korean industries including banking and gambling, which has accelerated the integration of technology into other applications and market development.

With its highly qualified workforce and innovative technological infrastructure, South Korea offers a strong platform for the development and implementation of blockchain solutions. This strong infrastructure helps blockchain firms flourish and makes it easier to deploy blockchain ideas in a variety of sectors.
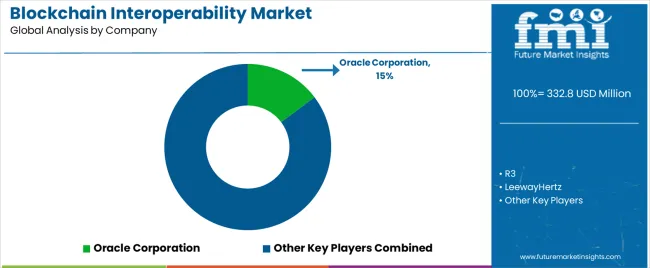
Leading Suppliers in the Blockchain Interoperability Sector

Blockchain Interoperability Market Analysis By Company

Companies in the global market for blockchain interoperability are developing technologies to connect various blockchain networks and facilitate asset transfers and smooth communication between them.

They concentrate on developing middleware, decentralized exchanges, and interoperability protocols that enable data sharing, smart contract execution, and cross-chain transactions.

These companies seek to solve issues with interoperability, security, and scalability in order to promote the broad use of blockchain technology. Through facilitating interoperability, they open up new avenues for decentralized finance, identity verification, supply chain management, and other applications, spurring efficiency and creativity across a range of sectors globally. The key players in this market include:

  • Oracle Corporation
  • R3
  • LeewayHertz
  • Ontology
  • INERY PTE. LTD.
  • Datachain, Inc.
  • Quant Network Limited
  • Band protocol
  • LiquidApps
  • Orb Labs

Significant advancements in the blockchain interoperability market are being made by key market participants, and these include:

  • In 2025, Oracle announced the launch of the first hyperscale cloud region in Colombia. The data center could supply businesses with access to a variety of cloud services through a partnership with Claro, which can aid in the modernization of their applications.
  • They may also transfer mission-critical workloads from their data centers to Oracle Cloud Infrastructure (OCI) and go on innovating with data and analytics.

Scope and Coverage of the Blockchain Interoperability Market Report

Report Attribute Details
Growth Rate CAGR of 27.5% from 2025 to 2035
Market value in 2025 USD 261 million
Market value in 2035 USD 3 billion
Base Year for Estimation 2025
Historical Data 2020 to 2025
Forecast Period 2025 to 2035
Quantitative Units USD billion for value
Report Coverage Revenue Forecast, Company Ranking, Competitive Landscape, Growth Factors, Trends, and Pricing Analysis
Segments Covered Solution, Application, Vertical, Region
Regions Covered North America; Latin America; Western Europe; Eastern Europe; South Asia and Pacific; East Asia; The Middle East & Africa
Countries Profiled United States, Canada, Brazil, Mexico, Germany, United Kingdom, France, Spain, Italy, Poland, Russia, Czech Republic, Romania, India, Bangladesh, Australia, New Zealand, China, Japan, South Korea, GCC Countries, South Africa, Israel
Key Companies Profiled Oracle Corporation; R3; LeewayHertz; Ontology; INERY PTE. LTD.; Datachain Inc.; Quant Network Limited; Band protocol; LiquidApps; Orb Labs
Customization Scope Available on Request

Top Segments Studied in the Blockchain Interoperability Market

By Solution:

  • Cross-chain Bridging
  • Cross-chain APIs
  • Federated or Consortium Interoperability
  • Others

By Application:

  • dApps
  • Digital Assets/NFTs
  • Cross-chain Trading & Exchange
  • Cross-chain Messaging & Data Sharing

By Vertical:

  • BFSI
  • Healthcare
  • Gaming & Entertainment
  • Telecommunication
  • Food & Agriculture
  • IT & ITeS
  • Others

By Region:

  • North America
  • Latin America
  • Western Europe
  • Eastern Europe
  • South Asia and Pacific
  • East Asia
  • Middle East & Africa

Frequently Asked Questions

How big is the blockchain interoperability market in 2025?

The global blockchain interoperability market is estimated to be valued at USD 332.8 million in 2025.

What will be the size of blockchain interoperability market in 2035?

The market size for the blockchain interoperability market is projected to reach USD 1,832.3 million by 2035.

How much will be the blockchain interoperability market growth between 2025 and 2035?

The blockchain interoperability market is expected to grow at a 18.6% CAGR between 2025 and 2035.

What are the key product types in the blockchain interoperability market?

The key product types in blockchain interoperability market are cross-chain bridging, cross-chain apis, federated or consortium interoperability and others.

Which application segment to contribute significant share in the blockchain interoperability market in 2025?

In terms of application, dapps segment to command 36.4% share in the blockchain interoperability market in 2025.

Table of Content

  1. Executive Summary
    • Global Market Outlook
    • Demand-side Trends
    • Supply-side Trends
    • Technology Roadmap Analysis
    • Analysis and Recommendations
  2. Market Overview
    • Market Coverage / Taxonomy
    • Market Definition / Scope / Limitations
  3. Market Background
    • Market Dynamics
      • Drivers
      • Restraints
      • Opportunity
      • Trends
    • Scenario Forecast
      • Demand in Optimistic Scenario
      • Demand in Likely Scenario
      • Demand in Conservative Scenario
    • Opportunity Map Analysis
    • Product Life Cycle Analysis
    • Supply Chain Analysis
    • Investment Feasibility Matrix
    • Value Chain Analysis
    • PESTLE and Porter’s Analysis
    • Regulatory Landscape
    • Regional Parent Market Outlook
    • Production and Consumption Statistics
    • Import and Export Statistics
  4. Global Market Analysis 2020-2024 and Forecast, 2025-2035
    • Historical Market Size Value (USD Million) Analysis, 2020-2024
    • Current and Future Market Size Value (USD Million) Projections, 2025-2035
      • Y-o-Y Growth Trend Analysis
      • Absolute $ Opportunity Analysis
  5. Global Market Pricing Analysis 2020-2024 and Forecast 2025-2035
  6. Global Market Analysis 2020-2024 and Forecast 2025-2035, By Solution
    • Introduction / Key Findings
    • Historical Market Size Value (USD Million) Analysis By Solution , 2020-2024
    • Current and Future Market Size Value (USD Million) Analysis and Forecast By Solution , 2025-2035
      • Cross-chain Bridging
      • Cross-chain APIs
      • Federated Or Consortium Interoperability
      • Others
    • Y-o-Y Growth Trend Analysis By Solution , 2020-2024
    • Absolute $ Opportunity Analysis By Solution , 2025-2035
  7. Global Market Analysis 2020-2024 and Forecast 2025-2035, By Application
    • Introduction / Key Findings
    • Historical Market Size Value (USD Million) Analysis By Application, 2020-2024
    • Current and Future Market Size Value (USD Million) Analysis and Forecast By Application, 2025-2035
      • dApps
      • Digital Assets/NFTs
      • Cross-chain Trading & Exchange
      • Cross-chain Messaging & Data Sharing
    • Y-o-Y Growth Trend Analysis By Application, 2020-2024
    • Absolute $ Opportunity Analysis By Application, 2025-2035
  8. Global Market Analysis 2020-2024 and Forecast 2025-2035, By Vertical
    • Introduction / Key Findings
    • Historical Market Size Value (USD Million) Analysis By Vertical, 2020-2024
    • Current and Future Market Size Value (USD Million) Analysis and Forecast By Vertical, 2025-2035
      • BFSI
      • Healthcare
      • Gaming & Entertainment
      • Telecommunication
      • Food & Agriculture
      • IT & ITeS
      • Others
    • Y-o-Y Growth Trend Analysis By Vertical, 2020-2024
    • Absolute $ Opportunity Analysis By Vertical, 2025-2035
  9. Global Market Analysis 2020-2024 and Forecast 2025-2035, By Region
    • Introduction
    • Historical Market Size Value (USD Million) Analysis By Region, 2020-2024
    • Current Market Size Value (USD Million) Analysis and Forecast By Region, 2025-2035
      • North America
      • Latin America
      • Western Europe
      • Eastern Europe
      • East Asia
      • South Asia and Pacific
      • Middle East & Africa
    • Market Attractiveness Analysis By Region
  10. North America Market Analysis 2020-2024 and Forecast 2025-2035, By Country
    • Historical Market Size Value (USD Million) Trend Analysis By Market Taxonomy, 2020-2024
    • Market Size Value (USD Million) Forecast By Market Taxonomy, 2025-2035
      • By Country
        • USA
        • Canada
        • Mexico
      • By Solution
      • By Application
      • By Vertical
    • Market Attractiveness Analysis
      • By Country
      • By Solution
      • By Application
      • By Vertical
    • Key Takeaways
  11. Latin America Market Analysis 2020-2024 and Forecast 2025-2035, By Country
    • Historical Market Size Value (USD Million) Trend Analysis By Market Taxonomy, 2020-2024
    • Market Size Value (USD Million) Forecast By Market Taxonomy, 2025-2035
      • By Country
        • Brazil
        • Chile
        • Rest of Latin America
      • By Solution
      • By Application
      • By Vertical
    • Market Attractiveness Analysis
      • By Country
      • By Solution
      • By Application
      • By Vertical
    • Key Takeaways
  12. Western Europe Market Analysis 2020-2024 and Forecast 2025-2035, By Country
    • Historical Market Size Value (USD Million) Trend Analysis By Market Taxonomy, 2020-2024
    • Market Size Value (USD Million) Forecast By Market Taxonomy, 2025-2035
      • By Country
        • Germany
        • UK
        • Italy
        • Spain
        • France
        • Nordic
        • BENELUX
        • Rest of Western Europe
      • By Solution
      • By Application
      • By Vertical
    • Market Attractiveness Analysis
      • By Country
      • By Solution
      • By Application
      • By Vertical
    • Key Takeaways
  13. Eastern Europe Market Analysis 2020-2024 and Forecast 2025-2035, By Country
    • Historical Market Size Value (USD Million) Trend Analysis By Market Taxonomy, 2020-2024
    • Market Size Value (USD Million) Forecast By Market Taxonomy, 2025-2035
      • By Country
        • Russia
        • Poland
        • Hungary
        • Balkan & Baltic
        • Rest of Eastern Europe
      • By Solution
      • By Application
      • By Vertical
    • Market Attractiveness Analysis
      • By Country
      • By Solution
      • By Application
      • By Vertical
    • Key Takeaways
  14. East Asia Market Analysis 2020-2024 and Forecast 2025-2035, By Country
    • Historical Market Size Value (USD Million) Trend Analysis By Market Taxonomy, 2020-2024
    • Market Size Value (USD Million) Forecast By Market Taxonomy, 2025-2035
      • By Country
        • China
        • Japan
        • South Korea
      • By Solution
      • By Application
      • By Vertical
    • Market Attractiveness Analysis
      • By Country
      • By Solution
      • By Application
      • By Vertical
    • Key Takeaways
  15. South Asia and Pacific Market Analysis 2020-2024 and Forecast 2025-2035, By Country
    • Historical Market Size Value (USD Million) Trend Analysis By Market Taxonomy, 2020-2024
    • Market Size Value (USD Million) Forecast By Market Taxonomy, 2025-2035
      • By Country
        • India
        • ASEAN
        • Australia & New Zealand
        • Rest of South Asia and Pacific
      • By Solution
      • By Application
      • By Vertical
    • Market Attractiveness Analysis
      • By Country
      • By Solution
      • By Application
      • By Vertical
    • Key Takeaways
  16. Middle East & Africa Market Analysis 2020-2024 and Forecast 2025-2035, By Country
    • Historical Market Size Value (USD Million) Trend Analysis By Market Taxonomy, 2020-2024
    • Market Size Value (USD Million) Forecast By Market Taxonomy, 2025-2035
      • By Country
        • Kingdom of Saudi Arabia
        • Other GCC Countries
        • Turkiye
        • South Africa
        • Other African Union
        • Rest of Middle East & Africa
      • By Solution
      • By Application
      • By Vertical
    • Market Attractiveness Analysis
      • By Country
      • By Solution
      • By Application
      • By Vertical
    • Key Takeaways
  17. Key Countries Market Analysis
    • USA
      • Pricing Analysis
      • Market Share Analysis, 2024
        • By Solution
        • By Application
        • By Vertical
    • Canada
      • Pricing Analysis
      • Market Share Analysis, 2024
        • By Solution
        • By Application
        • By Vertical
    • Mexico
      • Pricing Analysis
      • Market Share Analysis, 2024
        • By Solution
        • By Application
        • By Vertical
    • Brazil
      • Pricing Analysis
      • Market Share Analysis, 2024
        • By Solution
        • By Application
        • By Vertical
    • Chile
      • Pricing Analysis
      • Market Share Analysis, 2024
        • By Solution
        • By Application
        • By Vertical
    • Germany
      • Pricing Analysis
      • Market Share Analysis, 2024
        • By Solution
        • By Application
        • By Vertical
    • UK
      • Pricing Analysis
      • Market Share Analysis, 2024
        • By Solution
        • By Application
        • By Vertical
    • Italy
      • Pricing Analysis
      • Market Share Analysis, 2024
        • By Solution
        • By Application
        • By Vertical
    • Spain
      • Pricing Analysis
      • Market Share Analysis, 2024
        • By Solution
        • By Application
        • By Vertical
    • France
      • Pricing Analysis
      • Market Share Analysis, 2024
        • By Solution
        • By Application
        • By Vertical
    • India
      • Pricing Analysis
      • Market Share Analysis, 2024
        • By Solution
        • By Application
        • By Vertical
    • ASEAN
      • Pricing Analysis
      • Market Share Analysis, 2024
        • By Solution
        • By Application
        • By Vertical
    • Australia & New Zealand
      • Pricing Analysis
      • Market Share Analysis, 2024
        • By Solution
        • By Application
        • By Vertical
    • China
      • Pricing Analysis
      • Market Share Analysis, 2024
        • By Solution
        • By Application
        • By Vertical
    • Japan
      • Pricing Analysis
      • Market Share Analysis, 2024
        • By Solution
        • By Application
        • By Vertical
    • South Korea
      • Pricing Analysis
      • Market Share Analysis, 2024
        • By Solution
        • By Application
        • By Vertical
    • Russia
      • Pricing Analysis
      • Market Share Analysis, 2024
        • By Solution
        • By Application
        • By Vertical
    • Poland
      • Pricing Analysis
      • Market Share Analysis, 2024
        • By Solution
        • By Application
        • By Vertical
    • Hungary
      • Pricing Analysis
      • Market Share Analysis, 2024
        • By Solution
        • By Application
        • By Vertical
    • Kingdom of Saudi Arabia
      • Pricing Analysis
      • Market Share Analysis, 2024
        • By Solution
        • By Application
        • By Vertical
    • Turkiye
      • Pricing Analysis
      • Market Share Analysis, 2024
        • By Solution
        • By Application
        • By Vertical
    • South Africa
      • Pricing Analysis
      • Market Share Analysis, 2024
        • By Solution
        • By Application
        • By Vertical
  18. Market Structure Analysis
    • Competition Dashboard
    • Competition Benchmarking
    • Market Share Analysis of Top Players
      • By Regional
      • By Solution
      • By Application
      • By Vertical
  19. Competition Analysis
    • Competition Deep Dive
      • Oracle Corporation
        • Overview
        • Product Portfolio
        • Profitability by Market Segments (Product/Age /Sales Channel/Region)
        • Sales Footprint
        • Strategy Overview
          • Marketing Strategy
          • Product Strategy
          • Channel Strategy
      • R3
      • LeewayHertz
      • Ontology
      • INERY PTE. LTD.
      • Datachain, Inc.
      • Quant Network Limited
      • Band Protocol
      • LiquidApps
      • Orb Labs
  20. Assumptions & Acronyms Used
  21. Research Methodology

List of Tables

  • Table 1: Global Market Value (USD Mn) Forecast by Region, 2020-2035
  • Table 2: Global Market Value (USD Mn) Forecast by Solution , 2020-2035
  • Table 3: Global Market Value (USD Mn) Forecast by Application, 2020-2035
  • Table 4: Global Market Value (USD Mn) Forecast by Vertical, 2020-2035
  • Table 5: North America Market Value (USD Mn) Forecast by Country, 2020-2035
  • Table 6: North America Market Value (USD Mn) Forecast by Solution , 2020-2035
  • Table 7: North America Market Value (USD Mn) Forecast by Application, 2020-2035
  • Table 8: North America Market Value (USD Mn) Forecast by Vertical, 2020-2035
  • Table 9: Latin America Market Value (USD Mn) Forecast by Country, 2020-2035
  • Table 10: Latin America Market Value (USD Mn) Forecast by Solution , 2020-2035
  • Table 11: Latin America Market Value (USD Mn) Forecast by Application, 2020-2035
  • Table 12: Latin America Market Value (USD Mn) Forecast by Vertical, 2020-2035
  • Table 13: Western Europe Market Value (USD Mn) Forecast by Country, 2020-2035
  • Table 14: Western Europe Market Value (USD Mn) Forecast by Solution , 2020-2035
  • Table 15: Western Europe Market Value (USD Mn) Forecast by Application, 2020-2035
  • Table 16: Western Europe Market Value (USD Mn) Forecast by Vertical, 2020-2035
  • Table 17: Eastern Europe Market Value (USD Mn) Forecast by Country, 2020-2035
  • Table 18: Eastern Europe Market Value (USD Mn) Forecast by Solution , 2020-2035
  • Table 19: Eastern Europe Market Value (USD Mn) Forecast by Application, 2020-2035
  • Table 20: Eastern Europe Market Value (USD Mn) Forecast by Vertical, 2020-2035
  • Table 21: East Asia Market Value (USD Mn) Forecast by Country, 2020-2035
  • Table 22: East Asia Market Value (USD Mn) Forecast by Solution , 2020-2035
  • Table 23: East Asia Market Value (USD Mn) Forecast by Application, 2020-2035
  • Table 24: East Asia Market Value (USD Mn) Forecast by Vertical, 2020-2035
  • Table 25: South Asia and Pacific Market Value (USD Mn) Forecast by Country, 2020-2035
  • Table 26: South Asia and Pacific Market Value (USD Mn) Forecast by Solution , 2020-2035
  • Table 27: South Asia and Pacific Market Value (USD Mn) Forecast by Application, 2020-2035
  • Table 28: South Asia and Pacific Market Value (USD Mn) Forecast by Vertical, 2020-2035
  • Table 29: Middle East & Africa Market Value (USD Mn) Forecast by Country, 2020-2035
  • Table 30: Middle East & Africa Market Value (USD Mn) Forecast by Solution , 2020-2035
  • Table 31: Middle East & Africa Market Value (USD Mn) Forecast by Application, 2020-2035
  • Table 32: Middle East & Africa Market Value (USD Mn) Forecast by Vertical, 2020-2035

List of Figures

  • Figure 1: Global Market Pricing Analysis
  • Figure 2: Global Market Value (USD Million) Forecast 2020-2035
  • Figure 3: Global Market Value Share and BPS Analysis by Solution , 2025 and 2035
  • Figure 4: Global Market Y-o-Y Growth Comparison by Solution , 2025-2035
  • Figure 5: Global Market Attractiveness Analysis by Solution
  • Figure 6: Global Market Value Share and BPS Analysis by Application, 2025 and 2035
  • Figure 7: Global Market Y-o-Y Growth Comparison by Application, 2025-2035
  • Figure 8: Global Market Attractiveness Analysis by Application
  • Figure 9: Global Market Value Share and BPS Analysis by Vertical, 2025 and 2035
  • Figure 10: Global Market Y-o-Y Growth Comparison by Vertical, 2025-2035
  • Figure 11: Global Market Attractiveness Analysis by Vertical
  • Figure 12: Global Market Value (USD Million) Share and BPS Analysis by Region, 2025 and 2035
  • Figure 13: Global Market Y-o-Y Growth Comparison by Region, 2025-2035
  • Figure 14: Global Market Attractiveness Analysis by Region
  • Figure 15: North America Market Incremental Dollar Opportunity, 2025-2035
  • Figure 16: Latin America Market Incremental Dollar Opportunity, 2025-2035
  • Figure 17: Western Europe Market Incremental Dollar Opportunity, 2025-2035
  • Figure 18: Eastern Europe Market Incremental Dollar Opportunity, 2025-2035
  • Figure 19: East Asia Market Incremental Dollar Opportunity, 2025-2035
  • Figure 20: South Asia and Pacific Market Incremental Dollar Opportunity, 2025-2035
  • Figure 21: Middle East & Africa Market Incremental Dollar Opportunity, 2025-2035
  • Figure 22: North America Market Value Share and BPS Analysis by Country, 2025 and 2035
  • Figure 23: North America Market Value Share and BPS Analysis by Solution , 2025 and 2035
  • Figure 24: North America Market Y-o-Y Growth Comparison by Solution , 2025-2035
  • Figure 25: North America Market Attractiveness Analysis by Solution
  • Figure 26: North America Market Value Share and BPS Analysis by Application, 2025 and 2035
  • Figure 27: North America Market Y-o-Y Growth Comparison by Application, 2025-2035
  • Figure 28: North America Market Attractiveness Analysis by Application
  • Figure 29: North America Market Value Share and BPS Analysis by Vertical, 2025 and 2035
  • Figure 30: North America Market Y-o-Y Growth Comparison by Vertical, 2025-2035
  • Figure 31: North America Market Attractiveness Analysis by Vertical
  • Figure 32: Latin America Market Value Share and BPS Analysis by Country, 2025 and 2035
  • Figure 33: Latin America Market Value Share and BPS Analysis by Solution , 2025 and 2035
  • Figure 34: Latin America Market Y-o-Y Growth Comparison by Solution , 2025-2035
  • Figure 35: Latin America Market Attractiveness Analysis by Solution
  • Figure 36: Latin America Market Value Share and BPS Analysis by Application, 2025 and 2035
  • Figure 37: Latin America Market Y-o-Y Growth Comparison by Application, 2025-2035
  • Figure 38: Latin America Market Attractiveness Analysis by Application
  • Figure 39: Latin America Market Value Share and BPS Analysis by Vertical, 2025 and 2035
  • Figure 40: Latin America Market Y-o-Y Growth Comparison by Vertical, 2025-2035
  • Figure 41: Latin America Market Attractiveness Analysis by Vertical
  • Figure 42: Western Europe Market Value Share and BPS Analysis by Country, 2025 and 2035
  • Figure 43: Western Europe Market Value Share and BPS Analysis by Solution , 2025 and 2035
  • Figure 44: Western Europe Market Y-o-Y Growth Comparison by Solution , 2025-2035
  • Figure 45: Western Europe Market Attractiveness Analysis by Solution
  • Figure 46: Western Europe Market Value Share and BPS Analysis by Application, 2025 and 2035
  • Figure 47: Western Europe Market Y-o-Y Growth Comparison by Application, 2025-2035
  • Figure 48: Western Europe Market Attractiveness Analysis by Application
  • Figure 49: Western Europe Market Value Share and BPS Analysis by Vertical, 2025 and 2035
  • Figure 50: Western Europe Market Y-o-Y Growth Comparison by Vertical, 2025-2035
  • Figure 51: Western Europe Market Attractiveness Analysis by Vertical
  • Figure 52: Eastern Europe Market Value Share and BPS Analysis by Country, 2025 and 2035
  • Figure 53: Eastern Europe Market Value Share and BPS Analysis by Solution , 2025 and 2035
  • Figure 54: Eastern Europe Market Y-o-Y Growth Comparison by Solution , 2025-2035
  • Figure 55: Eastern Europe Market Attractiveness Analysis by Solution
  • Figure 56: Eastern Europe Market Value Share and BPS Analysis by Application, 2025 and 2035
  • Figure 57: Eastern Europe Market Y-o-Y Growth Comparison by Application, 2025-2035
  • Figure 58: Eastern Europe Market Attractiveness Analysis by Application
  • Figure 59: Eastern Europe Market Value Share and BPS Analysis by Vertical, 2025 and 2035
  • Figure 60: Eastern Europe Market Y-o-Y Growth Comparison by Vertical, 2025-2035
  • Figure 61: Eastern Europe Market Attractiveness Analysis by Vertical
  • Figure 62: East Asia Market Value Share and BPS Analysis by Country, 2025 and 2035
  • Figure 63: East Asia Market Value Share and BPS Analysis by Solution , 2025 and 2035
  • Figure 64: East Asia Market Y-o-Y Growth Comparison by Solution , 2025-2035
  • Figure 65: East Asia Market Attractiveness Analysis by Solution
  • Figure 66: East Asia Market Value Share and BPS Analysis by Application, 2025 and 2035
  • Figure 67: East Asia Market Y-o-Y Growth Comparison by Application, 2025-2035
  • Figure 68: East Asia Market Attractiveness Analysis by Application
  • Figure 69: East Asia Market Value Share and BPS Analysis by Vertical, 2025 and 2035
  • Figure 70: East Asia Market Y-o-Y Growth Comparison by Vertical, 2025-2035
  • Figure 71: East Asia Market Attractiveness Analysis by Vertical
  • Figure 72: South Asia and Pacific Market Value Share and BPS Analysis by Country, 2025 and 2035
  • Figure 73: South Asia and Pacific Market Value Share and BPS Analysis by Solution , 2025 and 2035
  • Figure 74: South Asia and Pacific Market Y-o-Y Growth Comparison by Solution , 2025-2035
  • Figure 75: South Asia and Pacific Market Attractiveness Analysis by Solution
  • Figure 76: South Asia and Pacific Market Value Share and BPS Analysis by Application, 2025 and 2035
  • Figure 77: South Asia and Pacific Market Y-o-Y Growth Comparison by Application, 2025-2035
  • Figure 78: South Asia and Pacific Market Attractiveness Analysis by Application
  • Figure 79: South Asia and Pacific Market Value Share and BPS Analysis by Vertical, 2025 and 2035
  • Figure 80: South Asia and Pacific Market Y-o-Y Growth Comparison by Vertical, 2025-2035
  • Figure 81: South Asia and Pacific Market Attractiveness Analysis by Vertical
  • Figure 82: Middle East & Africa Market Value Share and BPS Analysis by Country, 2025 and 2035
  • Figure 83: Middle East & Africa Market Value Share and BPS Analysis by Solution , 2025 and 2035
  • Figure 84: Middle East & Africa Market Y-o-Y Growth Comparison by Solution , 2025-2035
  • Figure 85: Middle East & Africa Market Attractiveness Analysis by Solution
  • Figure 86: Middle East & Africa Market Value Share and BPS Analysis by Application, 2025 and 2035
  • Figure 87: Middle East & Africa Market Y-o-Y Growth Comparison by Application, 2025-2035
  • Figure 88: Middle East & Africa Market Attractiveness Analysis by Application
  • Figure 89: Middle East & Africa Market Value Share and BPS Analysis by Vertical, 2025 and 2035
  • Figure 90: Middle East & Africa Market Y-o-Y Growth Comparison by Vertical, 2025-2035
  • Figure 91: Middle East & Africa Market Attractiveness Analysis by Vertical
  • Figure 92: Global Market - Tier Structure Analysis
  • Figure 93: Global Market - Company Share Analysis
Dashboard
Dashboard
Dashboard
Dashboard
Dashboard
Dashboard

Full Research Suite comprises of:

Market outlook & trends analysis

Market outlook & trends analysis

Interviews & case studies

Interviews & case studies

Strategic recommendations

Strategic recommendations

Vendor profiles & capabilities analysis

Vendor profiles & capabilities analysis

5-year forecasts

5-year forecasts

8 regions and 60+ country-level data splits

8 regions and 60+ country-level data splits

Market segment data splits

Market segment data splits

12 months of continuous data updates

12 months of continuous data updates

DELIVERED AS:

PDF EXCEL ONLINE

Full Research Suite


$5000

$7500

$10000

Buy Report Now
Similar Industry Reports

Similar Industry Reports

Blockchain Food Traceability Market

Blockchain Food Traceability Market Size and Share Forecast Outlook 2025 to 2035

Blockchain AI Market

Blockchain AI Market Size and Share Forecast Outlook 2025 to 2035

Blockchain Messaging Apps Market

Blockchain Messaging Apps Market Size and Share Forecast Outlook 2025 to 2035

Blockchain in Logistics Market

Blockchain in Logistics Market Size and Share Forecast Outlook 2025 to 2035

Blockchain Market
Blockchain Market

Blockchain Market Size and Share Forecast Outlook 2025 to 2035

Blockchain in Energy Market

Blockchain in Energy Market Size and Share Forecast Outlook 2025 to 2035

Blockchain Identity Management Market

Blockchain Identity Management Market Size and Share Forecast Outlook 2025 to 2035

Blockchain in Agriculture and Food Supply Chain Market

Blockchain in Agriculture and Food Supply Chain Market Size and Share Forecast Outlook 2025 to 2035

Blockchain Technology Market

Blockchain Technology Market Analysis & Forecast 2025 to 2035, By Solution, Use Case, Enterprise Size, Industry, and Region

Blockchain in Banking Market

Blockchain in Banking Market

Blockchain in Agriculture Market

Blockchain in Agriculture Market Analysis – Size, Share & Forecast 2024-2034

Managed Blockchain Services Market

Managed Blockchain Services Market Size and Share Forecast Outlook 2025 to 2035

Web 3.0 Blockchain Market

Web 3.0 Blockchain Market Report – Growth, Demand & Forecast 2024-2034

Automotive Blockchain Market

Automotive Blockchain Market Size and Share Forecast Outlook 2025 to 2035

Healthcare Interoperability Solutions Market

Healthcare Interoperability Solutions Market Analysis – Trends & Growth 2025 to 2035

WiMAX (Worldwide Interoperability For Microwave Access) Market

WiMAX (Worldwide Interoperability For Microwave Access) Market Size and Share Forecast Outlook 2025 to 2035

Future Market Insights

Blockchain Interoperability Market

Chat With MaRIA

Chat With

MaRIA

Hi There, I am MaRIA, Your Market Research Intelligence Assistant. How may I help you?