Blockchain AI Market Size and Share Forecast Outlook 2025 to 2035

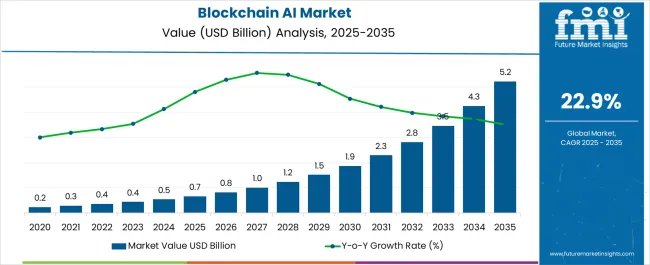
The Blockchain AI Market is estimated to be valued at USD 0.7 billion in 2025 and is projected to reach USD 5.2 billion by 2035, registering a compound annual growth rate (CAGR) of 22.9% over the forecast period.
Quick Stats for Blockchain AI Market

  • Blockchain AI Market Industry Value (2025): USD 0.7 billion
  • Blockchain AI Market Forecast Value (2035): USD 5.2 billion
  • Blockchain AI Market Forecast CAGR: 22.9%
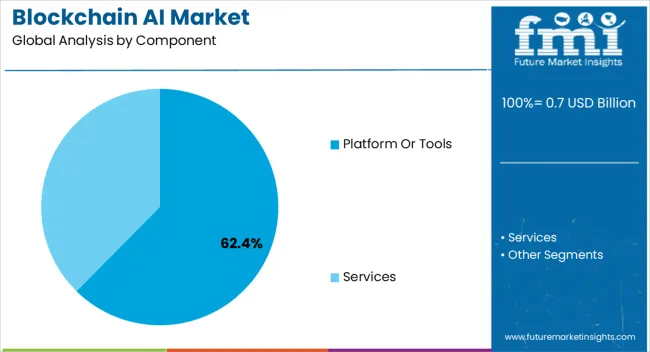
  • Leading Segment in Blockchain AI Market in 2025: Platform Or Tools (62.4%)
  • Key Growth Region in Blockchain AI Market: North America, Asia-Pacific, Europe
  • Top Key Players in Blockchain AI Market: IBM, Core Scientific, BurstIQ, Alpha Networks, Cyware, NeuroChain Tech, Oracle, Amazon Web Services (AWS), ConsenSys, Google

Blockchain Ai Market Market Value Analysis

Metric Value
Blockchain AI Market Estimated Value in (2025 E) USD 0.7 billion
Blockchain AI Market Forecast Value in (2035 F) USD 5.2 billion
Forecast CAGR (2025 to 2035) 22.9%

Rationale for Segmental Growth in the Blockchain AI Market

The blockchain AI market is progressing rapidly as enterprises integrate distributed ledger technologies with artificial intelligence to enhance transparency, efficiency, and decision-making capabilities. Current dynamics are characterized by strong adoption across industries seeking secure data exchange, automated smart contracts, and advanced analytics. Rising concerns over data security, regulatory compliance, and traceability are accelerating demand for blockchain AI solutions.

The market outlook is shaped by expanding cloud infrastructure, improved interoperability standards, and increased investment from both technology providers and enterprises. Growth rationale is rooted in the ability of blockchain to provide trusted and immutable records while AI enhances predictive accuracy, automation, and operational intelligence.

Strategic collaborations, R&D initiatives, and scaling of enterprise-grade applications are reinforcing the ecosystem. Over the forecast period, market growth is expected to be underpinned by technological innovation, broader enterprise digital transformation, and accelerated adoption across finance, healthcare, logistics, and manufacturing sectors.
Segmental Analysis

Insights into the Component Segment

Blockchain Ai Market Analysis By Component

The platform or tools segment, accounting for 62.40% of the component category, has dominated the market due to its critical role in enabling enterprises to build, deploy, and manage blockchain AI applications efficiently. Demand is being supported by increasing reliance on customizable frameworks, modular solutions, and scalable architectures that cater to industry-specific needs.

Vendor investments in interoperability and cross-chain capabilities have improved integration, ensuring higher adoption rates. Security and compliance features embedded into platforms have enhanced trust among enterprises, while continuous upgrades in AI-driven automation and analytics have expanded functional applicability.

With enterprises seeking robust and flexible solutions, this segment is expected to sustain its leadership, driving long-term market growth and adoption.
Insights into the Deployment Mode Segment

Blockchain Ai Market Analysis By Deployment Mode

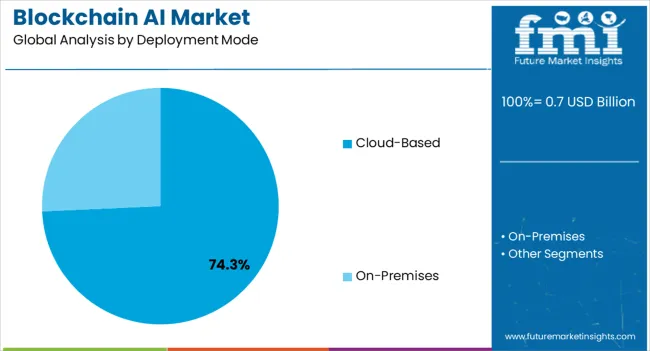
The cloud-based segment, representing 74.30% of the deployment mode category, has emerged as the leading model due to scalability, cost-efficiency, and accessibility. Adoption has been reinforced by the ability to deliver blockchain AI solutions without extensive hardware investment, aligning with enterprise digital transformation strategies.

Cloud infrastructure has enabled rapid deployment, seamless updates, and flexible integration with existing IT systems, increasing operational efficiency. Enhanced data storage capabilities, disaster recovery options, and real-time analytics have further supported enterprise preference for cloud models.

As cloud providers continue to invest in security and AI-driven enhancements, this segment is expected to maintain its dominant position, fueling market expansion across diverse verticals.
Insights into the Organization Size Segment

Blockchain Ai Market Analysis By Organization Size

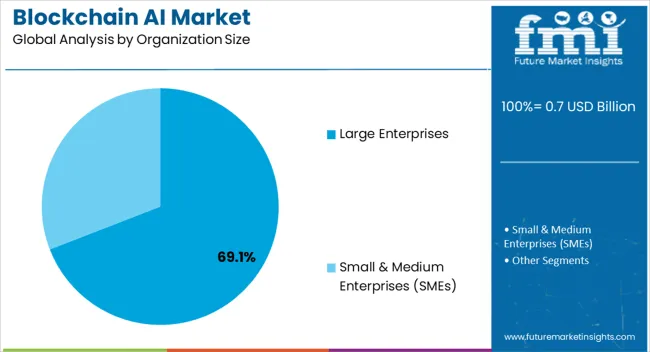
The large enterprises segment, holding 69.10% of the organization size category, has led the market owing to its financial capacity, advanced infrastructure, and strategic focus on digital innovation. Adoption has been supported by the need to handle complex processes such as secure transactions, supply chain optimization, and customer engagement at scale.

Large enterprises are leveraging blockchain AI solutions to strengthen governance, improve operational efficiency, and achieve cost optimization. Strategic partnerships with technology providers and investments in proprietary platforms have further reinforced their market dominance.

The segment’s leadership is expected to persist as enterprises continue expanding global operations and integrating blockchain AI into mission-critical functions, ensuring sustainable demand and consistent revenue contribution to the overall market.

What are the Principal Factors Boosting the Global Blockchain AI Market?

Increasing Monetization of Customer Data with the Application of Blockchain to Support Market Growth

Blockchain AI technologies enable data monetization, which is expected to be a significant factor driving the market during the forecast period.

Data monetization would make AI and advanced blockchain easily accessible to emerging companies. A decentralized market would make such space for smaller companies which, otherwise, would have been very expensive. Also, developments in artificial intelligence (AI), the Internet of Things (IoT), and big data technologies are projected to boost the application of data monetization solutions among organizations.

Key participants of players are targeted at launching new products to meet the growing demands. In an occurrence, in February 2020, Continental AG and Hewlett Packard Enterprise (HPE) launched a new blockchain-based platform known as the Data Monetization Platform. It assists car manufacturers to monetize their data and offers data security to meet issues related to the sharing of vehicle data.

What are the Emerging Opportunities in the Global Blockchain AI Market?

Growing demand for the combination of blockchain and AI-based natural language processing (NLP) solutions among established is anticipated to be the major emerging trend for the market expansion. The fault-tolerant features along with the non-modifiable, and immutable specifics of blockchain are crucial for the security of sensitive data produced by NLP solutions and algorithms.

NLP blockchain solutions also witness considerable demand in the healthcare sector owing to their ability to enhance patient experience and care by using advanced NLP platforms that offers significant insights from medical data. The amalgamation of these two technologies can offer precise results.

For instance, in September 2020, Zensar Technologies Limited launched its blockchain-based management solutions- DICES (Distributed Intelligent Contract Enforcement System) and ZenConfluence- for several organizations. The objective is to assist end-users track the contractual goals without manual intervention efficiently.

What are the Challenges Prevailing in the Global Blockchain AI Market?

The lack of blockchain AI experts is anticipated to act as a significant restraint to the market in the forecast period. Blockchain AI is at a nascent stage and is complex in nature. Therefore, organizations demand expertise in managing blockchain solutions powered by AI. The technology offers various benefits, however, lack of awareness, inadequate funding, and poor investments are likely to hamper the market growth in the forecast period. Also, uncertain regulations are also projected to hinder the industry growth.

Decentralization and data control are likely to hinder privacy and act as a significant challenge to the market. When the need for an intermediary is eliminated, decentralization puts the user completely in charge of their data. That is why various data sets are acquired by several organizations, users retain their data ownership and can determine who has access to the same.

What is the Segmentation Analysis of the Global Blockchain AI Market?

Based on Components, the global market can be segmented into services and platforms/tools. Based on organization size, the global blockchain AI market can be segmented into SMEs and Large Enterprises. As per the analysis, by component, the platform segment is likely to expand at a CAGR of 21.3% during the forecast period.

The platform segment is expected to flourish owing to the increasing demand for blockchain artificial AI-based platforms across various spheres of enterprises to assure safe transaction models in their business units. On the other hand, the services segment is projected to witness significant demand in the coming time.

Based on Application, the global market can be segmented into Smart Contracts, Payment and Settlement, Data Security, Data Sharing/Communication, Asset Tracking and Management, Logistics and Supply Chain Management, Business Process Optimization, and others.

The BFSI industry is projected to offer lucrative opportunities for market expansion in the forecast period. The scope of expansion can be attributed to the increasing adoption of decentralized applications based on AI technology across fintech and financial institutions. The banking sector is focused on implementing various projects dependent on blockchain services.

Category By Component
Top Segment Platform or Tool
Market Share in Percentage 71.2%
Category By Technology
Top Segment ML-based Blockchain AI
Market Share in Percentage 36.4%

What is the Contribution of Various Segments in Boosting the Market?

Based on technology, the global market can be segmented into ML, NLP, Context-Aware Computing, and Computer Vision. Based on Vertical, the global blockchain AI market can be segmented into BFSI, Telecom and IT, Healthcare and Life Science, Manufacturing, Media and Entertainment, Automotive, and others.

The growth can be attributed to the growing demand for blockchain services like support & maintenance, systems integration & deployment, & technology advisory & consulting from several industries is expected to boost the segment growth.By deployment, the cloud segment is projected to record a 20.6% CAGR in the forecast period. The segment is projected to garner a larger market share in the coming time. The growth of the segment can be attributed to the growing adoption of cloud-based solutions and services.

Based on deployment mode, the global market can be segmented into cloud and on-premises. The cloud also offers trained network solutions and services which strengthens building blockchain applications based on AI. On the other hand, the on-premise segment is expected to record significant growth due to the growing investments in AI blockchain platforms by SMEs and governments.

What is the Regional Analysis of the Global Blockchain AI Market?

Regional Market Comparison Global Market Share in Percentage
North America 29.4%
Europe 22.6%

According to the analysis, the global market is estimated to be dominated by North America. The USA is anticipated to garner the largest market share in the forecast period. It is estimated at USD 917.7 million, recording a CAGR of 22.2% during the forecast period.

There were nearly 2,000 blockchain projects in the USA from 2014 to 2020, reveals the China Academy of Information and Communications Technology (CAICT). Also, the government in the USA is focused on deploying blockchain artificial intelligence-based solutions in various spheres.

Europe is likely to garner considerable market share with the United Kingdom contributing USD 123.5 million, expanding at 21.5% CAGR. Sectors such as ITC, automotive, media, and entertainment, among others, are some of the most significant consumers. Also, rapid digitalization is expected to positively benefit the market in the region in the coming time.

Regional Market Comparison Global Market Share in Percentage
United States 20.1%
Germany 8.6%
Japan 6.1%
Australia 2.2%

Growing partnerships among players are expected to augment the market in the United Kingdom. For instance, in March 2024, London-based West Ham United FC announced an AI partnership with British Blockchain firm Fetch Ai.

Asia Pacific is projected to be the most lucrative market in the assessment period. The region is witnessing rapid adoption of advanced technologies, which acts as a salient factor boosting the market in Asia Pacific. Emerging nations such as China, Japan, and South Korea are recognized to be the most remunerative markets.

As per the analysis, China, Japan, and South Korea are projected at USD 208.2 million, USD 175.5 million, and USD 111.4 million respectively. Also, the three countries are expected to flourish at a healthy CAGR with China expanding at 22.1%, Japan at 21.4%, and South Korea at 21.1% in the forecast period.

The development of the region can be attributed to the increasing investments by governments. For instance, in May 2024, Tencent Holdings Ltd., the parent company of WeChat, made an investment of USD 70 billion into AI, Cybersecurity, Blockchain, and others in pursuit of new infrastructures.

Countries Estimated CAGR (2025 to 2035)
India 20.3%
United Kingdom 21.7%
China 22.4%
Japan 21.4%
South Korea 21.1%

What is the Contribution of Key Players to the Global Blockchain AI Market?

Blockchain Ai Market Analysis By Company

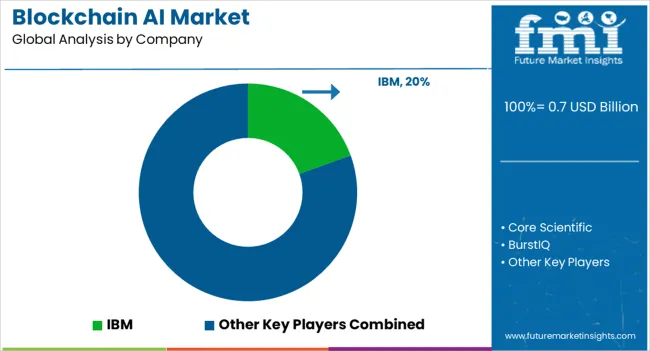
Key players in the global blockchain AI business include Core Scientific, BurstIQ, Alpha Networks, Cyware, NeuroChain Tech, and Core Scientific among others.

Recent developments among key players are:

  • In August 2024, BurstIQ, LLC rolled out its complete developer kit, known as BustChain User Interface (UI) Software Developer Kit (SDK). The set enables enterprises to swiftly deploy and creates solutions and services on the BurstIQ Platform.
  • In May 2024, Figure Technologies Inc raised USD 200 Million in series D funding at a USD 3.2 billion valuation. The investment will allow leveraging blockchain to reinvent the financial services sector.
  • In September 2024, BurstIQ announced a strategic partnership with Tech Mahindra to offer an identity management platform, identity data management (IDM), and provider data management (PDM).

Key Segments Covered in the Blockchain AI Market Report

By Component:

  • Services
  • Platform or Tools

By Deployment Mode:

  • Cloud-based
  • On-premises

By Organization Size:

  • Large Enterprises
  • Small & Medium Enterprises (SMEs)

By Technology:

  • ML-based
  • NLP-based
  • Context-Aware Computing-based
  • Computer Vision-based

By Vertical:

  • Telecom and IT
  • Banking, Financial Services, & Insurance (BFSI)
  • Healthcare and Life Sciences
  • Manufacturing
  • Media and Entertainment
  • Automotive
  • Other Verticals

By Application:

  • Smart Contracts
  • Payment and Settlement
  • Data Security
  • Data Sharing/Communication
  • Asset Tracking and Management
  • Logistics and Supply Chain Management
  • Business Process Optimization
  • Other Applications

By Region:

  • North America
  • Europe
  • East Asia
  • South Asia & Pacific
  • Middle East & Africa (ME&A)
  • Latin America

Frequently Asked Questions

How big is the blockchain AI market in 2025?

The global blockchain AI market is estimated to be valued at USD 0.7 billion in 2025.

What will be the size of blockchain AI market in 2035?

The market size for the blockchain AI market is projected to reach USD 5.2 billion by 2035.

How much will be the blockchain AI market growth between 2025 and 2035?

The blockchain AI market is expected to grow at a 22.9% CAGR between 2025 and 2035.

What are the key product types in the blockchain AI market?

The key product types in blockchain AI market are platform or tools and services.

Which deployment mode segment to contribute significant share in the blockchain AI market in 2025?

In terms of deployment mode, cloud-based segment to command 74.3% share in the blockchain AI market in 2025.

Table of Content

  1. Executive Summary
    • Global Market Outlook
    • Demand-side Trends
    • Supply-side Trends
    • Technology Roadmap Analysis
    • Analysis and Recommendations
  2. Market Overview
    • Market Coverage / Taxonomy
    • Market Definition / Scope / Limitations
  3. Market Background
    • Market Dynamics
      • Drivers
      • Restraints
      • Opportunity
      • Trends
    • Scenario Forecast
      • Demand in Optimistic Scenario
      • Demand in Likely Scenario
      • Demand in Conservative Scenario
    • Opportunity Map Analysis
    • Product Life Cycle Analysis
    • Supply Chain Analysis
    • Investment Feasibility Matrix
    • Value Chain Analysis
    • PESTLE and Porter’s Analysis
    • Regulatory Landscape
    • Regional Parent Market Outlook
    • Production and Consumption Statistics
    • Import and Export Statistics
  4. Global Market Analysis 2020 to 2024 and Forecast, 2025 to 2035
    • Historical Market Size Value (USD Million) Analysis, 2020 to 2024
    • Current and Future Market Size Value (USD Million) Projections, 2025 to 2035
      • Y-o-Y Growth Trend Analysis
      • Absolute $ Opportunity Analysis
  5. Global Market Pricing Analysis 2020 to 2024 and Forecast 2025 to 2035
  6. Global Market Analysis 2020 to 2024 and Forecast 2025 to 2035, By Component
    • Introduction / Key Findings
    • Historical Market Size Value (USD Million) Analysis By Component , 2020 to 2024
    • Current and Future Market Size Value (USD Million) Analysis and Forecast By Component , 2025 to 2035
      • Platform Or Tools
      • Services
    • Y-o-Y Growth Trend Analysis By Component , 2020 to 2024
    • Absolute $ Opportunity Analysis By Component , 2025 to 2035
  7. Global Market Analysis 2020 to 2024 and Forecast 2025 to 2035, By Deployment Mode
    • Introduction / Key Findings
    • Historical Market Size Value (USD Million) Analysis By Deployment Mode, 2020 to 2024
    • Current and Future Market Size Value (USD Million) Analysis and Forecast By Deployment Mode, 2025 to 2035
      • Cloud-Based
      • On-Premises
    • Y-o-Y Growth Trend Analysis By Deployment Mode, 2020 to 2024
    • Absolute $ Opportunity Analysis By Deployment Mode, 2025 to 2035
  8. Global Market Analysis 2020 to 2024 and Forecast 2025 to 2035, By Organization Size
    • Introduction / Key Findings
    • Historical Market Size Value (USD Million) Analysis By Organization Size, 2020 to 2024
    • Current and Future Market Size Value (USD Million) Analysis and Forecast By Organization Size, 2025 to 2035
      • Large Enterprises
      • Small & Medium Enterprises (SMEs)
    • Y-o-Y Growth Trend Analysis By Organization Size, 2020 to 2024
    • Absolute $ Opportunity Analysis By Organization Size, 2025 to 2035
  9. Global Market Analysis 2020 to 2024 and Forecast 2025 to 2035, By Technology
    • Introduction / Key Findings
    • Historical Market Size Value (USD Million) Analysis By Technology, 2020 to 2024
    • Current and Future Market Size Value (USD Million) Analysis and Forecast By Technology, 2025 to 2035
      • ML-Based
      • NLP-Based
      • Context-Aware Computing-Based
      • Computer Vision-Based
    • Y-o-Y Growth Trend Analysis By Technology, 2020 to 2024
    • Absolute $ Opportunity Analysis By Technology, 2025 to 2035
  10. Global Market Analysis 2020 to 2024 and Forecast 2025 to 2035, By Vertical
    • Introduction / Key Findings
    • Historical Market Size Value (USD Million) Analysis By Vertical, 2020 to 2024
    • Current and Future Market Size Value (USD Million) Analysis and Forecast By Vertical, 2025 to 2035
      • Telecom And IT
      • Banking, Financial Services, & Insurance (BFSI)
      • Healthcare And Life Sciences
      • Manufacturing
      • Media And Entertainment
      • Automotive
      • Other Verticals
    • Y-o-Y Growth Trend Analysis By Vertical, 2020 to 2024
    • Absolute $ Opportunity Analysis By Vertical, 2025 to 2035
  11. Global Market Analysis 2020 to 2024 and Forecast 2025 to 2035, By Application
    • Introduction / Key Findings
    • Historical Market Size Value (USD Million) Analysis By Application, 2020 to 2024
    • Current and Future Market Size Value (USD Million) Analysis and Forecast By Application, 2025 to 2035
      • Logistics And Supply Chain Management
      • Smart Contracts
      • Payment And Settlement
      • Data Security
      • Data Sharing/Communication
      • Asset Tracking And Management
      • Business Process Optimization
      • Other Applications
    • Y-o-Y Growth Trend Analysis By Application, 2020 to 2024
    • Absolute $ Opportunity Analysis By Application, 2025 to 2035
  12. Global Market Analysis 2020 to 2024 and Forecast 2025 to 2035, By Region
    • Introduction
    • Historical Market Size Value (USD Million) Analysis By Region, 2020 to 2024
    • Current Market Size Value (USD Million) Analysis and Forecast By Region, 2025 to 2035
      • North America
      • Latin America
      • Western Europe
      • Eastern Europe
      • East Asia
      • South Asia and Pacific
      • Middle East & Africa
    • Market Attractiveness Analysis By Region
  13. North America Market Analysis 2020 to 2024 and Forecast 2025 to 2035, By Country
    • Historical Market Size Value (USD Million) Trend Analysis By Market Taxonomy, 2020 to 2024
    • Market Size Value (USD Million) Forecast By Market Taxonomy, 2025 to 2035
      • By Country
        • USA
        • Canada
        • Mexico
      • By Component
      • By Deployment Mode
      • By Organization Size
      • By Technology
      • By Vertical
      • By Application
    • Market Attractiveness Analysis
      • By Country
      • By Component
      • By Deployment Mode
      • By Organization Size
      • By Technology
      • By Vertical
      • By Application
    • Key Takeaways
  14. Latin America Market Analysis 2020 to 2024 and Forecast 2025 to 2035, By Country
    • Historical Market Size Value (USD Million) Trend Analysis By Market Taxonomy, 2020 to 2024
    • Market Size Value (USD Million) Forecast By Market Taxonomy, 2025 to 2035
      • By Country
        • Brazil
        • Chile
        • Rest of Latin America
      • By Component
      • By Deployment Mode
      • By Organization Size
      • By Technology
      • By Vertical
      • By Application
    • Market Attractiveness Analysis
      • By Country
      • By Component
      • By Deployment Mode
      • By Organization Size
      • By Technology
      • By Vertical
      • By Application
    • Key Takeaways
  15. Western Europe Market Analysis 2020 to 2024 and Forecast 2025 to 2035, By Country
    • Historical Market Size Value (USD Million) Trend Analysis By Market Taxonomy, 2020 to 2024
    • Market Size Value (USD Million) Forecast By Market Taxonomy, 2025 to 2035
      • By Country
        • Germany
        • UK
        • Italy
        • Spain
        • France
        • Nordic
        • BENELUX
        • Rest of Western Europe
      • By Component
      • By Deployment Mode
      • By Organization Size
      • By Technology
      • By Vertical
      • By Application
    • Market Attractiveness Analysis
      • By Country
      • By Component
      • By Deployment Mode
      • By Organization Size
      • By Technology
      • By Vertical
      • By Application
    • Key Takeaways
  16. Eastern Europe Market Analysis 2020 to 2024 and Forecast 2025 to 2035, By Country
    • Historical Market Size Value (USD Million) Trend Analysis By Market Taxonomy, 2020 to 2024
    • Market Size Value (USD Million) Forecast By Market Taxonomy, 2025 to 2035
      • By Country
        • Russia
        • Poland
        • Hungary
        • Balkan & Baltic
        • Rest of Eastern Europe
      • By Component
      • By Deployment Mode
      • By Organization Size
      • By Technology
      • By Vertical
      • By Application
    • Market Attractiveness Analysis
      • By Country
      • By Component
      • By Deployment Mode
      • By Organization Size
      • By Technology
      • By Vertical
      • By Application
    • Key Takeaways
  17. East Asia Market Analysis 2020 to 2024 and Forecast 2025 to 2035, By Country
    • Historical Market Size Value (USD Million) Trend Analysis By Market Taxonomy, 2020 to 2024
    • Market Size Value (USD Million) Forecast By Market Taxonomy, 2025 to 2035
      • By Country
        • China
        • Japan
        • South Korea
      • By Component
      • By Deployment Mode
      • By Organization Size
      • By Technology
      • By Vertical
      • By Application
    • Market Attractiveness Analysis
      • By Country
      • By Component
      • By Deployment Mode
      • By Organization Size
      • By Technology
      • By Vertical
      • By Application
    • Key Takeaways
  18. South Asia and Pacific Market Analysis 2020 to 2024 and Forecast 2025 to 2035, By Country
    • Historical Market Size Value (USD Million) Trend Analysis By Market Taxonomy, 2020 to 2024
    • Market Size Value (USD Million) Forecast By Market Taxonomy, 2025 to 2035
      • By Country
        • India
        • ASEAN
        • Australia & New Zealand
        • Rest of South Asia and Pacific
      • By Component
      • By Deployment Mode
      • By Organization Size
      • By Technology
      • By Vertical
      • By Application
    • Market Attractiveness Analysis
      • By Country
      • By Component
      • By Deployment Mode
      • By Organization Size
      • By Technology
      • By Vertical
      • By Application
    • Key Takeaways
  19. Middle East & Africa Market Analysis 2020 to 2024 and Forecast 2025 to 2035, By Country
    • Historical Market Size Value (USD Million) Trend Analysis By Market Taxonomy, 2020 to 2024
    • Market Size Value (USD Million) Forecast By Market Taxonomy, 2025 to 2035
      • By Country
        • Kingdom of Saudi Arabia
        • Other GCC Countries
        • Turkiye
        • South Africa
        • Other African Union
        • Rest of Middle East & Africa
      • By Component
      • By Deployment Mode
      • By Organization Size
      • By Technology
      • By Vertical
      • By Application
    • Market Attractiveness Analysis
      • By Country
      • By Component
      • By Deployment Mode
      • By Organization Size
      • By Technology
      • By Vertical
      • By Application
    • Key Takeaways
  20. Key Countries Market Analysis
    • USA
      • Pricing Analysis
      • Market Share Analysis, 2024
        • By Component
        • By Deployment Mode
        • By Organization Size
        • By Technology
        • By Vertical
        • By Application
    • Canada
      • Pricing Analysis
      • Market Share Analysis, 2024
        • By Component
        • By Deployment Mode
        • By Organization Size
        • By Technology
        • By Vertical
        • By Application
    • Mexico
      • Pricing Analysis
      • Market Share Analysis, 2024
        • By Component
        • By Deployment Mode
        • By Organization Size
        • By Technology
        • By Vertical
        • By Application
    • Brazil
      • Pricing Analysis
      • Market Share Analysis, 2024
        • By Component
        • By Deployment Mode
        • By Organization Size
        • By Technology
        • By Vertical
        • By Application
    • Chile
      • Pricing Analysis
      • Market Share Analysis, 2024
        • By Component
        • By Deployment Mode
        • By Organization Size
        • By Technology
        • By Vertical
        • By Application
    • Germany
      • Pricing Analysis
      • Market Share Analysis, 2024
        • By Component
        • By Deployment Mode
        • By Organization Size
        • By Technology
        • By Vertical
        • By Application
    • UK
      • Pricing Analysis
      • Market Share Analysis, 2024
        • By Component
        • By Deployment Mode
        • By Organization Size
        • By Technology
        • By Vertical
        • By Application
    • Italy
      • Pricing Analysis
      • Market Share Analysis, 2024
        • By Component
        • By Deployment Mode
        • By Organization Size
        • By Technology
        • By Vertical
        • By Application
    • Spain
      • Pricing Analysis
      • Market Share Analysis, 2024
        • By Component
        • By Deployment Mode
        • By Organization Size
        • By Technology
        • By Vertical
        • By Application
    • France
      • Pricing Analysis
      • Market Share Analysis, 2024
        • By Component
        • By Deployment Mode
        • By Organization Size
        • By Technology
        • By Vertical
        • By Application
    • India
      • Pricing Analysis
      • Market Share Analysis, 2024
        • By Component
        • By Deployment Mode
        • By Organization Size
        • By Technology
        • By Vertical
        • By Application
    • ASEAN
      • Pricing Analysis
      • Market Share Analysis, 2024
        • By Component
        • By Deployment Mode
        • By Organization Size
        • By Technology
        • By Vertical
        • By Application
    • Australia & New Zealand
      • Pricing Analysis
      • Market Share Analysis, 2024
        • By Component
        • By Deployment Mode
        • By Organization Size
        • By Technology
        • By Vertical
        • By Application
    • China
      • Pricing Analysis
      • Market Share Analysis, 2024
        • By Component
        • By Deployment Mode
        • By Organization Size
        • By Technology
        • By Vertical
        • By Application
    • Japan
      • Pricing Analysis
      • Market Share Analysis, 2024
        • By Component
        • By Deployment Mode
        • By Organization Size
        • By Technology
        • By Vertical
        • By Application
    • South Korea
      • Pricing Analysis
      • Market Share Analysis, 2024
        • By Component
        • By Deployment Mode
        • By Organization Size
        • By Technology
        • By Vertical
        • By Application
    • Russia
      • Pricing Analysis
      • Market Share Analysis, 2024
        • By Component
        • By Deployment Mode
        • By Organization Size
        • By Technology
        • By Vertical
        • By Application
    • Poland
      • Pricing Analysis
      • Market Share Analysis, 2024
        • By Component
        • By Deployment Mode
        • By Organization Size
        • By Technology
        • By Vertical
        • By Application
    • Hungary
      • Pricing Analysis
      • Market Share Analysis, 2024
        • By Component
        • By Deployment Mode
        • By Organization Size
        • By Technology
        • By Vertical
        • By Application
    • Kingdom of Saudi Arabia
      • Pricing Analysis
      • Market Share Analysis, 2024
        • By Component
        • By Deployment Mode
        • By Organization Size
        • By Technology
        • By Vertical
        • By Application
    • Turkiye
      • Pricing Analysis
      • Market Share Analysis, 2024
        • By Component
        • By Deployment Mode
        • By Organization Size
        • By Technology
        • By Vertical
        • By Application
    • South Africa
      • Pricing Analysis
      • Market Share Analysis, 2024
        • By Component
        • By Deployment Mode
        • By Organization Size
        • By Technology
        • By Vertical
        • By Application
  21. Market Structure Analysis
    • Competition Dashboard
    • Competition Benchmarking
    • Market Share Analysis of Top Players
      • By Regional
      • By Component
      • By Deployment Mode
      • By Organization Size
      • By Technology
      • By Vertical
      • By Application
  22. Competition Analysis
    • Competition Deep Dive
      • IBM
        • Overview
        • Product Portfolio
        • Profitability by Market Segments (Product/Age /Sales Channel/Region)
        • Sales Footprint
        • Strategy Overview
          • Marketing Strategy
          • Product Strategy
          • Channel Strategy
      • Core Scientific
      • BurstIQ
      • Alpha Networks
      • Cyware
      • NeuroChain Tech
      • Oracle
      • Amazon Web Services (AWS)
      • ConsenSys
      • Google
  23. Assumptions & Acronyms Used
  24. Research Methodology

List of Tables

  • Table 1: Global Market Value (USD Million) Forecast by Region, 2020 to 2035
  • Table 2: Global Market Value (USD Million) Forecast by Component , 2020 to 2035
  • Table 3: Global Market Value (USD Million) Forecast by Deployment Mode, 2020 to 2035
  • Table 4: Global Market Value (USD Million) Forecast by Organization Size, 2020 to 2035
  • Table 5: Global Market Value (USD Million) Forecast by Technology, 2020 to 2035
  • Table 6: Global Market Value (USD Million) Forecast by Vertical, 2020 to 2035
  • Table 7: Global Market Value (USD Million) Forecast by Application, 2020 to 2035
  • Table 8: North America Market Value (USD Million) Forecast by Country, 2020 to 2035
  • Table 9: North America Market Value (USD Million) Forecast by Component , 2020 to 2035
  • Table 10: North America Market Value (USD Million) Forecast by Deployment Mode, 2020 to 2035
  • Table 11: North America Market Value (USD Million) Forecast by Organization Size, 2020 to 2035
  • Table 12: North America Market Value (USD Million) Forecast by Technology, 2020 to 2035
  • Table 13: North America Market Value (USD Million) Forecast by Vertical, 2020 to 2035
  • Table 14: North America Market Value (USD Million) Forecast by Application, 2020 to 2035
  • Table 15: Latin America Market Value (USD Million) Forecast by Country, 2020 to 2035
  • Table 16: Latin America Market Value (USD Million) Forecast by Component , 2020 to 2035
  • Table 17: Latin America Market Value (USD Million) Forecast by Deployment Mode, 2020 to 2035
  • Table 18: Latin America Market Value (USD Million) Forecast by Organization Size, 2020 to 2035
  • Table 19: Latin America Market Value (USD Million) Forecast by Technology, 2020 to 2035
  • Table 20: Latin America Market Value (USD Million) Forecast by Vertical, 2020 to 2035
  • Table 21: Latin America Market Value (USD Million) Forecast by Application, 2020 to 2035
  • Table 22: Western Europe Market Value (USD Million) Forecast by Country, 2020 to 2035
  • Table 23: Western Europe Market Value (USD Million) Forecast by Component , 2020 to 2035
  • Table 24: Western Europe Market Value (USD Million) Forecast by Deployment Mode, 2020 to 2035
  • Table 25: Western Europe Market Value (USD Million) Forecast by Organization Size, 2020 to 2035
  • Table 26: Western Europe Market Value (USD Million) Forecast by Technology, 2020 to 2035
  • Table 27: Western Europe Market Value (USD Million) Forecast by Vertical, 2020 to 2035
  • Table 28: Western Europe Market Value (USD Million) Forecast by Application, 2020 to 2035
  • Table 29: Eastern Europe Market Value (USD Million) Forecast by Country, 2020 to 2035
  • Table 30: Eastern Europe Market Value (USD Million) Forecast by Component , 2020 to 2035
  • Table 31: Eastern Europe Market Value (USD Million) Forecast by Deployment Mode, 2020 to 2035
  • Table 32: Eastern Europe Market Value (USD Million) Forecast by Organization Size, 2020 to 2035
  • Table 33: Eastern Europe Market Value (USD Million) Forecast by Technology, 2020 to 2035
  • Table 34: Eastern Europe Market Value (USD Million) Forecast by Vertical, 2020 to 2035
  • Table 35: Eastern Europe Market Value (USD Million) Forecast by Application, 2020 to 2035
  • Table 36: East Asia Market Value (USD Million) Forecast by Country, 2020 to 2035
  • Table 37: East Asia Market Value (USD Million) Forecast by Component , 2020 to 2035
  • Table 38: East Asia Market Value (USD Million) Forecast by Deployment Mode, 2020 to 2035
  • Table 39: East Asia Market Value (USD Million) Forecast by Organization Size, 2020 to 2035
  • Table 40: East Asia Market Value (USD Million) Forecast by Technology, 2020 to 2035
  • Table 41: East Asia Market Value (USD Million) Forecast by Vertical, 2020 to 2035
  • Table 42: East Asia Market Value (USD Million) Forecast by Application, 2020 to 2035
  • Table 43: South Asia and Pacific Market Value (USD Million) Forecast by Country, 2020 to 2035
  • Table 44: South Asia and Pacific Market Value (USD Million) Forecast by Component , 2020 to 2035
  • Table 45: South Asia and Pacific Market Value (USD Million) Forecast by Deployment Mode, 2020 to 2035
  • Table 46: South Asia and Pacific Market Value (USD Million) Forecast by Organization Size, 2020 to 2035
  • Table 47: South Asia and Pacific Market Value (USD Million) Forecast by Technology, 2020 to 2035
  • Table 48: South Asia and Pacific Market Value (USD Million) Forecast by Vertical, 2020 to 2035
  • Table 49: South Asia and Pacific Market Value (USD Million) Forecast by Application, 2020 to 2035
  • Table 50: Middle East & Africa Market Value (USD Million) Forecast by Country, 2020 to 2035
  • Table 51: Middle East & Africa Market Value (USD Million) Forecast by Component , 2020 to 2035
  • Table 52: Middle East & Africa Market Value (USD Million) Forecast by Deployment Mode, 2020 to 2035
  • Table 53: Middle East & Africa Market Value (USD Million) Forecast by Organization Size, 2020 to 2035
  • Table 54: Middle East & Africa Market Value (USD Million) Forecast by Technology, 2020 to 2035
  • Table 55: Middle East & Africa Market Value (USD Million) Forecast by Vertical, 2020 to 2035
  • Table 56: Middle East & Africa Market Value (USD Million) Forecast by Application, 2020 to 2035

List of Figures

  • Figure 1: Global Market Pricing Analysis
  • Figure 2: Global Market Value (USD Million) Forecast 2020-2035
  • Figure 3: Global Market Value Share and BPS Analysis by Component , 2025 and 2035
  • Figure 4: Global Market Y-o-Y Growth Comparison by Component , 2025-2035
  • Figure 5: Global Market Attractiveness Analysis by Component
  • Figure 6: Global Market Value Share and BPS Analysis by Deployment Mode, 2025 and 2035
  • Figure 7: Global Market Y-o-Y Growth Comparison by Deployment Mode, 2025-2035
  • Figure 8: Global Market Attractiveness Analysis by Deployment Mode
  • Figure 9: Global Market Value Share and BPS Analysis by Organization Size, 2025 and 2035
  • Figure 10: Global Market Y-o-Y Growth Comparison by Organization Size, 2025-2035
  • Figure 11: Global Market Attractiveness Analysis by Organization Size
  • Figure 12: Global Market Value Share and BPS Analysis by Technology, 2025 and 2035
  • Figure 13: Global Market Y-o-Y Growth Comparison by Technology, 2025-2035
  • Figure 14: Global Market Attractiveness Analysis by Technology
  • Figure 15: Global Market Value Share and BPS Analysis by Vertical, 2025 and 2035
  • Figure 16: Global Market Y-o-Y Growth Comparison by Vertical, 2025-2035
  • Figure 17: Global Market Attractiveness Analysis by Vertical
  • Figure 18: Global Market Value Share and BPS Analysis by Application, 2025 and 2035
  • Figure 19: Global Market Y-o-Y Growth Comparison by Application, 2025-2035
  • Figure 20: Global Market Attractiveness Analysis by Application
  • Figure 21: Global Market Value (USD Million) Share and BPS Analysis by Region, 2025 and 2035
  • Figure 22: Global Market Y-o-Y Growth Comparison by Region, 2025-2035
  • Figure 23: Global Market Attractiveness Analysis by Region
  • Figure 24: North America Market Incremental Dollar Opportunity, 2025-2035
  • Figure 25: Latin America Market Incremental Dollar Opportunity, 2025-2035
  • Figure 26: Western Europe Market Incremental Dollar Opportunity, 2025-2035
  • Figure 27: Eastern Europe Market Incremental Dollar Opportunity, 2025-2035
  • Figure 28: East Asia Market Incremental Dollar Opportunity, 2025-2035
  • Figure 29: South Asia and Pacific Market Incremental Dollar Opportunity, 2025-2035
  • Figure 30: Middle East & Africa Market Incremental Dollar Opportunity, 2025-2035
  • Figure 31: North America Market Value Share and BPS Analysis by Country, 2025 and 2035
  • Figure 32: North America Market Value Share and BPS Analysis by Component , 2025 and 2035
  • Figure 33: North America Market Y-o-Y Growth Comparison by Component , 2025-2035
  • Figure 34: North America Market Attractiveness Analysis by Component
  • Figure 35: North America Market Value Share and BPS Analysis by Deployment Mode, 2025 and 2035
  • Figure 36: North America Market Y-o-Y Growth Comparison by Deployment Mode, 2025-2035
  • Figure 37: North America Market Attractiveness Analysis by Deployment Mode
  • Figure 38: North America Market Value Share and BPS Analysis by Organization Size, 2025 and 2035
  • Figure 39: North America Market Y-o-Y Growth Comparison by Organization Size, 2025-2035
  • Figure 40: North America Market Attractiveness Analysis by Organization Size
  • Figure 41: North America Market Value Share and BPS Analysis by Technology, 2025 and 2035
  • Figure 42: North America Market Y-o-Y Growth Comparison by Technology, 2025-2035
  • Figure 43: North America Market Attractiveness Analysis by Technology
  • Figure 44: North America Market Value Share and BPS Analysis by Vertical, 2025 and 2035
  • Figure 45: North America Market Y-o-Y Growth Comparison by Vertical, 2025-2035
  • Figure 46: North America Market Attractiveness Analysis by Vertical
  • Figure 47: North America Market Value Share and BPS Analysis by Application, 2025 and 2035
  • Figure 48: North America Market Y-o-Y Growth Comparison by Application, 2025-2035
  • Figure 49: North America Market Attractiveness Analysis by Application
  • Figure 50: Latin America Market Value Share and BPS Analysis by Country, 2025 and 2035
  • Figure 51: Latin America Market Value Share and BPS Analysis by Component , 2025 and 2035
  • Figure 52: Latin America Market Y-o-Y Growth Comparison by Component , 2025-2035
  • Figure 53: Latin America Market Attractiveness Analysis by Component
  • Figure 54: Latin America Market Value Share and BPS Analysis by Deployment Mode, 2025 and 2035
  • Figure 55: Latin America Market Y-o-Y Growth Comparison by Deployment Mode, 2025-2035
  • Figure 56: Latin America Market Attractiveness Analysis by Deployment Mode
  • Figure 57: Latin America Market Value Share and BPS Analysis by Organization Size, 2025 and 2035
  • Figure 58: Latin America Market Y-o-Y Growth Comparison by Organization Size, 2025-2035
  • Figure 59: Latin America Market Attractiveness Analysis by Organization Size
  • Figure 60: Latin America Market Value Share and BPS Analysis by Technology, 2025 and 2035
  • Figure 61: Latin America Market Y-o-Y Growth Comparison by Technology, 2025-2035
  • Figure 62: Latin America Market Attractiveness Analysis by Technology
  • Figure 63: Latin America Market Value Share and BPS Analysis by Vertical, 2025 and 2035
  • Figure 64: Latin America Market Y-o-Y Growth Comparison by Vertical, 2025-2035
  • Figure 65: Latin America Market Attractiveness Analysis by Vertical
  • Figure 66: Latin America Market Value Share and BPS Analysis by Application, 2025 and 2035
  • Figure 67: Latin America Market Y-o-Y Growth Comparison by Application, 2025-2035
  • Figure 68: Latin America Market Attractiveness Analysis by Application
  • Figure 69: Western Europe Market Value Share and BPS Analysis by Country, 2025 and 2035
  • Figure 70: Western Europe Market Value Share and BPS Analysis by Component , 2025 and 2035
  • Figure 71: Western Europe Market Y-o-Y Growth Comparison by Component , 2025-2035
  • Figure 72: Western Europe Market Attractiveness Analysis by Component
  • Figure 73: Western Europe Market Value Share and BPS Analysis by Deployment Mode, 2025 and 2035
  • Figure 74: Western Europe Market Y-o-Y Growth Comparison by Deployment Mode, 2025-2035
  • Figure 75: Western Europe Market Attractiveness Analysis by Deployment Mode
  • Figure 76: Western Europe Market Value Share and BPS Analysis by Organization Size, 2025 and 2035
  • Figure 77: Western Europe Market Y-o-Y Growth Comparison by Organization Size, 2025-2035
  • Figure 78: Western Europe Market Attractiveness Analysis by Organization Size
  • Figure 79: Western Europe Market Value Share and BPS Analysis by Technology, 2025 and 2035
  • Figure 80: Western Europe Market Y-o-Y Growth Comparison by Technology, 2025-2035
  • Figure 81: Western Europe Market Attractiveness Analysis by Technology
  • Figure 82: Western Europe Market Value Share and BPS Analysis by Vertical, 2025 and 2035
  • Figure 83: Western Europe Market Y-o-Y Growth Comparison by Vertical, 2025-2035
  • Figure 84: Western Europe Market Attractiveness Analysis by Vertical
  • Figure 85: Western Europe Market Value Share and BPS Analysis by Application, 2025 and 2035
  • Figure 86: Western Europe Market Y-o-Y Growth Comparison by Application, 2025-2035
  • Figure 87: Western Europe Market Attractiveness Analysis by Application
  • Figure 88: Eastern Europe Market Value Share and BPS Analysis by Country, 2025 and 2035
  • Figure 89: Eastern Europe Market Value Share and BPS Analysis by Component , 2025 and 2035
  • Figure 90: Eastern Europe Market Y-o-Y Growth Comparison by Component , 2025-2035
  • Figure 91: Eastern Europe Market Attractiveness Analysis by Component
  • Figure 92: Eastern Europe Market Value Share and BPS Analysis by Deployment Mode, 2025 and 2035
  • Figure 93: Eastern Europe Market Y-o-Y Growth Comparison by Deployment Mode, 2025-2035
  • Figure 94: Eastern Europe Market Attractiveness Analysis by Deployment Mode
  • Figure 95: Eastern Europe Market Value Share and BPS Analysis by Organization Size, 2025 and 2035
  • Figure 96: Eastern Europe Market Y-o-Y Growth Comparison by Organization Size, 2025-2035
  • Figure 97: Eastern Europe Market Attractiveness Analysis by Organization Size
  • Figure 98: Eastern Europe Market Value Share and BPS Analysis by Technology, 2025 and 2035
  • Figure 99: Eastern Europe Market Y-o-Y Growth Comparison by Technology, 2025-2035
  • Figure 100: Eastern Europe Market Attractiveness Analysis by Technology
  • Figure 101: Eastern Europe Market Value Share and BPS Analysis by Vertical, 2025 and 2035
  • Figure 102: Eastern Europe Market Y-o-Y Growth Comparison by Vertical, 2025-2035
  • Figure 103: Eastern Europe Market Attractiveness Analysis by Vertical
  • Figure 104: Eastern Europe Market Value Share and BPS Analysis by Application, 2025 and 2035
  • Figure 105: Eastern Europe Market Y-o-Y Growth Comparison by Application, 2025-2035
  • Figure 106: Eastern Europe Market Attractiveness Analysis by Application
  • Figure 107: East Asia Market Value Share and BPS Analysis by Country, 2025 and 2035
  • Figure 108: East Asia Market Value Share and BPS Analysis by Component , 2025 and 2035
  • Figure 109: East Asia Market Y-o-Y Growth Comparison by Component , 2025-2035
  • Figure 110: East Asia Market Attractiveness Analysis by Component
  • Figure 111: East Asia Market Value Share and BPS Analysis by Deployment Mode, 2025 and 2035
  • Figure 112: East Asia Market Y-o-Y Growth Comparison by Deployment Mode, 2025-2035
  • Figure 113: East Asia Market Attractiveness Analysis by Deployment Mode
  • Figure 114: East Asia Market Value Share and BPS Analysis by Organization Size, 2025 and 2035
  • Figure 115: East Asia Market Y-o-Y Growth Comparison by Organization Size, 2025-2035
  • Figure 116: East Asia Market Attractiveness Analysis by Organization Size
  • Figure 117: East Asia Market Value Share and BPS Analysis by Technology, 2025 and 2035
  • Figure 118: East Asia Market Y-o-Y Growth Comparison by Technology, 2025-2035
  • Figure 119: East Asia Market Attractiveness Analysis by Technology
  • Figure 120: East Asia Market Value Share and BPS Analysis by Vertical, 2025 and 2035
  • Figure 121: East Asia Market Y-o-Y Growth Comparison by Vertical, 2025-2035
  • Figure 122: East Asia Market Attractiveness Analysis by Vertical
  • Figure 123: East Asia Market Value Share and BPS Analysis by Application, 2025 and 2035
  • Figure 124: East Asia Market Y-o-Y Growth Comparison by Application, 2025-2035
  • Figure 125: East Asia Market Attractiveness Analysis by Application
  • Figure 126: South Asia and Pacific Market Value Share and BPS Analysis by Country, 2025 and 2035
  • Figure 127: South Asia and Pacific Market Value Share and BPS Analysis by Component , 2025 and 2035
  • Figure 128: South Asia and Pacific Market Y-o-Y Growth Comparison by Component , 2025-2035
  • Figure 129: South Asia and Pacific Market Attractiveness Analysis by Component
  • Figure 130: South Asia and Pacific Market Value Share and BPS Analysis by Deployment Mode, 2025 and 2035
  • Figure 131: South Asia and Pacific Market Y-o-Y Growth Comparison by Deployment Mode, 2025-2035
  • Figure 132: South Asia and Pacific Market Attractiveness Analysis by Deployment Mode
  • Figure 133: South Asia and Pacific Market Value Share and BPS Analysis by Organization Size, 2025 and 2035
  • Figure 134: South Asia and Pacific Market Y-o-Y Growth Comparison by Organization Size, 2025-2035
  • Figure 135: South Asia and Pacific Market Attractiveness Analysis by Organization Size
  • Figure 136: South Asia and Pacific Market Value Share and BPS Analysis by Technology, 2025 and 2035
  • Figure 137: South Asia and Pacific Market Y-o-Y Growth Comparison by Technology, 2025-2035
  • Figure 138: South Asia and Pacific Market Attractiveness Analysis by Technology
  • Figure 139: South Asia and Pacific Market Value Share and BPS Analysis by Vertical, 2025 and 2035
  • Figure 140: South Asia and Pacific Market Y-o-Y Growth Comparison by Vertical, 2025-2035
  • Figure 141: South Asia and Pacific Market Attractiveness Analysis by Vertical
  • Figure 142: South Asia and Pacific Market Value Share and BPS Analysis by Application, 2025 and 2035
  • Figure 143: South Asia and Pacific Market Y-o-Y Growth Comparison by Application, 2025-2035
  • Figure 144: South Asia and Pacific Market Attractiveness Analysis by Application
  • Figure 145: Middle East & Africa Market Value Share and BPS Analysis by Country, 2025 and 2035
  • Figure 146: Middle East & Africa Market Value Share and BPS Analysis by Component , 2025 and 2035
  • Figure 147: Middle East & Africa Market Y-o-Y Growth Comparison by Component , 2025-2035
  • Figure 148: Middle East & Africa Market Attractiveness Analysis by Component
  • Figure 149: Middle East & Africa Market Value Share and BPS Analysis by Deployment Mode, 2025 and 2035
  • Figure 150: Middle East & Africa Market Y-o-Y Growth Comparison by Deployment Mode, 2025-2035
  • Figure 151: Middle East & Africa Market Attractiveness Analysis by Deployment Mode
  • Figure 152: Middle East & Africa Market Value Share and BPS Analysis by Organization Size, 2025 and 2035
  • Figure 153: Middle East & Africa Market Y-o-Y Growth Comparison by Organization Size, 2025-2035
  • Figure 154: Middle East & Africa Market Attractiveness Analysis by Organization Size
  • Figure 155: Middle East & Africa Market Value Share and BPS Analysis by Technology, 2025 and 2035
  • Figure 156: Middle East & Africa Market Y-o-Y Growth Comparison by Technology, 2025-2035
  • Figure 157: Middle East & Africa Market Attractiveness Analysis by Technology
  • Figure 158: Middle East & Africa Market Value Share and BPS Analysis by Vertical, 2025 and 2035
  • Figure 159: Middle East & Africa Market Y-o-Y Growth Comparison by Vertical, 2025-2035
  • Figure 160: Middle East & Africa Market Attractiveness Analysis by Vertical
  • Figure 161: Middle East & Africa Market Value Share and BPS Analysis by Application, 2025 and 2035
  • Figure 162: Middle East & Africa Market Y-o-Y Growth Comparison by Application, 2025-2035
  • Figure 163: Middle East & Africa Market Attractiveness Analysis by Application
  • Figure 164: Global Market - Tier Structure Analysis
  • Figure 165: Global Market - Company Share Analysis
Dashboard
Dashboard
Dashboard
Dashboard
Dashboard
Dashboard

Full Research Suite comprises of:

Market outlook & trends analysis

Market outlook & trends analysis

Interviews & case studies

Interviews & case studies

Strategic recommendations

Strategic recommendations

Vendor profiles & capabilities analysis

Vendor profiles & capabilities analysis

5-year forecasts

5-year forecasts

8 regions and 60+ country-level data splits

8 regions and 60+ country-level data splits

Market segment data splits

Market segment data splits

12 months of continuous data updates

12 months of continuous data updates

DELIVERED AS:

PDF EXCEL ONLINE

Full Research Suite


$5000

$7500

$10000

Buy Report Now
Similar Industry Reports

Similar Industry Reports

Blockchain Interoperability Market

Blockchain Interoperability Market Size and Share Forecast Outlook 2025 to 2035

Blockchain Food Traceability Market

Blockchain Food Traceability Market Size and Share Forecast Outlook 2025 to 2035

Blockchain Messaging Apps Market

Blockchain Messaging Apps Market Size and Share Forecast Outlook 2025 to 2035

Blockchain in Logistics Market

Blockchain in Logistics Market Size and Share Forecast Outlook 2025 to 2035

Blockchain Market
Blockchain Market

Blockchain Market Size and Share Forecast Outlook 2025 to 2035

Blockchain in Energy Market

Blockchain in Energy Market Size and Share Forecast Outlook 2025 to 2035

Blockchain Identity Management Market

Blockchain Identity Management Market Size and Share Forecast Outlook 2025 to 2035

Blockchain in Agriculture and Food Supply Chain Market

Blockchain in Agriculture and Food Supply Chain Market Size and Share Forecast Outlook 2025 to 2035

Blockchain Technology Market

Blockchain Technology Market Analysis & Forecast 2025 to 2035, By Solution, Use Case, Enterprise Size, Industry, and Region

Blockchain in Banking Market

Blockchain in Banking Market

Blockchain in Agriculture Market

Blockchain in Agriculture Market Analysis – Size, Share & Forecast 2024-2034

Managed Blockchain Services Market

Managed Blockchain Services Market Size and Share Forecast Outlook 2025 to 2035

Web 3.0 Blockchain Market

Web 3.0 Blockchain Market Report – Growth, Demand & Forecast 2024-2034

Automotive Blockchain Market

Automotive Blockchain Market Size and Share Forecast Outlook 2025 to 2035

AI-powered Spinal Surgery Market

AI-powered Spinal Surgery Market Size and Share Forecast Outlook 2025 to 2035

AI-Powered Sleep Technologies Market

AI-Powered Sleep Technologies Market Size and Share Forecast Outlook 2025 to 2035

AI-Powered Gait & Mobility Analytics Market

AI-Powered Gait & Mobility Analytics Market Size and Share Forecast Outlook 2025 to 2035

AI-Powered Behavioral Therapy Market

AI-Powered Behavioral Therapy Market Size and Share Forecast Outlook 2025 to 2035

AI-Enabled Behavioral Therapy Market

AI-Enabled Behavioral Therapy Market Size and Share Forecast Outlook 2025 to 2035

AI-powered In-car Assistant Market

AI-powered In-car Assistant Market Forecast and Outlook 2025 to 2035

Future Market Insights

Blockchain AI Market

Chat With MaRIA

Chat With

MaRIA

Hi There, I am MaRIA, Your Market Research Intelligence Assistant. How may I help you?