Automatic Filling Machine Market Outlook

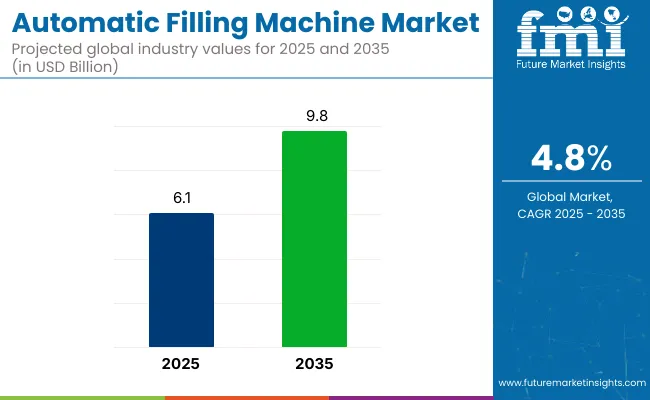
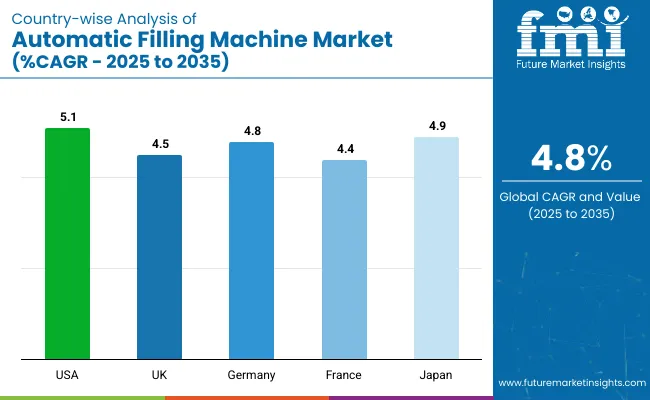
The automatic filling machine market is anticipated to flourish at an average CAGR of 4.8% between 2023 and 2033. The market is expected to hold a market share of US$ 8.88 billion by 2033, while the market is likely to reach a value of US$ 5.56 billion in 2023.

Attribute Details
Automatic Filling Machine Market CAGR (2023 to 2033) 4.8%
Automatic Filling Machine Market Size (2023) US$ 5.56 billion
Automatic Filling Machine Market Size (2033) US$ 8.88 billion

These machines are gaining high traction in the market as automatic filling machines are equipment used for filling solid, semi-solid, and liquid products in holding containers such as pouches, bags, bottles, and boxes.

The packaging industry is identified to witness skyrocketing growth over the past couple of years. Amidst this expansion, the introduction of versatile packaging, like the automatic filling machines, replacing the semi-automatic filling machines by manufacturers, is capturing the attention of consumers looking for next-gen machinery. Therefore, it is anticipated that the automatic filling machine market is likely to have substantial growth over the forecast period.

Don't pay for what you don't need

Customize your report by selecting specific countries or regions and save 30%!

What Are The Key Driving and Curbing Factors Identified in The Automatic Filling Machine Market?

It is expected that the market for automatic filling machines is likely to have considerable demand in the upcoming years due to several fueling factors. FMI also pours some light on the deterring factors identified during the analysis and provides in-depth insights into the automatic filling machines market.

Major Drivers

  • Growing Demand for FMCG and Pharma Products

Growth in the demand for fast-moving consumer goods and pharmaceutical products has led manufacturers to increase the speed of their lines. Hence, there is an increasing need for filling machines that enable rapid filling of the material while maintaining the accuracy of volume and weight in the containers.

  • Consumer Demand for Efficiency and Hygiene

It is identified that aseptic packaging continues to pick pace due to rising consumer awareness for healthy and sterile products, which is steering the manufacturers to put efforts towards aseptic filling machines.

  • Convenient Packaging Solution and Automation

The demand for convenient packaging of food has spawned miniaturized packing across the globe, and production line automation enables packaging solution providers to leverage ingenuity and efficiency. Therefore, achievable consistency is boosting the automatic filling machine market growth.

Key Restraints:

  • High Cost

It is expected that the high cost associated with automatic filling machines is likely to impede market growth. The atomization of equipment using programmable logic controllers, the use of software, and feedback systems raise the cost.

  • Expensive Aseptic Filling

Some of the food and beverages require aseptic filling machines that are more expensive than the other automatic filling machines available in the market.

Country-wise Insights

Countries Revenue Share % (2022)
United States 20.7%
Germany 4.9%
Japan 5.7%
Australia 0.8%
Countries CAGR % (2023 to 2033)
China 5.6%
India 6.2%
United Kingdom 3.6%

North America Market Dynamics for Automatic Filling Machines Market

It is projected that the North American region is going to hold the highest share of the automatic filling machine market and is likely to dominate the global forum in the upcoming years. Currently, North America is accountable for 25% of the total market share of automatic filling machines. The United States itself held a market share of 20.7% in 2022.

Owing to the rise of the pharmaceutical industry in this region, automatic filling machines are highly gaining momentum due to their use in filling liquid medicine bottles, vials, capsules, and ampules.

The region has been following the process of atomization in the past few years, which has led to benefits from the reduced timeline in assembly and higher growth of the market players in North America.

Growth Outlook of Europe in the Automatic Filling Machine Market

Europe is anticipated to follow the North American market and have significant growth during the forecast period. Germany held a market share of 4.9% in 2022.

The region’s considerable share is accredited to the growing use of automatic filling machines in different industry enterprises that are reducing the use of semi-automated machines owing to ease up the process and lowering down labor costs. Additionally, favorable government policies are boosting market growth in the European regions.

Nikhil Kaitwade
Nikhil Kaitwade

Principal Consultant

Talk to Analyst

Find your sweet spots for generating winning opportunities in this market.

Category-based Analysis

Category Leading Segment
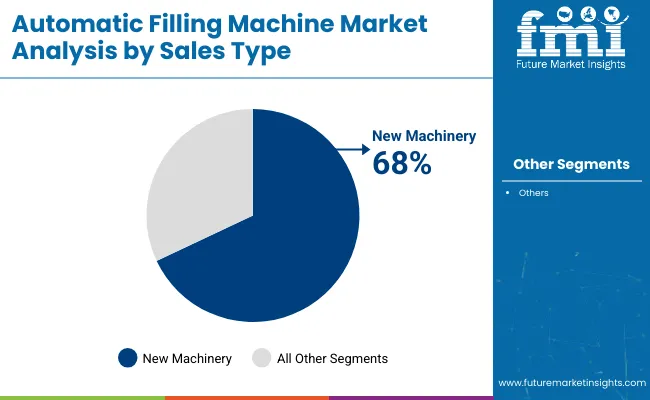
By Sales Type New Machinery
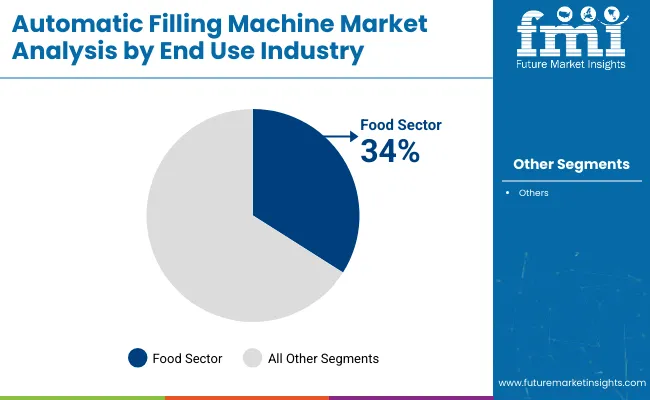
By End-use Industry Beverage
Category Market Share% (2022)
By Sales Type 73.5%
By End-use Industry 42.2%

Start-up Ecosystem

The new entrants to the automatic filling machines market are indulging in collaborations and continually making innovations to the filling machines to further fuel the adoption of this equipment in the different industry verticals.

The Beumer Group is developing automatic filling machines that may deliver high performance to end users. The unusual flow behavior of the products and high temperatures make innovative filling techniques a necessity.

Therefore, BEUMER, in close cooperation with the manufacturers, has developed the BEUMER fillpac FFS. The filling modules are arranged in a circle similar to an advertising column which may help in easy management and increase operational efficiency.

Some other start-up companies are Mettler Toledo, IPI Srl, and more.

Get the data you need at a Fraction of the cost

Personalize your report by choosing insights you need
and save 40%!

Competitive Landscape

Biggies Revolutionizing the Automatic Filling Machine Market

The preference for automatic filling machines has stirred innovations in the filling machines market. High productivity and enhanced quality of process remain vital factors that need to be addressed by filling machine market players. They are indulging in mergers & acquisitions and deploying strategies to bolster the market growth for this product.

Strategy 1: Global Expansion Strategy

The manufacturers are expanding their business in the key countries of the Asia Pacific, which serve as a hub of opportunities for the filling machines market players. Technological advancement and high-quality packaging solutions are being offered by Germany. Filling machine providers such as SIG are considering collaborations with end users in the Asia Pacific, extending their supply landscape.

Strategy 2: Development and Procurement of Enhanced Automatic Filling Machines

Filling machine manufacturers have concentrated their efforts on portfolio expansion and product differentiation. As the filling machines market involves the participation of various manufacturers, emphasis on offering consumers improved products remains essential. Along with this, the transforming packaging landscape and trends shaping the packaging industry stay the focal point of manufacturers.

Recent Developments

  • In December 2017, GEA launched an aseptic filling machine called Fillstar CX EVO. This multi-functioning system allows the beverage industry to easily change between different types of products, from aseptic beverages to carbonated ones and vice-versa.
  • Bosch Packaging Technology’s filling and closing machine AFG 5000 recently received an internationally-renowned 'Red Dot Award' from the Design Zentrum Nordrhein-Westfalen in the product design category based on criterions such as formal quality, degree of innovation, ergonomics, and durability, and functionality.
  • Sacmi Filling S.p.A. unveiled the new Sacmi high-speed filling line, which played a critical role in the company's stand at China Brew and Beverage, a popular international brew & beverage processing technology fair in Asia (Shanghai New International Expo Centre, October 23 to 26, 2018). The new filling machines range offers high productivity, outstanding process quality, and flexibility and has been configured for an output rate of up to 72,000 bottles/hour.
  • Ronchi Mario S.p.A has introduced its filling machines with modern features added. The product offers flexibility, ease to use dynamic, rapid changeover, and automated cleaning/washing operations.
  • GEA Group Aktiengesellschaft has introduced the filler fillstar LXf, a rotary volumetric filling system for still drinks, and electronic control valves.

Key Players

  • Accutek Packaging Equipment Companies, Inc.
  • Coesia S.p.A
  • GEA Group Aktiengesellschaft
  • JBT
  • Krones AG
  • Ronchi Mario S.p.A
  • Salzgitter AG (KHS Group)
  • Scholle IPN
  • Syntegon Technology GmbH
  • Tetra Laval International S.A.

Key Segments Covered

By Sales Type:

  • New Machinery
  • Spare Parts

By Product Type:

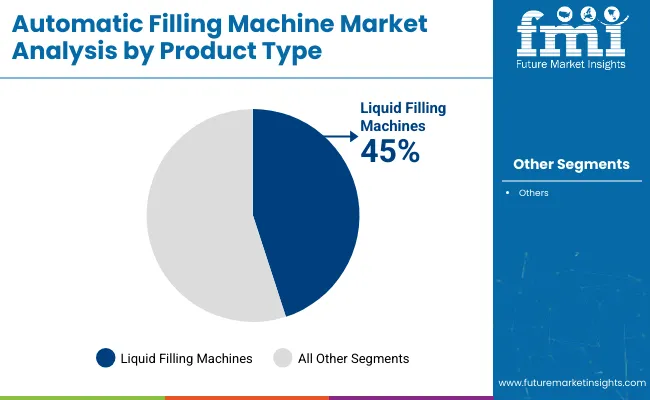
  • Solid
  • Semi-solid
  • Liquid

By End-user Industry:

  • Food
  • Beverage
  • Pharmaceutical
  • Personal Care
  • Chemical
  • Others

Key Regions Covered:

  • North America
    • United States
    • Canada
  • Latin America
    • Brazil
    • Mexico
    • Rest of Latin America
  • Europe
    • Germany
    • United Kingdom
    • France
    • Spain
    • Russia
    • Rest of Europe
  • Japan
  • Asia Pacific Excluding Japan
    • China
    • India
    • Malaysia
    • Singapore
    • Australia
    • Rest of Asia Pacific Excluding Japan (APEJ)
  • Middle East and Africa
    • GCC Countries
    • Israel
    • South Africa
    • The Middle East and Africa (MEA)

Frequently Asked Questions

What will be the Global Automatic Filling Machine Market Progress Rate?

The global demand for automatic filling machines is forecasted to grow at 4.8% through 2033.

What is the Global Automatic Filling Machine Market Size Growth Potential?

The net worth of the global market might reach about US$ 8.88 billion by 2033.

Which is the Dominant Regional Market for Automatic Filling Machines?

The United States dominates the overall market and acquired around 20.7% share in 2022.

What is the Outlook for India Automatic Filling Machine Market?

The overall market in India is projected to grow at 6.2% per year until 2033.

Which is the Dominant End Use Industry Segment for Global Automatic Filling Machine Market?

The demand for automatic filling machines had 42.2% market share in 2022.

Table of Content
1. Executive Summary
    1.1. Global Market Outlook
    1.2. Demand-side Trends
    1.3. Supply-side Trends
    1.4. Technology Roadmap Analysis
    1.5. Analysis and Recommendations
2. Market Overview
    2.1. Market Coverage / Taxonomy
    2.2. Market Definition / Scope / Limitations
3. Market Background
    3.1. Market Dynamics
        3.1.1. Drivers
        3.1.2. Restraints
        3.1.3. Opportunity
        3.1.4. Trends
    3.2. Scenario Forecast
        3.2.1. Demand in Optimistic Scenario
        3.2.2. Demand in Likely Scenario
        3.2.3. Demand in Conservative Scenario
    3.3. Opportunity Map Analysis
    3.4. Product Life Cycle Analysis
    3.5. Supply Chain Analysis
        3.5.1. Supply Side Participants and their Roles
            3.5.1.1. Producers
            3.5.1.2. Mid-Level Participants (Traders/ Agents/ Brokers)
            3.5.1.3. Wholesalers and Distributors
        3.5.2. Value Added and Value Created at Node in the Supply Chain
        3.5.3. List of Raw Material Suppliers
        3.5.4. List of Existing and Potential Buyer’s
    3.6. Investment Feasibility Matrix
    3.7. Value Chain Analysis
        3.7.1. Profit Margin Analysis
        3.7.2. Wholesalers and Distributors
        3.7.3. Retailers
    3.8. PESTLE and Porter’s Analysis
    3.9. Regulatory Landscape
        3.9.1. By Key Regions
        3.9.2. By Key Countries
    3.10. Regional Parent Market Outlook
    3.11. Production and Consumption Statistics
    3.12. Import and Export Statistics
4. Global Market Analysis 2018 to 2022 and Forecast, 2023 to 2033
    4.1. Historical Market Size Value (US$ Million) & Volume (Units) Analysis, 2018 to 2022
    4.2. Current and Future Market Size Value (US$ Million) & Volume (Units) Projections, 2023 to 2033
        4.2.1. Y-o-Y Growth Trend Analysis
        4.2.2. Absolute $ Opportunity Analysis
5. Global Market Analysis 2018 to 2022 and Forecast 2023 to 2033, By Sales Type
    5.1. Introduction / Key Findings
    5.2. Historical Market Size Value (US$ Million) & Volume (Units) Analysis By Sales Type, 2018 to 2022
    5.3. Current and Future Market Size Value (US$ Million) & Volume (Units) Analysis and Forecast By Sales Type, 2023 to 2033
        5.3.1. New Machinery
        5.3.2. Spare Parts
    5.4. Y-o-Y Growth Trend Analysis By Sales Type, 2018 to 2022
    5.5. Absolute $ Opportunity Analysis By Sales Type, 2023 to 2033
6. Global Market Analysis 2018 to 2022 and Forecast 2023 to 2033, By Product Type
    6.1. Introduction / Key Findings
    6.2. Historical Market Size Value (US$ Million) & Volume (Units) Analysis By Product Type, 2018 to 2022
    6.3. Current and Future Market Size Value (US$ Million) & Volume (Units) Analysis and Forecast By Product Type, 2023 to 2033
        6.3.1. Solid
        6.3.2. Semi-solid
        6.3.3. Liquid
    6.4. Y-o-Y Growth Trend Analysis By Product Type, 2018 to 2022
    6.5. Absolute $ Opportunity Analysis By Product Type, 2023 to 2033
7. Global Market Analysis 2018 to 2022 and Forecast 2023 to 2033, By End-user Industry
    7.1. Introduction / Key Findings
    7.2. Historical Market Size Value (US$ Million) & Volume (Units) Analysis By End-user Industry, 2018 to 2022
    7.3. Current and Future Market Size Value (US$ Million) & Volume (Units) Analysis and Forecast By End-user Industry, 2023 to 2033
        7.3.1. Food
        7.3.2. Beverage
        7.3.3. Pharmaceutical
        7.3.4. Personal Care
        7.3.5. Chemical
        7.3.6. Others
    7.4. Y-o-Y Growth Trend Analysis By End-user Industry, 2018 to 2022
    7.5. Absolute $ Opportunity Analysis By End-user Industry, 2023 to 2033
8. Global Market Analysis 2018 to 2022 and Forecast 2023 to 2033, By Region
    8.1. Introduction
    8.2. Historical Market Size Value (US$ Million) & Volume (Units) Analysis By Region, 2018 to 2022
    8.3. Current Market Size Value (US$ Million) & Volume (Units) Analysis and Forecast By Region, 2023 to 2033
        8.3.1. North America
        8.3.2. Latin America
        8.3.3. Western Europe
        8.3.4. Eastern Europe
        8.3.5. South Asia and Pacific
        8.3.6. East Asia
        8.3.7. Middle East and Africa
    8.4. Market Attractiveness Analysis By Region
9. North America Market Analysis 2018 to 2022 and Forecast 2023 to 2033, By Country
    9.1. Historical Market Size Value (US$ Million) & Volume (Units) Trend Analysis By Market Taxonomy, 2018 to 2022
    9.2. Market Size Value (US$ Million) & Volume (Units) Forecast By Market Taxonomy, 2023 to 2033
        9.2.1. By Country
            9.2.1.1. The USA
            9.2.1.2. Canada
        9.2.2. By Sales Type
        9.2.3. By Product Type
        9.2.4. By End-user Industry
    9.3. Market Attractiveness Analysis
        9.3.1. By Country
        9.3.2. By Sales Type
        9.3.3. By Product Type
        9.3.4. By End-user Industry
    9.4. Key Takeaways
10. Latin America Market Analysis 2018 to 2022 and Forecast 2023 to 2033, By Country
    10.1. Historical Market Size Value (US$ Million) & Volume (Units) Trend Analysis By Market Taxonomy, 2018 to 2022
    10.2. Market Size Value (US$ Million) & Volume (Units) Forecast By Market Taxonomy, 2023 to 2033
        10.2.1. By Country
            10.2.1.1. Brazil
            10.2.1.2. Mexico
            10.2.1.3. Rest of Latin America
        10.2.2. By Sales Type
        10.2.3. By Product Type
        10.2.4. By End-user Industry
    10.3. Market Attractiveness Analysis
        10.3.1. By Country
        10.3.2. By Sales Type
        10.3.3. By Product Type
        10.3.4. By End-user Industry
    10.4. Key Takeaways
11. Western Europe Market Analysis 2018 to 2022 and Forecast 2023 to 2033, By Country
    11.1. Historical Market Size Value (US$ Million) & Volume (Units) Trend Analysis By Market Taxonomy, 2018 to 2022
    11.2. Market Size Value (US$ Million) & Volume (Units) Forecast By Market Taxonomy, 2023 to 2033
        11.2.1. By Country
            11.2.1.1. Germany
            11.2.1.2. United Kingdom
            11.2.1.3. France
            11.2.1.4. Spain
            11.2.1.5. Italy
            11.2.1.6. Rest of Western Europe
        11.2.2. By Sales Type
        11.2.3. By Product Type
        11.2.4. By End-user Industry
    11.3. Market Attractiveness Analysis
        11.3.1. By Country
        11.3.2. By Sales Type
        11.3.3. By Product Type
        11.3.4. By End-user Industry
    11.4. Key Takeaways
12. Eastern Europe Market Analysis 2018 to 2022 and Forecast 2023 to 2033, By Country
    12.1. Historical Market Size Value (US$ Million) & Volume (Units) Trend Analysis By Market Taxonomy, 2018 to 2022
    12.2. Market Size Value (US$ Million) & Volume (Units) Forecast By Market Taxonomy, 2023 to 2033
        12.2.1. By Country
            12.2.1.1. Poland
            12.2.1.2. Russia
            12.2.1.3. Czech Republic
            12.2.1.4. Romania
            12.2.1.5. Rest of Eastern Europe
        12.2.2. By Sales Type
        12.2.3. By Product Type
        12.2.4. By End-user Industry
    12.3. Market Attractiveness Analysis
        12.3.1. By Country
        12.3.2. By Sales Type
        12.3.3. By Product Type
        12.3.4. By End-user Industry
    12.4. Key Takeaways
13. South Asia and Pacific Market Analysis 2018 to 2022 and Forecast 2023 to 2033, By Country
    13.1. Historical Market Size Value (US$ Million) & Volume (Units) Trend Analysis By Market Taxonomy, 2018 to 2022
    13.2. Market Size Value (US$ Million) & Volume (Units) Forecast By Market Taxonomy, 2023 to 2033
        13.2.1. By Country
            13.2.1.1. India
            13.2.1.2. Bangladesh
            13.2.1.3. Australia
            13.2.1.4. New Zealand
            13.2.1.5. Rest of South Asia and Pacific
        13.2.2. By Sales Type
        13.2.3. By Product Type
        13.2.4. By End-user Industry
    13.3. Market Attractiveness Analysis
        13.3.1. By Country
        13.3.2. By Sales Type
        13.3.3. By Product Type
        13.3.4. By End-user Industry
    13.4. Key Takeaways
14. East Asia Market Analysis 2018 to 2022 and Forecast 2023 to 2033, By Country
    14.1. Historical Market Size Value (US$ Million) & Volume (Units) Trend Analysis By Market Taxonomy, 2018 to 2022
    14.2. Market Size Value (US$ Million) & Volume (Units) Forecast By Market Taxonomy, 2023 to 2033
        14.2.1. By Country
            14.2.1.1. China
            14.2.1.2. Japan
            14.2.1.3. South Korea
        14.2.2. By Sales Type
        14.2.3. By Product Type
        14.2.4. By End-user Industry
    14.3. Market Attractiveness Analysis
        14.3.1. By Country
        14.3.2. By Sales Type
        14.3.3. By Product Type
        14.3.4. By End-user Industry
    14.4. Key Takeaways
15. Middle East and Africa Market Analysis 2018 to 2022 and Forecast 2023 to 2033, By Country
    15.1. Historical Market Size Value (US$ Million) & Volume (Units) Trend Analysis By Market Taxonomy, 2018 to 2022
    15.2. Market Size Value (US$ Million) & Volume (Units) Forecast By Market Taxonomy, 2023 to 2033
        15.2.1. By Country
            15.2.1.1. GCC Countries
            15.2.1.2. South Africa
            15.2.1.3. Israel
            15.2.1.4. Rest of MEA
        15.2.2. By Sales Type
        15.2.3. By Product Type
        15.2.4. By End-user Industry
    15.3. Market Attractiveness Analysis
        15.3.1. By Country
        15.3.2. By Sales Type
        15.3.3. By Product Type
        15.3.4. By End-user Industry
    15.4. Key Takeaways
16. Key Countries Market Analysis
    16.1. USA
        16.1.1. Pricing Analysis
        16.1.2. Market Share Analysis, 2022
            16.1.2.1. By Sales Type
            16.1.2.2. By Product Type
            16.1.2.3. By End-user Industry
    16.2. Canada
        16.2.1. Pricing Analysis
        16.2.2. Market Share Analysis, 2022
            16.2.2.1. By Sales Type
            16.2.2.2. By Product Type
            16.2.2.3. By End-user Industry
    16.3. Brazil
        16.3.1. Pricing Analysis
        16.3.2. Market Share Analysis, 2022
            16.3.2.1. By Sales Type
            16.3.2.2. By Product Type
            16.3.2.3. By End-user Industry
    16.4. Mexico
        16.4.1. Pricing Analysis
        16.4.2. Market Share Analysis, 2022
            16.4.2.1. By Sales Type
            16.4.2.2. By Product Type
            16.4.2.3. By End-user Industry
    16.5. Germany
        16.5.1. Pricing Analysis
        16.5.2. Market Share Analysis, 2022
            16.5.2.1. By Sales Type
            16.5.2.2. By Product Type
            16.5.2.3. By End-user Industry
    16.6. United Kingdom
        16.6.1. Pricing Analysis
        16.6.2. Market Share Analysis, 2022
            16.6.2.1. By Sales Type
            16.6.2.2. By Product Type
            16.6.2.3. By End-user Industry
    16.7. France
        16.7.1. Pricing Analysis
        16.7.2. Market Share Analysis, 2022
            16.7.2.1. By Sales Type
            16.7.2.2. By Product Type
            16.7.2.3. By End-user Industry
    16.8. Spain
        16.8.1. Pricing Analysis
        16.8.2. Market Share Analysis, 2022
            16.8.2.1. By Sales Type
            16.8.2.2. By Product Type
            16.8.2.3. By End-user Industry
    16.9. Italy
        16.9.1. Pricing Analysis
        16.9.2. Market Share Analysis, 2022
            16.9.2.1. By Sales Type
            16.9.2.2. By Product Type
            16.9.2.3. By End-user Industry
    16.10. Poland
        16.10.1. Pricing Analysis
        16.10.2. Market Share Analysis, 2022
            16.10.2.1. By Sales Type
            16.10.2.2. By Product Type
            16.10.2.3. By End-user Industry
    16.11. Russia
        16.11.1. Pricing Analysis
        16.11.2. Market Share Analysis, 2022
            16.11.2.1. By Sales Type
            16.11.2.2. By Product Type
            16.11.2.3. By End-user Industry
    16.12. Czech Republic
        16.12.1. Pricing Analysis
        16.12.2. Market Share Analysis, 2022
            16.12.2.1. By Sales Type
            16.12.2.2. By Product Type
            16.12.2.3. By End-user Industry
    16.13. Romania
        16.13.1. Pricing Analysis
        16.13.2. Market Share Analysis, 2022
            16.13.2.1. By Sales Type
            16.13.2.2. By Product Type
            16.13.2.3. By End-user Industry
    16.14. India
        16.14.1. Pricing Analysis
        16.14.2. Market Share Analysis, 2022
            16.14.2.1. By Sales Type
            16.14.2.2. By Product Type
            16.14.2.3. By End-user Industry
    16.15. Bangladesh
        16.15.1. Pricing Analysis
        16.15.2. Market Share Analysis, 2022
            16.15.2.1. By Sales Type
            16.15.2.2. By Product Type
            16.15.2.3. By End-user Industry
    16.16. Australia
        16.16.1. Pricing Analysis
        16.16.2. Market Share Analysis, 2022
            16.16.2.1. By Sales Type
            16.16.2.2. By Product Type
            16.16.2.3. By End-user Industry
    16.17. New Zealand
        16.17.1. Pricing Analysis
        16.17.2. Market Share Analysis, 2022
            16.17.2.1. By Sales Type
            16.17.2.2. By Product Type
            16.17.2.3. By End-user Industry
    16.18. China
        16.18.1. Pricing Analysis
        16.18.2. Market Share Analysis, 2022
            16.18.2.1. By Sales Type
            16.18.2.2. By Product Type
            16.18.2.3. By End-user Industry
    16.19. Japan
        16.19.1. Pricing Analysis
        16.19.2. Market Share Analysis, 2022
            16.19.2.1. By Sales Type
            16.19.2.2. By Product Type
            16.19.2.3. By End-user Industry
    16.20. South Korea
        16.20.1. Pricing Analysis
        16.20.2. Market Share Analysis, 2022
            16.20.2.1. By Sales Type
            16.20.2.2. By Product Type
            16.20.2.3. By End-user Industry
    16.21. GCC Countries
        16.21.1. Pricing Analysis
        16.21.2. Market Share Analysis, 2022
            16.21.2.1. By Sales Type
            16.21.2.2. By Product Type
            16.21.2.3. By End-user Industry
    16.22. South Africa
        16.22.1. Pricing Analysis
        16.22.2. Market Share Analysis, 2022
            16.22.2.1. By Sales Type
            16.22.2.2. By Product Type
            16.22.2.3. By End-user Industry
    16.23. Israel
        16.23.1. Pricing Analysis
        16.23.2. Market Share Analysis, 2022
            16.23.2.1. By Sales Type
            16.23.2.2. By Product Type
            16.23.2.3. By End-user Industry
17. Market Structure Analysis
    17.1. Competition Dashboard
    17.2. Competition Benchmarking
    17.3. Market Share Analysis of Top Players
        17.3.1. By Regional
        17.3.2. By Sales Type
        17.3.3. By Product Type
        17.3.4. By End-user Industry
18. Competition Analysis
    18.1. Competition Deep Dive
        18.1.1. Accutek Packaging Equipment Companies, Inc.
            18.1.1.1. Overview
            18.1.1.2. Product Portfolio
            18.1.1.3. Profitability by Market Segments
            18.1.1.4. Sales Footprint
            18.1.1.5. Strategy Overview
                18.1.1.5.1. Marketing Strategy
                18.1.1.5.2. Product Strategy
                18.1.1.5.3. Channel Strategy
        18.1.2. Coesia S.p.A
            18.1.2.1. Overview
            18.1.2.2. Product Portfolio
            18.1.2.3. Profitability by Market Segments
            18.1.2.4. Sales Footprint
            18.1.2.5. Strategy Overview
                18.1.2.5.1. Marketing Strategy
                18.1.2.5.2. Product Strategy
                18.1.2.5.3. Channel Strategy
        18.1.3. GEA Group Aktiengesellschaft
            18.1.3.1. Overview
            18.1.3.2. Product Portfolio
            18.1.3.3. Profitability by Market Segments
            18.1.3.4. Sales Footprint
            18.1.3.5. Strategy Overview
                18.1.3.5.1. Marketing Strategy
                18.1.3.5.2. Product Strategy
                18.1.3.5.3. Channel Strategy
        18.1.4. JBT
            18.1.4.1. Overview
            18.1.4.2. Product Portfolio
            18.1.4.3. Profitability by Market Segments
            18.1.4.4. Sales Footprint
            18.1.4.5. Strategy Overview
                18.1.4.5.1. Marketing Strategy
                18.1.4.5.2. Product Strategy
                18.1.4.5.3. Channel Strategy
        18.1.5. Krones AG
            18.1.5.1. Overview
            18.1.5.2. Product Portfolio
            18.1.5.3. Profitability by Market Segments
            18.1.5.4. Sales Footprint
            18.1.5.5. Strategy Overview
                18.1.5.5.1. Marketing Strategy
                18.1.5.5.2. Product Strategy
                18.1.5.5.3. Channel Strategy
        18.1.6. Ronchi Mario S.p.A
            18.1.6.1. Overview
            18.1.6.2. Product Portfolio
            18.1.6.3. Profitability by Market Segments
            18.1.6.4. Sales Footprint
            18.1.6.5. Strategy Overview
                18.1.6.5.1. Marketing Strategy
                18.1.6.5.2. Product Strategy
                18.1.6.5.3. Channel Strategy
        18.1.7. Salzgitter AG (KHS Group)
            18.1.7.1. Overview
            18.1.7.2. Product Portfolio
            18.1.7.3. Profitability by Market Segments
            18.1.7.4. Sales Footprint
            18.1.7.5. Strategy Overview
                18.1.7.5.1. Marketing Strategy
                18.1.7.5.2. Product Strategy
                18.1.7.5.3. Channel Strategy
        18.1.8. Scholle IPN
            18.1.8.1. Overview
            18.1.8.2. Product Portfolio
            18.1.8.3. Profitability by Market Segments
            18.1.8.4. Sales Footprint
            18.1.8.5. Strategy Overview
                18.1.8.5.1. Marketing Strategy
                18.1.8.5.2. Product Strategy
                18.1.8.5.3. Channel Strategy
        18.1.9. Syntegon Technology GmbH
            18.1.9.1. Overview
            18.1.9.2. Product Portfolio
            18.1.9.3. Profitability by Market Segments
            18.1.9.4. Sales Footprint
            18.1.9.5. Strategy Overview
                18.1.9.5.1. Marketing Strategy
                18.1.9.5.2. Product Strategy
                18.1.9.5.3. Channel Strategy
        18.1.10. Tetra Laval International S.A.
            18.1.10.1. Overview
            18.1.10.2. Product Portfolio
            18.1.10.3. Profitability by Market Segments
            18.1.10.4. Sales Footprint
            18.1.10.5. Strategy Overview
                18.1.10.5.1. Marketing Strategy
                18.1.10.5.2. Product Strategy
                18.1.10.5.3. Channel Strategy
19. Assumptions & Acronyms Used
20. Research Methodology

Explore Industrial Automation Insights

View Reports
Future Market Insights

Automatic Filling Machine Market

Schedule a Call