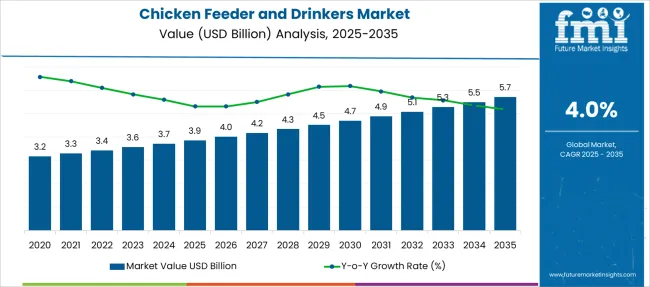
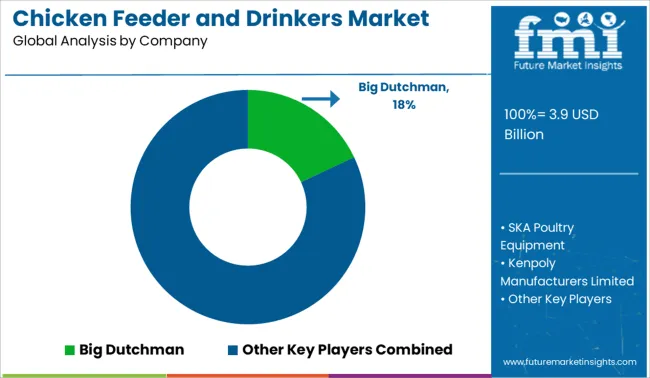
The Chicken Feeder and Drinkers Market is estimated to be valued at USD 3.9 billion in 2025 and is projected to reach USD 5.7 billion by 2035, registering a compound annual growth rate (CAGR) of 4.0% over the forecast period.
| Metric | Value |
|---|---|
| Chicken Feeder and Drinkers Market Estimated Value in (2025 E) | USD 3.9 billion |
| Chicken Feeder and Drinkers Market Forecast Value in (2035 F) | USD 5.7 billion |
| Forecast CAGR (2025 to 2035) | 4.0% |
The Chicken Feeder and Drinkers market is gaining significant momentum, driven by the increasing demand for efficient poultry management systems that ensure optimal bird health and feed utilization. As poultry farming expands globally, both in commercial and small-scale settings, the market is witnessing growth supported by rising concerns over hygiene, feed wastage, and disease control.
Industry sources such as agricultural journals, poultry farming associations, and company press releases have indicated a shift toward automated and semi-automated feeder and drinker systems, designed to reduce labor dependency and enhance farm productivity. Additionally, the increasing integration of smart monitoring technologies in feeding systems has created new opportunities for manufacturers to differentiate their products.
Market growth is further supported by government-led initiatives promoting sustainable poultry farming practices and the rising popularity of backyard poultry farming in developing economies These trends are expected to continue shaping the future of this market, as producers increasingly adopt capacity-based and bird-specific feeding solutions that improve yield and operational efficiency.
The market is segmented by By Capacity, By Product Type, and By Bird Capacity and region. By By Capacity, the market is divided into 1-5 Kg, Less Than 1 Kg, 6-10 Kg, and More Than 10 Kg. In terms of By Product Type, the market is classified into Feeding Equipment and Drinking Equipment. Based on By Bird Capacity, the market is segmented into More Than 10 Birds, 1-5 Birds, and 6-10 Birds. Regionally, the market is classified into North America, Latin America, Western Europe, Eastern Europe, Balkan & Baltic Countries, Russia & Belarus, Central Asia, East Asia, South Asia & Pacific, and the Middle East & Africa.
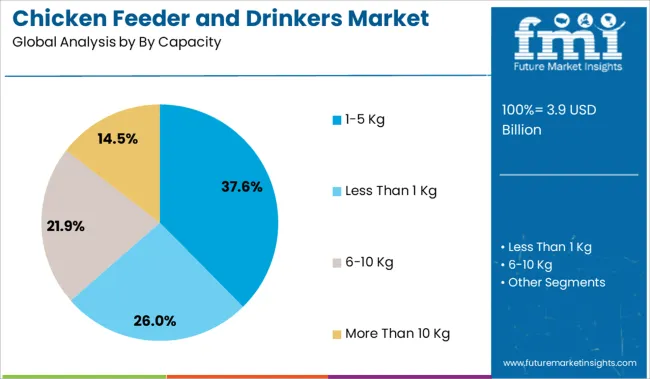
The 1 to 5 Kg capacity segment is projected to hold 37.6% of the Chicken Feeder and Drinkers market revenue share in 2025, establishing it as a leading capacity category. This growth is being attributed to its widespread suitability for both smallholder and medium-sized poultry farms, where manageable feed quantities are preferred to maintain freshness and reduce spoilage. Agricultural equipment updates and poultry farming news sources have emphasized that this capacity range supports efficient feed management for short production cycles, particularly in broilers and young layer flocks.
Its affordability and ease of handling have made it popular in rural markets and among farmers with limited flock sizes. Additionally, the design versatility of 1 to 5 Kg units allows compatibility with various feeding setups, from manual to semi-automated systems.
The demand for flexibility, portability, and cost-effectiveness has continued to drive this segment’s adoption across different poultry environments These attributes have been central to its strong market presence and expected leadership in the coming years.
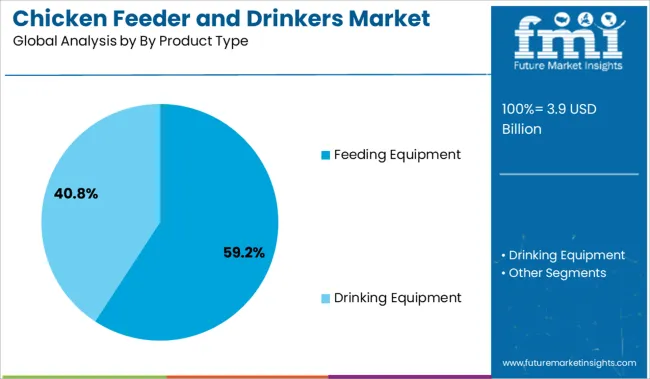
The feeding equipment product type segment is expected to dominate the Chicken Feeder and Drinkers market by accounting for 59.2% of revenue share in 2025. This leadership is being driven by the growing emphasis on maximizing feed conversion ratios and minimizing feed wastage, as highlighted in poultry nutrition research and farm automation case studies. Feeding equipment has been increasingly favored for its ability to deliver precise and consistent feed distribution, which enhances bird growth and health.
Reports from poultry farming associations have noted the rising adoption of automatic and semi-automatic feeding systems in commercial poultry units, especially in regions where labor shortages are a concern. Additionally, manufacturers are offering durable and hygienic feeders made from materials that reduce contamination risks.
These systems are also being supported by digital solutions that allow real-time monitoring of feed levels and bird behavior The reliability, efficiency, and technological adaptability of feeding equipment have solidified its position as the primary product type in this market.
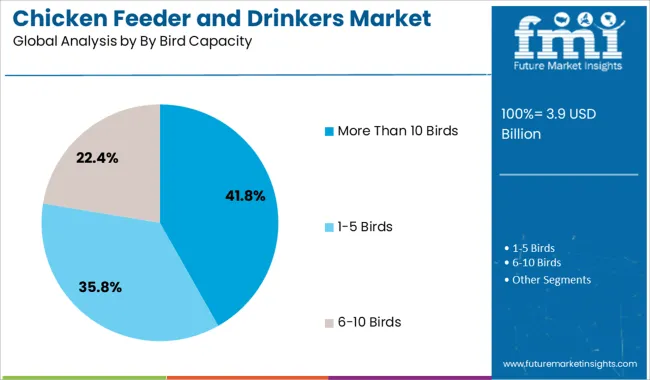
The more than 10 birds capacity segment is forecasted to hold 41.8% of the Chicken Feeder and Drinkers market revenue share in 2025, marking it as the largest segment by bird capacity. This growth is being led by increased adoption in commercial poultry operations and larger backyard setups, where the focus is on optimizing time, labor, and space. According to poultry production best practices and farm supply company announcements, equipment designed for more than 10 birds supports centralized feeding and watering, improving efficiency in large flocks.
These systems are also reported to reduce crowding and competition among birds, leading to healthier growth rates and reduced stress. The cost per bird is lowered when using higher-capacity systems, making them economically attractive for farm managers.
Additionally, these feeders and drinkers are engineered for durability and longer operational lifespans, supporting sustained use in high-density environments These functional advantages have positioned the more than 10 birds segment as the preferred choice for scaling poultry operations efficiently.
When compared to the 3.6% CAGR recorded between 2020 and 2025, the chicken feeders and drinkers industry is predicted to expand at a 4% CAGR between 2025 and 2035. The average growth of the market is expected to be approx 53% between 2025 and 2035.
| Year | Market Value |
|---|---|
| 2020 | USD 2,781.9 million |
| 2024 | USD 3,317.1 million |
| 2025 | USD 3,435.9 million |
The demand for chicken feeders and drinkers is anticipated to increase in the near future due to the rising need for convenience and sanitation in poultry production. This had a favorable effect on the global industry, which grew at a 1.19x rate between 2020 and 2025.
Short-term Growth (2025 to 2029): the market is anticipated to increase during a shorter run as a result of rising consumer demand for organic and natural chicken feeders and drinkers.
Medium-term Growth (2035 to 2035): the increased attention on animal welfare and the expanding knowledge of animal health are anticipated to propel the sales of chicken feeders and drinkers.
Long-term Growth (2035 to 2035): the market expansion is anticipated to be fueled by the rising measures taken by governmental and non-governmental organizations to encourage the adoption of chicken feeders and drinkers.
Commercial Sector
The industry opportunities are being pushed by the rising demand for both standard and specialty poultry products. Large poultry farms by key players in the chicken feeders and drinkers market are creating a global demand for automated equipment.
Additionally, the key growth factor of chicken feeders and drinkers is the rising demand for poultry products due to their nutritious benefits. Furthermore, the market is anticipated to receive additional impetus from the rising demand for organic poultry products.
Residential Sector
Chicken feeders and drinkers companies are expanding in the residential sector. This is because more people are raising chickens in their backyards, and also urban farming is becoming more popular.
As a result, businesses are creating goods that are specially made for the household market, like automatic feeders and drinkers. These goods range from straightforward designs to complex systems with features like timers and light sensors.
Companies are also providing a range of sizes and styles to accommodate the needs of every backyard chicken keeper.
Feeding equipment makes up the majority of chicken feeders and drinkers. The rising demand for feeding systems and the rising customer preference for hardware solutions account for this. The number of chickens is expected to rise, and key companies are predicted to make technological breakthroughs that result in the launch of novel feeders.
In 2025, the market was led by the 1-5 Kg capacity category. Over the forecast period, it is expected that this market segment is predicted to dominate. The growing demand for poultry products is anticipated to promote category growth.
This has allowed nearby farms to increase animal productivity. Additionally, as circular hanging tube feeders make up the bulk of 1-5 kg capacity feeders, demand for chicken feeders and drinkers is rising. These feeding techniques are the best since they are efficient and uniform.
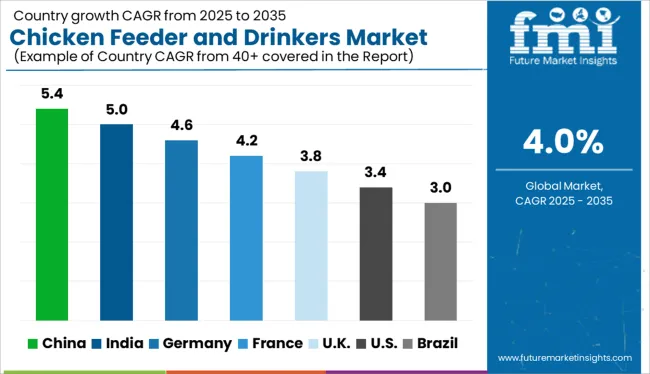
| US Market Value 2025 | USD 1,044.6 million |
|---|---|
| US Market Share 2025 | 30.4% |
In the US, there is a sizable and expanding market for chicken feeders and drinkers. The backyard poultry industry contributes to the sales of chicken feeders and drinkers, and the majority of the goods are sold in agricultural stores.
The industry is also fueled by rising demand for chicken meat and eggs that are produced locally and organically. Miller Manufacturing, FarmTek, Premier 1 Supplies, and Little Giant are some of the top producers of chicken feeders and drinkers in the US market.
These businesses provide a wide variety of goods, such as conventional feeders and drinkers, automatic feeders, and waterers. McDonald's, KFC, Subway, and Taco Bell are fast food chains that depend on a steady supply of chicken to stay in business. Therefore, farms and breeders increasingly utilize both poultry feed and feeders in order to enhance productivity.
| Attributes | Statistics |
|---|---|
| UK Market Value 2025 | USD 326 million |
| UK Market Value 2035 | USD 496.3 million |
| UK Market Share (2025 to 2035) | 9.5% |
| UK Market CAGR (2025 to 2035) | 4.3% |
Growing health consciousness about protein consumption and increased meat consumption is anticipated to hasten the growth of the UK chicken feeders and drinkers industry. This led to a rise in the use of poultry feeders, which can quickly feed large numbers of animals.
A UK retailer, Marks, and Spencer, recently made an announcement about redesigning their Hubbard slower-growing and switching their entire poultry line to 100% British chicken. The retail business formerly purchased its chicken from several British and European farms.
As more individuals become aware of how animal feed helps to improve the diets of farm animals, there is an increase in demand for animal feed and feeders across the country. All of these elements result in a huge increase in demand for chicken feeders and drinkers. As a result, the UK chicken feeders and drinkers business offers a huge opportunity for market participants.
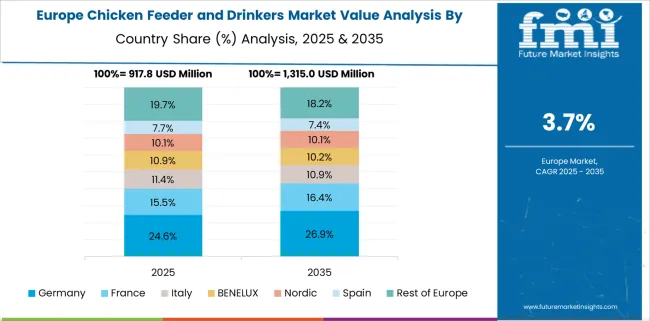
As more people choose poultry farming as a hobby or a job, the industry in Germany is expanding; it is expected to generate USD 3.9 million in 2025. The growing popularity of organic and free-range farming is driving up the sales of chicken feeders and drinkers.
Additionally, the market is being stimulated by technical improvements, which have led to the development of automated feeders and drinkers.
| Country | China |
|---|---|
| Market Share (2025) | 8.6% |
| CAGR (2025-2035) | 3.2% |
| Market Value (2025) | USD 294.47 million |
| Market Value (2035) | USD 403.8 million |
| Country | India |
|---|---|
| Market Share (2025) | 3.7% |
| CAGR (2025 to 2035) | 4.7% |
| Market Value (2025) | USD 129.7 million |
| Market Value (2035) | USD 205.3 million |
China's poultry business has recently experienced some ups and downs. The domestic pig population was decimated by African swine fever, and chicken became China's main source of protein as a result. As a result, the key players in the chicken feeders and drinkers market have numerous prospects.
In order to meet the demand, major firms are funding the modernization of China's chicken sector. China is making investments to increase its capacity for producing poultry feeders and drinkers. This entails expanding both the quantity and size of the factories that make these goods.
| Japan Market Value 2025 | USD 163.3 million |
|---|---|
| Japan Market Share 2025 | 4.8% |
Japan is turning into a meat-eating nation as the country's lifestyles change and meat consumption rises. The nation as a whole is increasingly consuming more pork and chicken meat. However, the majority of the meat consumed in the nation is imported.
Due to the rising price of imported meat and the ongoing rise in meat consumption, pressure is being placed on local farmers to increase production. The need for chicken feeders and drinkers is predicted to rise, given that animal farming is anticipated to expand at a brisk rate over the forecast period.
As consumers' tendency to consume meat and related goods develops globally, demand for farm equipment is anticipated to rise. The chicken feeders and drinkers startups believe that in order to keep leadership, they must strengthen their competitive edge.
To establish a presence internationally in the market, chicken feeders and drinkers manufacturers make large investments in Research and Development, in addition to concentrating on product releases.
For instance,
South Indian Poultry Equipment is a partnership-based business that was founded in Ernakulam, Kerala, in 2011. It participates as a manufacturer of drinkware made of plastic, bird feeders, poultry fans, plastic cans, and poultry equipment. It is a well-known business that focuses on providing an amazing range of these products.
Chicken feeders and drinkers businesses work to enhance their current products, in addition to creating cutting-edge technologies and methods for poultry feeding equipment. Along with established companies, they are also fostering beneficial ties with other companies in the poultry industry, particularly those that produce feed.
To boost their access to lucrative markets, businesses come into many agreements. Farmers are now able to regulate the feed and water requirements of their chickens due to the mechanical feeders and drinkers.
| Company | Development |
|---|---|
| SKA Poultry Equipment | Since 1954, SKA has been developing and producing commercial chicken feeders to satisfy the demands of organic and free-range farming. Automated feeder types for poultry farms are designed to meet the diverse needs of chicks and adult birds. They are created taking into account their distinct qualities and are based on an analysis of animal behavior. |
| Kenpoly Manufacturers Limited | Kenpoly Manufacturers Limited is a multifaceted company and a modern developer in the plastics industry. Packaging, industrial, home, and agricultural products are all part of its vast line of plastic products. The uses for Kenpoly products are nearly unlimited and span almost every aspect of life. |
| INDIV USA | A Reputable Equipment Supplier for the Poultry Industry is INDIV. Supplies for poultry, feeders, and drinkers are among its offerings, along with hardware, equipment, structures, and accessories. |
Recent Developments:
The global chicken feeder and drinkers market is estimated to be valued at USD 3.9 billion in 2025.
The market size for the chicken feeder and drinkers market is projected to reach USD 5.7 billion by 2035.
The chicken feeder and drinkers market is expected to grow at a 4.0% CAGR between 2025 and 2035.
The key product types in chicken feeder and drinkers market are 1-5 kg, less than 1 kg, 6-10 kg and more than 10 kg.
In terms of by product type, feeding equipment segment to command 59.2% share in the chicken feeder and drinkers market in 2025.


Our Research Products

The "Full Research Suite" delivers actionable market intel, deep dives on markets or technologies, so clients act faster, cut risk, and unlock growth.

The Leaderboard benchmarks and ranks top vendors, classifying them as Established Leaders, Leading Challengers, or Disruptors & Challengers.

Locates where complements amplify value and substitutes erode it, forecasting net impact by horizon

We deliver granular, decision-grade intel: market sizing, 5-year forecasts, pricing, adoption, usage, revenue, and operational KPIs—plus competitor tracking, regulation, and value chains—across 60 countries broadly.

Spot the shifts before they hit your P&L. We track inflection points, adoption curves, pricing moves, and ecosystem plays to show where demand is heading, why it is changing, and what to do next across high-growth markets and disruptive tech

Real-time reads of user behavior. We track shifting priorities, perceptions of today’s and next-gen services, and provider experience, then pace how fast tech moves from trial to adoption, blending buyer, consumer, and channel inputs with social signals (#WhySwitch, #UX).

Partner with our analyst team to build a custom report designed around your business priorities. From analysing market trends to assessing competitors or crafting bespoke datasets, we tailor insights to your needs.
Supplier Intelligence
Discovery & Profiling
Capacity & Footprint
Performance & Risk
Compliance & Governance
Commercial Readiness
Who Supplies Whom
Scorecards & Shortlists
Playbooks & Docs
Category Intelligence
Definition & Scope
Demand & Use Cases
Cost Drivers
Market Structure
Supply Chain Map
Trade & Policy
Operating Norms
Deliverables
Buyer Intelligence
Account Basics
Spend & Scope
Procurement Model
Vendor Requirements
Terms & Policies
Entry Strategy
Pain Points & Triggers
Outputs
Pricing Analysis
Benchmarks
Trends
Should-Cost
Indexation
Landed Cost
Commercial Terms
Deliverables
Brand Analysis
Positioning & Value Prop
Share & Presence
Customer Evidence
Go-to-Market
Digital & Reputation
Compliance & Trust
KPIs & Gaps
Outputs
Full Research Suite comprises of:
Market outlook & trends analysis
Interviews & case studies
Strategic recommendations
Vendor profiles & capabilities analysis
5-year forecasts
8 regions and 60+ country-level data splits
Market segment data splits
12 months of continuous data updates
DELIVERED AS:
PDF EXCEL ONLINE
Chicken Coccidia Vaccine Market Size and Share Forecast Outlook 2025 to 2035
Chicken Plucking Machine Market Size, Growth, and Forecast 2025 to 2035
Chicken Coops Market Analysis – Trends & Growth Forecast 2025 to 2035
Chicken Offal Market Analysis by Organ and End Use Through 2035
Chicken Buckets Market
Chicken Flavors Market
Electric Chicken Scalder Market Size and Share Forecast Outlook 2025 to 2035
Automatic Chicken Deboning Machine Market Size and Share Forecast Outlook 2025 to 2035
Air-dried Chicken Dog Food Market Size and Share Forecast Outlook 2025 to 2035
Commercial Chicken Plucker Market Size and Share Forecast Outlook 2025 to 2035
Plant-Based Chicken Market Analysis - Size, Share, and Forecast 2025 to 2035
Fresh Organic Chicken Market
Organic Starter-Grower Chicken Feed Market
Feeder Container Market Size and Share Forecast Outlook 2025 to 2035
Hog Feeder Market Size and Share Forecast Outlook 2025 to 2035
Belt Feeders Market Size and Share Forecast Outlook 2025 to 2035
Weft Feeder Market Trend Analysis Based on Type, Operation, Application, and Region 2025 to 2035
Pump Feeders Market Growth - Trends & Forecast 2025 to 2035
Part Feeder Market
Cattle Feeder Panels Market Size and Share Forecast Outlook 2025 to 2035

Thank you!
You will receive an email from our Business Development Manager. Please be sure to check your SPAM/JUNK folder too.
Chat With
MaRIA