Container Liner Market Size and Share Forecast Outlook 2025 to 2035

The global Container Liner Market is estimated at USD 974.8 million in 2025 and is projected to reach USD 1,528.4 million by 2035, growing at a CAGR of 4.6%. Nearly half of the market is dominated by 40 Foot capacity liners, which hold a 47% share.
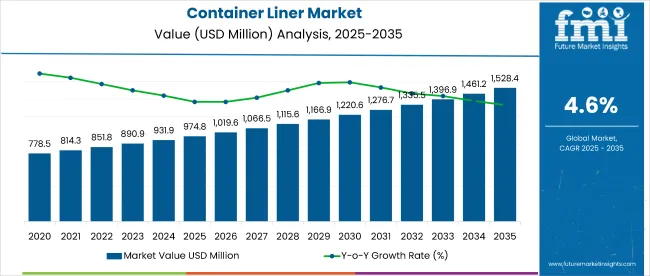
Quick Stats for Container Liner Market

  • Market size (2025): USD 974.8 million
  • Market size (2035): USD 1,528.4 million
  • CAGR (2025-2035): 4.6%
  • 40 Foot Capacity share: 47%
  • PE material share: 34%
  • Top Fill product share: 29%
  • USA CAGR: 6.5%

Container Liner Market

Attribute Detail
Market Size (2025) USD 974.8 million
Market Size (2035) USD 1,528.4 million
CAGR (2025 to 2035) 4.6%

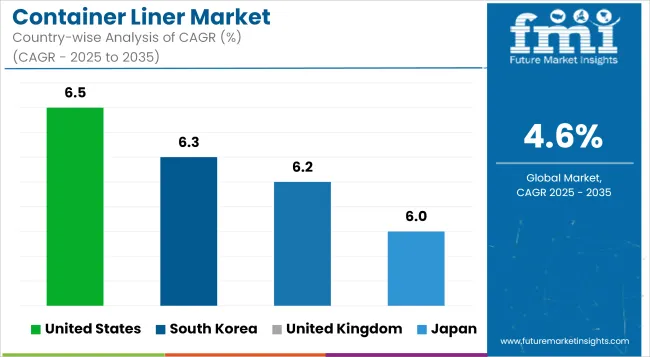
Polyethylene (PE) is the leading material type, accounting for 34% of the market. Top Fill products represent 29% of sales. Among regions, the United States leads with the highest CAGR of 6.5%, followed by South Korea at 6.3%, the United Kingdom at 6.2%, and Japan at 6.0%.

Growth in the Container Liner Market is driven by rising global containerized shipping and increasing demand for secure bulk cargo transportation. The preference for 40 Foot liners is supported by their compatibility with standard container fleets, while polyethylene remains favored due to its durability and cost efficiency.

Regional growth in the USA and Asia-Pacific reflects expanding industrial and e-commerce activities, though market expansion faces logistical challenges including supply chain constraints and raw material price volatility. Overall, companies investing in innovative liner designs and sustainable materials are positioned to gain competitive advantage through the forecast period.

Container Liner Market by Top Investment Segments

The Container Liner Market is segmented by Capacity Type into 20 Foot, 30 Foot, and 40 Foot liners, with 40 Foot liners dominating in 2025. By Material Type, the market is divided into Polyethylene (PE), Polypropylene (PP), Polyvinyl Chloride (PVC), Metallized Films, and other materials such as Polystyrene. Product Type segmentation includes End Fill, Open Top, Top Fill, and Wide Access liners.

End-use segments cover Agriculture, Chemical, Building & Construction, Mining, Food & Beverage, Pharmaceutical, and Others. Geographically, the market is analyzed across North America, Latin America, Western and Eastern Europe, East Asia, South Asia & Pacific, Middle East, and Africa. Country-level analyses include major markets such as the United States, Canada, Mexico, Brazil, Germany, Italy, France, the UK, China, Japan, South Korea, India, Australia & New Zealand, ASEAN countries, GCC nations, and South Africa.
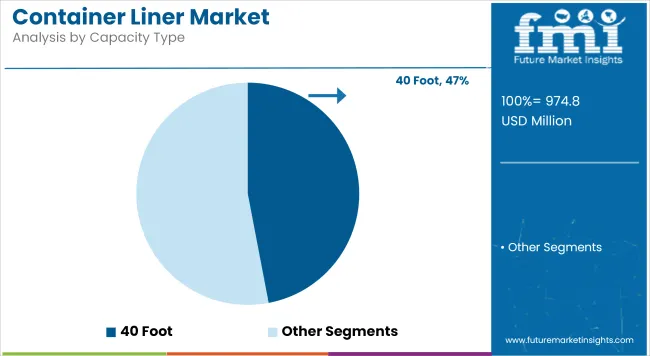
Container Liner Market Analysis by Capacity Type

Container Liner Market Analysis By Capacity Type

In 2025, the 40 Foot capacity segment leads the Container Liner Market with a 47% share, reflecting its widespread compatibility with standard global shipping container fleets. This dominance is supported by growing demand for efficient bulk cargo transport solutions that optimize container volume utilization.

The 20 Foot and 30 Foot capacity segments together constitute the remaining 53% of the market, driven primarily by niche applications and regional container specifications. Growth in the 40 Foot segment is propelled by increasing containerized trade volumes and rising investments in logistics infrastructure. However, challenges such as fluctuating raw material costs and supply chain disruptions may moderate growth. Innovations in liner design aimed at enhancing durability and ease of installation are expected to further strengthen the 40 Foot segment’s position over the forecast period.
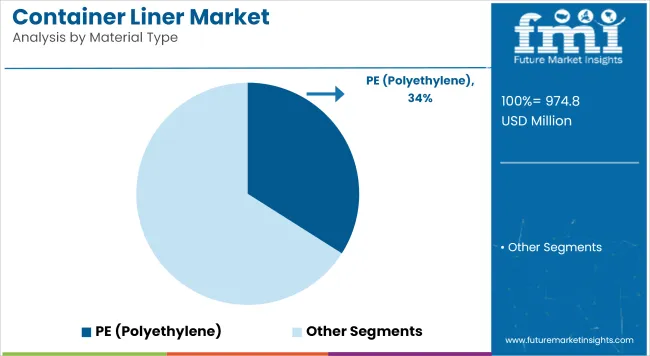
Container Liner Market Analysis by Material Type

Container Liner Market Analysis By Material Type

Polyethylene (PE) dominates the Container Liner Market in 2025 with a 34% share, favored for its durability, chemical resistance, and cost-effectiveness. PE liners are widely used across various end-use industries due to their ability to protect bulk cargo from contamination and moisture.

Other materials such as Polypropylene (PP), Polyvinyl Chloride (PVC), Metallized Films, and specialty polymers make up the remaining 66%, each offering specific performance benefits for different applications. Growth in the PE segment is supported by its versatility and increasing demand in industries like agriculture, chemicals, and food & beverage. However, environmental regulations and evolving sustainability requirements could drive innovation and gradual adoption of alternative, eco-friendly materials during the forecast period. The material segment’s expansion will hinge on balancing performance, cost, and compliance with regulatory standards globally.
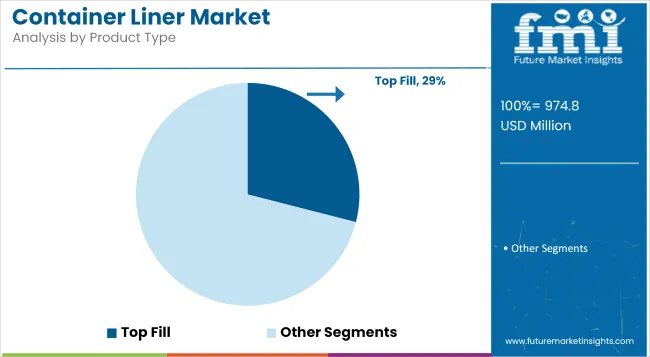
Container Liner Market Analysis by Product Type

Container Liner Market Analysis By Product Type

Top Fill liners hold the largest share in the Container Liner Market in 2025, accounting for 29% of total revenue. These liners are preferred for their ease of filling from the top, making them suitable for bulk materials that require secure containment during transport. Other product types include End Fill, Open Top, and Wide Access liners, which collectively represent 71% of the market. Each product type caters to specific cargo handling needs and container designs, influencing their adoption across various industries.

Growth in the Top Fill segment is driven by increasing demand in sectors such as agriculture and chemicals, where efficient loading and unloading are critical. Despite logistical challenges and competition from alternative packaging solutions, ongoing product innovation aimed at improving liner strength and compatibility is expected to sustain growth throughout the forecast period.

Container Liner Market Analysis by End Use

The Container Liner Market is segmented by end use into Agriculture, Chemical, Building & Construction, Mining, Food & Beverage, Pharmaceutical, and Others. Agriculture and Chemical industries are among the primary consumers, driven by the need for secure and contamination-free transport of bulk raw materials and products.

The Food & Beverage segment is gaining traction due to stringent hygiene requirements and growing demand for bulk food ingredient shipments. Mining and Building & Construction sectors contribute significantly as well, leveraging liners to protect bulk minerals and construction materials during transit. The Pharmaceutical segment, while smaller in volume, is growing steadily, supported by increasing global trade of active pharmaceutical ingredients. Each end-use segment faces unique regulatory and operational challenges, but overall, demand is propelled.
Container Liner Market Analysis by Country

Country Wise Analysis Of Container Liner Market

United States Container Liner Market Analysis

The United States Container Liner Market is expected to grow at a CAGR of 6.5% from 2025 to 2035, driven by expanding industrial and e-commerce activities that increase demand for secure, efficient bulk cargo transport. In 2025, the USA market size anchors regional growth as the largest container liner market in North America, supported by advanced logistics infrastructure and growing import-export volumes.

Regulatory standards for safe transportation and contamination prevention in food, chemicals, and pharmaceuticals reinforce liner demand. Increased focus on supply chain optimization and the shift towards just-in-time inventory management further stimulate market expansion.

However, challenges including raw material price volatility and supply chain disruptions may temper growth. Public surveys reflect rising awareness among shippers about the benefits of durable liners to reduce cargo damage. Investment in innovative materials and sustainable liner solutions is anticipated to enhance the USA market’s competitiveness, positioning domestic manufacturers and global suppliers for continued growth over the forecast period.

  • Largest North American market
  • Regulatory-driven demand in food & pharma
  • Rising e-commerce logistics requirements

South Korea Container Liner Demand Outlook

South Korea’s Container Liner Market is forecast to grow at a CAGR of 6.3% during 2025-2035, fueled by the country’s strong export-oriented economy and advanced manufacturing sectors. The 2025 market size is anchored by key industries such as chemicals, automotive, and electronics that require reliable bulk packaging for overseas shipping.

South Korea’s focus on supply chain efficiency and container utilization optimization supports demand for high-quality liners, especially 40 Foot capacity types. Environmental regulations and sustainability initiatives are encouraging adoption of recyclable and eco-friendly liner materials, reflecting evolving market dynamics.

Despite potential headwinds from raw material cost fluctuations, government incentives for technological innovation in packaging materials help mitigate risks. Industry surveys indicate that shippers are increasingly prioritizing liner durability and compatibility with container handling systems. The market outlook points to steady growth as South Korea continues to strengthen its logistics infrastructure and expands international trade partnerships.

  • Strong export-driven demand
  • Growing preference for eco-friendly materials
  • Supportive innovation incentives

United Kingdom Container Liner Industry Analysis

The United Kingdom Container Liner Market is projected to expand at a CAGR of 6.2% from 2025 to 2035. The UK’s market growth is propelled by post-Brexit trade realignments and increased demand for efficient containerized transport solutions.

Food & beverage, chemical, and pharmaceutical sectors contribute significantly to liner consumption, driven by stringent regulatory standards for product safety during shipment. The 40 Foot container liners remain dominant due to compatibility with UK and European logistics networks.

Investment in sustainable materials and enhanced liner designs is rising, as UK businesses align with environmental regulations and consumer expectations for responsible packaging. Challenges such as supply chain uncertainties and rising raw material prices pose risks, yet market participants are focused on innovation and supplier diversification to ensure resilience. Public sentiment increasingly favors durable liners that reduce product loss and contamination, supporting the market’s long-term expansion.

  • Trade realignment post-Brexit
  • Regulatory compliance in pharma and food
  • Growing sustainability focus

Japan Container Liner Sales Forecast

Japan’s Container Liner Market is expected to grow at a CAGR of 6.0% from 2025 to 2035, anchored by the country’s advanced manufacturing base and export-oriented economy. The 2025 market size reflects steady demand in sectors such as chemicals, food processing, and electronics, where container liners are essential for safe bulk transport. Japan’s stringent quality standards and emphasis on contamination prevention bolster liner adoption, especially polyethylene-based products.

The market benefits from Japan’s focus on logistics optimization and automation, which enhance container handling efficiency. However, supply chain constraints and raw material cost volatility represent ongoing challenges.

Survey data suggest increasing interest among shippers in liners offering both durability and environmental benefits. The development of innovative, sustainable liner materials is a key trend supporting Japan’s market growth, positioning it among the top Asia-Pacific markets for container liners over the forecast period.
  • High manufacturing export demand
  • Strong quality and safety standards
  • Focus on sustainable liner innovation

Container Liner Market Players and Strategies

Container Liner Market Analysis By Company

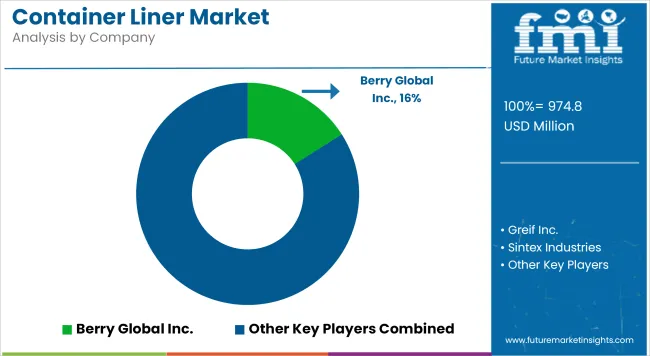
The players in the Container Liner Market are focusing on product innovation, material diversification, and strategic partnerships to strengthen their market positions. Leading companies like Berry Global Inc. leverage advanced polyethylene formulations to enhance liner durability and chemical resistance, addressing diverse end-use requirements.

Concurrently, firms such as Greif Inc. and Sintex Industries invest in expanding production capacities and geographic reach to meet growing global demand, particularly in North America and Asia-Pacific. Sustainability initiatives have become central, with key players developing recyclable and bio-based liner materials in response to tightening environmental regulations. Supply chain resilience is being improved through localized manufacturing and diversified supplier networks to mitigate raw material price volatility and logistics disruptions.

Smaller and emerging companies focus on niche applications and customization to differentiate offerings. Technology adoption in manufacturing processes and quality control further intensifies competition. Overall, market leadership will be determined by firms’ ability to balance innovation, cost efficiency, and sustainability, positioning them to capture expanding opportunities amid evolving customer preferences and regulatory landscapes. Late movers face challenges in scaling quickly and establishing trusted supply chains.

  • Berry Global Inc.
  • Greif Inc.
  • Sintex Industries
  • Thrace Group
  • Nier Systems Inc.
  • Caretex
  • LC Packaging
  • Eceplast S.p.A
  • Bulk-Pack Inc.
  • Powertex

Report Scope Table

Metric Details
Market Covered Global Container Liner Market
Historical Period 2020 to 2024
Base Year 2024
Forecast Period 2025 to 2035
Market Size Units USD Million; Volume in Metric Tons
Segmentation Capacity Type (20 Foot, 30 Foot, 40 Foot); Material Type (PE, PP, PVC, Metallized Film, Others); Product Type (End Fill, Open Top, Top Fill, Wide Access); End Use (Agriculture, Chemical, Building & Construction, Mining, Food & Beverage, Pharmaceutical, Others); Region and Country-level analysis
Regional Coverage North America, Latin America, Western Europe, Eastern Europe, East Asia, South Asia & Pacific, Middle East & Africa
Key Countries United States, Canada, Mexico, Brazil, Germany, Italy, France, UK, China, Japan, South Korea, India, Australia & New Zealand, ASEAN, GCC, South Africa
Key Players Covered Berry Global Inc., Greif Inc., Sintex Industries, Thrace Group, Nier Systems Inc., Caretex, LC Packaging, Eceplast S.p.A, Bulk-Pack Inc., Powertex
Market Dynamics Covered Drivers, Restraints, Opportunities, Trends
Additional Analysis Technology Roadmap, Supply Chain, Pricing Analysis, Investment Feasibility, Competitive Landscape

Key Segments

By Material Type:

  • PP (Polypropylene)
  • PVC (Polyvinyl Chloride)
  • PE (Polyethylene)
  • Metallized Film
  • Others (PS, etc.)

By Capacity Type:

  • 20 Foot
  • 30 Foot
  • 40 Foot

By Product Type:

  • End Fill
  • Open Top
  • Top Fill
  • Wide Access

By End Use:

  • Agriculture
  • Chemical
  • Building & Construction
  • Mining
  • Food & Beverage
  • Pharmaceutical
  • Others

By Region:

  • North America
  • Latin America
  • East Asia
  • South Asia & Pacific
  • Eastern Europe
  • Western Europe
  • Middle East & Africa

Table of Content

  1. Executive Summary
    • Global Market Outlook
    • Demand-side Trends
    • Supply-side Trends
    • Technology Roadmap Analysis
    • Analysis and Recommendations
  2. Market Overview
    • Market Coverage/Taxonomy
    • Market Definition/Scope/Limitations
  3. Market Background
    • Market Dynamics
      • Drivers
      • Restraints
      • Opportunity
      • Trends
    • Scenario Forecast
      • Demand in Optimistic Scenario
      • Demand in Likely Scenario
      • Demand in Conservative Scenario
    • Opportunity Map Analysis
    • Product Life Cycle Analysis
    • Supply Chain Analysis
      • Supply Side Participants and their Roles
        • Producers
        • Mid-Level Participants (Traders/ Agents/ Brokers)
        • Wholesalers and Distributors
      • Value Added and Value Created at Node in the Supply Chain
      • List of Raw Material Suppliers
      • List of Existing and Potential Buyer’s
    • Investment Feasibility Matrix
    • Value Chain Analysis
      • Profit Margin Analysis
      • Wholesalers and Distributors
      • Retailers
    • PESTLE and Porter’s Analysis
    • Regulatory Landscape
      • By Key Regions
      • By Key Countries
    • Regional Parent Market Outlook
    • Production and Consumption Statistics
    • Import and Export Statistics
  4. Global Market Analysis 2020 to 2024 and Forecast, 2025 to 2035
    • Historical Market Size Value (USD Million) & Volume (Metric Tons) Analysis, 2020 to 2024
    • Current and Future Market Size Value (USD Million) & Volume (Metric Tons) Projections, 2025 to 2035
      • Y-o-Y Growth Trend Analysis
      • Absolute $ Opportunity Analysis
  5. Global Market Pricing Analysis 2020 to 2024 and Forecast 2025 to 2035
  6. Global Market Analysis 2020 to 2024 and Forecast 2025 to 2035, By Material Type
    • Introduction/Key Findings
    • Historical Market Size Value (USD Million) & Volume (Metric Tons) Analysis By Material Type, 2020 to 2024
    • Current and Future Market Size Value (USD Million) & Volume (Metric Tons) Analysis and Forecast By Material Type, 2025 to 2035
      • PP (Polypropylene)
      • PVC (Polyvinyl Chloride)
      • PE (Polyethylene)
      • Metallized Film
      • Others (PS, etc.)
    • Y-o-Y Growth Trend Analysis By Material Type, 2020 to 2024
    • Absolute $ Opportunity Analysis By Material Type, 2025 to 2035
  7. Global Market Analysis 2020 to 2024 and Forecast 2025 to 2035, By Capacity Type
    • Introduction/Key Findings
    • Historical Market Size Value (USD Million) & Volume (Metric Tons) Analysis By Capacity Type, 2020 to 2024
    • Current and Future Market Size Value (USD Million) & Volume (Metric Tons) Analysis and Forecast By Capacity Type, 2025 to 2035
      • 20 Foot
      • 30 Foot
      • 40 Foot
    • Y-o-Y Growth Trend Analysis By Capacity Type, 2020 to 2024
    • Absolute $ Opportunity Analysis By Capacity Type, 2025 to 2035
  8. Global Market Analysis 2020 to 2024 and Forecast 2025 to 2035, By Product Type
    • Introduction/Key Findings
    • Historical Market Size Value (USD Million) & Volume (Metric Tons) Analysis By Product Type, 2020 to 2024
    • Current and Future Market Size Value (USD Million) & Volume (Metric Tons) Analysis and Forecast By Product Type, 2025 to 2035
      • End Fill
      • Open Top
      • Top Fill
      • Wide Access
    • Y-o-Y Growth Trend Analysis By Product Type, 2020 to 2024
    • Absolute $ Opportunity Analysis By Product Type, 2025 to 2035
  9. Global Market Analysis 2020 to 2024 and Forecast 2025 to 2035, By End Use
    • Introduction/Key Findings
    • Historical Market Size Value (USD Million) & Volume (Metric Tons) Analysis By End Use, 2020 to 2024
    • Current and Future Market Size Value (USD Million) & Volume (Metric Tons) Analysis and Forecast By End Use, 2025 to 2035
      • Agriculture
      • Chemical
      • Building & Construction
      • Mining
      • Food & Beverage
      • Pharmaceutical
      • Others
    • Y-o-Y Growth Trend Analysis By End Use, 2020 to 2024
    • Absolute $ Opportunity Analysis By End Use, 2025 to 2035
  10. Global Market Analysis 2020 to 2024 and Forecast 2025 to 2035, By Region
    • Introduction
    • Historical Market Size Value (USD Million) & Volume (Metric Tons) Analysis By Region, 2020 to 2024
    • Current Market Size Value (USD Million) & Volume (Metric Tons) Analysis and Forecast By Region, 2025 to 2035
      • North America
      • Latin America
      • Western Europe
      • Eastern Europe
      • East Asia
      • South Asia & Pacific
      • Middle East and Africa
    • Market Attractiveness Analysis By Region
  11. North America Market Analysis 2020 to 2024 and Forecast 2025 to 2035, By Country
    • Historical Market Size Value (USD Million) & Volume (Metric Tons) Trend Analysis By Market Taxonomy, 2020 to 2024
    • Market Size Value (USD Million) & Volume (Metric Tons) Forecast By Market Taxonomy, 2025 to 2035
      • By Country
        • USA
        • Canada
        • Mexico
      • By Material Type
      • By Capacity Type
      • By Product Type
      • By End Use
    • Market Attractiveness Analysis
      • By Country
      • By Material Type
      • By Capacity Type
      • By Product Type
      • By End Use
    • Key Takeaways
  12. Latin America Market Analysis 2020 to 2024 and Forecast 2025 to 2035, By Country
    • Historical Market Size Value (USD Million) & Volume (Metric Tons) Trend Analysis By Market Taxonomy, 2020 to 2024
    • Market Size Value (USD Million) & Volume (Metric Tons) Forecast By Market Taxonomy, 2025 to 2035
      • By Country
        • Brazil
        • Argentina
        • Rest of LATAM
      • By Material Type
      • By Capacity Type
      • By Product Type
      • By End Use
    • Market Attractiveness Analysis
      • By Country
      • By Material Type
      • By Capacity Type
      • By Product Type
      • By End Use
    • Key Takeaways
  13. Western Europe Market Analysis 2020 to 2024 and Forecast 2025 to 2035, By Country
    • Historical Market Size Value (USD Million) & Volume (Metric Tons) Trend Analysis By Market Taxonomy, 2020 to 2024
    • Market Size Value (USD Million) & Volume (Metric Tons) Forecast By Market Taxonomy, 2025 to 2035
      • By Country
        • Germany
        • Italy
        • France
        • UK
        • Spain
        • BENELUX
        • Nordic
        • Rest of W.Europe
      • By Material Type
      • By Capacity Type
      • By Product Type
      • By End Use
    • Market Attractiveness Analysis
      • By Country
      • By Material Type
      • By Capacity Type
      • By Product Type
      • By End Use
    • Key Takeaways
  14. Eastern Europe Market Analysis 2020 to 2024 and Forecast 2025 to 2035, By Country
    • Historical Market Size Value (USD Million) & Volume (Metric Tons) Trend Analysis By Market Taxonomy, 2020 to 2024
    • Market Size Value (USD Million) & Volume (Metric Tons) Forecast By Market Taxonomy, 2025 to 2035
      • By Country
        • Russia
        • Hungary
        • Poland
        • Balkan & Baltics
        • Rest of E. Europe
      • By Material Type
      • By Capacity Type
      • By Product Type
      • By End Use
    • Market Attractiveness Analysis
      • By Country
      • By Material Type
      • By Capacity Type
      • By Product Type
      • By End Use
    • Key Takeaways
  15. East Asia Market Analysis 2020 to 2024 and Forecast 2025 to 2035, By Country
    • Historical Market Size Value (USD Million) & Volume (Metric Tons) Trend Analysis By Market Taxonomy, 2020 to 2024
    • Market Size Value (USD Million) & Volume (Metric Tons) Forecast By Market Taxonomy, 2025 to 2035
      • By Country
        • China
        • Japan
        • South Korea
      • By Material Type
      • By Capacity Type
      • By Product Type
      • By End Use
    • Market Attractiveness Analysis
      • By Country
      • By Material Type
      • By Capacity Type
      • By Product Type
      • By End Use
    • Key Takeaways
  16. South Asia & Pacific Market Analysis 2020 to 2024 and Forecast 2025 to 2035, By Country
    • Historical Market Size Value (USD Million) & Volume (Metric Tons) Trend Analysis By Market Taxonomy, 2020 to 2024
    • Market Size Value (USD Million) & Volume (Metric Tons) Forecast By Market Taxonomy, 2025 to 2035
      • By Country
        • India
        • Australia & New Zealand
        • ASEAN
        • Rest of SAP
      • By Material Type
      • By Capacity Type
      • By Product Type
      • By End Use
    • Market Attractiveness Analysis
      • By Country
      • By Material Type
      • By Capacity Type
      • By Product Type
      • By End Use
    • Key Takeaways
  17. Middle East and Africa Market Analysis 2020 to 2024 and Forecast 2025 to 2035, By Country
    • Historical Market Size Value (USD Million) & Volume (Metric Tons) Trend Analysis By Market Taxonomy, 2020 to 2024
    • Market Size Value (USD Million) & Volume (Metric Tons) Forecast By Market Taxonomy, 2025 to 2035
      • By Country
        • GCC Countries
        • Northern Africa
        • South Africa
        • Turkiye
        • Rest of MEA
      • By Material Type
      • By Capacity Type
      • By Product Type
      • By End Use
    • Market Attractiveness Analysis
      • By Country
      • By Material Type
      • By Capacity Type
      • By Product Type
      • By End Use
    • Key Takeaways
  18. Key Countries Market Analysis
    • USA
      • Pricing Analysis
      • Market Share Analysis, 2024
        • By Material Type
        • By Capacity Type
        • By Product Type
        • By End Use
    • Canada
      • Pricing Analysis
      • Market Share Analysis, 2024
        • By Material Type
        • By Capacity Type
        • By Product Type
        • By End Use
    • Brazil
      • Pricing Analysis
      • Market Share Analysis, 2024
        • By Material Type
        • By Capacity Type
        • By Product Type
        • By End Use
    • Mexico
      • Pricing Analysis
      • Market Share Analysis, 2024
        • By Material Type
        • By Capacity Type
        • By Product Type
        • By End Use
    • Argentina
      • Pricing Analysis
      • Market Share Analysis, 2024
        • By Material Type
        • By Capacity Type
        • By Product Type
        • By End Use
  19. Market Structure Analysis
    • Competition Dashboard
    • Competition Benchmarking
    • Market Share Analysis of Top Players
      • By Regional
      • By Material Type
      • By Capacity Type
      • By Product Type
      • By End Use
  20. Competition Analysis
    • Competition Deep Dive
      • Berry Global Inc.
        • Overview
        • Product Portfolio
        • Profitability by Market Segments (Product/Age /Sales Channel/Region)
        • Sales Footprint
        • Strategy Overview
          • Marketing Strategy
          • Product Strategy
          • Channel Strategy
      • Greif Inc.
        • Overview
        • Product Portfolio
        • Profitability by Market Segments (Product/Age /Sales Channel/Region)
        • Sales Footprint
        • Strategy Overview
          • Marketing Strategy
          • Product Strategy
          • Channel Strategy
      • Sintex Industries
        • Overview
        • Product Portfolio
        • Profitability by Market Segments (Product/Age /Sales Channel/Region)
        • Sales Footprint
        • Strategy Overview
          • Marketing Strategy
          • Product Strategy
          • Channel Strategy
      • Thrace Group
        • Overview
        • Product Portfolio
        • Profitability by Market Segments (Product/Age /Sales Channel/Region)
        • Sales Footprint
        • Strategy Overview
          • Marketing Strategy
          • Product Strategy
          • Channel Strategy
      • Nier Systems Inc.
        • Overview
        • Product Portfolio
        • Profitability by Market Segments (Product/Age /Sales Channel/Region)
        • Sales Footprint
        • Strategy Overview
          • Marketing Strategy
          • Product Strategy
          • Channel Strategy
      • Caretex
        • Overview
        • Product Portfolio
        • Profitability by Market Segments (Product/Age /Sales Channel/Region)
        • Sales Footprint
        • Strategy Overview
          • Marketing Strategy
          • Product Strategy
          • Channel Strategy
      • LC Packaging
        • Overview
        • Product Portfolio
        • Profitability by Market Segments (Product/Age /Sales Channel/Region)
        • Sales Footprint
        • Strategy Overview
          • Marketing Strategy
          • Product Strategy
          • Channel Strategy
      • Eceplast S.p.A
        • Overview
        • Product Portfolio
        • Profitability by Market Segments (Product/Age /Sales Channel/Region)
        • Sales Footprint
        • Strategy Overview
          • Marketing Strategy
          • Product Strategy
          • Channel Strategy
      • Bulk-Pack Inc.
        • Overview
        • Product Portfolio
        • Profitability by Market Segments (Product/Age /Sales Channel/Region)
        • Sales Footprint
        • Strategy Overview
          • Marketing Strategy
          • Product Strategy
          • Channel Strategy
      • Powertex
        • Overview
        • Product Portfolio
        • Profitability by Market Segments (Product/Age /Sales Channel/Region)
        • Sales Footprint
        • Strategy Overview
          • Marketing Strategy
          • Product Strategy
          • Channel Strategy
  21. Assumptions & Acronyms Used
  22. Research Methodology

List of Tables

  • Table 1: Global Market Value (USD Million) Forecast by Region, 2020-2035
  • Table 2: Global Market Volume (Metric Tons) Forecast by Region, 2020-2035
  • Table 3: Global Market Value (USD Million) Forecast by Material Type, 2020-2035
  • Table 4: Global Market Volume (Metric Tons) Forecast by Material Type, 2020-2035
  • Table 5: Global Market Value (USD Million) Forecast by Capacity Type, 2020-2035
  • Table 6: Global Market Volume (Metric Tons) Forecast by Capacity Type, 2020-2035
  • Table 7: Global Market Value (USD Million) Forecast by Product Type, 2020-2035
  • Table 8: Global Market Volume (Metric Tons) Forecast by Product Type, 2020-2035
  • Table 9: Global Market Value (USD Million) Forecast by End Use, 2020-2035
  • Table 10: Global Market Volume (Metric Tons) Forecast by End Use, 2020-2035
  • Table 11: North America Market Value (USD Million) Forecast by Country, 2020-2035
  • Table 12: North America Market Volume (Metric Tons) Forecast by Country, 2020-2035
  • Table 13: North America Market Value (USD Million) Forecast by Material Type, 2020-2035
  • Table 14: North America Market Volume (Metric Tons) Forecast by Material Type, 2020-2035
  • Table 15: North America Market Value (USD Million) Forecast by Capacity Type, 2020-2035
  • Table 16: North America Market Volume (Metric Tons) Forecast by Capacity Type, 2020-2035
  • Table 17: North America Market Value (USD Million) Forecast by Product Type, 2020-2035
  • Table 18: North America Market Volume (Metric Tons) Forecast by Product Type, 2020-2035
  • Table 19: North America Market Value (USD Million) Forecast by End Use, 2020-2035
  • Table 20: North America Market Volume (Metric Tons) Forecast by End Use, 2020-2035
  • Table 21: Latin America Market Value (USD Million) Forecast by Country, 2020-2035
  • Table 22: Latin America Market Volume (Metric Tons) Forecast by Country, 2020-2035
  • Table 23: Latin America Market Value (USD Million) Forecast by Material Type, 2020-2035
  • Table 24: Latin America Market Volume (Metric Tons) Forecast by Material Type, 2020-2035
  • Table 25: Latin America Market Value (USD Million) Forecast by Capacity Type, 2020-2035
  • Table 26: Latin America Market Volume (Metric Tons) Forecast by Capacity Type, 2020-2035
  • Table 27: Latin America Market Value (USD Million) Forecast by Product Type, 2020-2035
  • Table 28: Latin America Market Volume (Metric Tons) Forecast by Product Type, 2020-2035
  • Table 29: Latin America Market Value (USD Million) Forecast by End Use, 2020-2035
  • Table 30: Latin America Market Volume (Metric Tons) Forecast by End Use, 2020-2035
  • Table 31: Western Europe Market Value (USD Million) Forecast by Country, 2020-2035
  • Table 32: Western Europe Market Volume (Metric Tons) Forecast by Country, 2020-2035
  • Table 33: Western Europe Market Value (USD Million) Forecast by Material Type, 2020-2035
  • Table 34: Western Europe Market Volume (Metric Tons) Forecast by Material Type, 2020-2035
  • Table 35: Western Europe Market Value (USD Million) Forecast by Capacity Type, 2020-2035
  • Table 36: Western Europe Market Volume (Metric Tons) Forecast by Capacity Type, 2020-2035
  • Table 37: Western Europe Market Value (USD Million) Forecast by Product Type, 2020-2035
  • Table 38: Western Europe Market Volume (Metric Tons) Forecast by Product Type, 2020-2035
  • Table 39: Western Europe Market Value (USD Million) Forecast by End Use, 2020-2035
  • Table 40: Western Europe Market Volume (Metric Tons) Forecast by End Use, 2020-2035
  • Table 41: Eastern Europe Market Value (USD Million) Forecast by Country, 2020-2035
  • Table 42: Eastern Europe Market Volume (Metric Tons) Forecast by Country, 2020-2035
  • Table 43: Eastern Europe Market Value (USD Million) Forecast by Material Type, 2020-2035
  • Table 44: Eastern Europe Market Volume (Metric Tons) Forecast by Material Type, 2020-2035
  • Table 45: Eastern Europe Market Value (USD Million) Forecast by Capacity Type, 2020-2035
  • Table 46: Eastern Europe Market Volume (Metric Tons) Forecast by Capacity Type, 2020-2035
  • Table 47: Eastern Europe Market Value (USD Million) Forecast by Product Type, 2020-2035
  • Table 48: Eastern Europe Market Volume (Metric Tons) Forecast by Product Type, 2020-2035
  • Table 49: Eastern Europe Market Value (USD Million) Forecast by End Use, 2020-2035
  • Table 50: Eastern Europe Market Volume (Metric Tons) Forecast by End Use, 2020-2035
  • Table 51: East Asia Market Value (USD Million) Forecast by Country, 2020-2035
  • Table 52: East Asia Market Volume (Metric Tons) Forecast by Country, 2020-2035
  • Table 53: East Asia Market Value (USD Million) Forecast by Material Type, 2020-2035
  • Table 54: East Asia Market Volume (Metric Tons) Forecast by Material Type, 2020-2035
  • Table 55: East Asia Market Value (USD Million) Forecast by Capacity Type, 2020-2035
  • Table 56: East Asia Market Volume (Metric Tons) Forecast by Capacity Type, 2020-2035
  • Table 57: East Asia Market Value (USD Million) Forecast by Product Type, 2020-2035
  • Table 58: East Asia Market Volume (Metric Tons) Forecast by Product Type, 2020-2035
  • Table 59: East Asia Market Value (USD Million) Forecast by End Use, 2020-2035
  • Table 60: East Asia Market Volume (Metric Tons) Forecast by End Use, 2020-2035
  • Table 61: South Asia & Pacific Market Value (USD Million) Forecast by Country, 2020-2035
  • Table 62: South Asia & Pacific Market Volume (Metric Tons) Forecast by Country, 2020-2035
  • Table 63: South Asia & Pacific Market Value (USD Million) Forecast by Material Type, 2020-2035
  • Table 64: South Asia & Pacific Market Volume (Metric Tons) Forecast by Material Type, 2020-2035
  • Table 65: South Asia & Pacific Market Value (USD Million) Forecast by Capacity Type, 2020-2035
  • Table 66: South Asia & Pacific Market Volume (Metric Tons) Forecast by Capacity Type, 2020-2035
  • Table 67: South Asia & Pacific Market Value (USD Million) Forecast by Product Type, 2020-2035
  • Table 68: South Asia & Pacific Market Volume (Metric Tons) Forecast by Product Type, 2020-2035
  • Table 69: South Asia & Pacific Market Value (USD Million) Forecast by End Use, 2020-2035
  • Table 70: South Asia & Pacific Market Volume (Metric Tons) Forecast by End Use, 2020-2035
  • Table 71: Middle East and Africa Market Value (USD Million) Forecast by Country, 2020-2035
  • Table 72: Middle East and Africa Market Volume (Metric Tons) Forecast by Country, 2020-2035
  • Table 73: Middle East and Africa Market Value (USD Million) Forecast by Material Type, 2020-2035
  • Table 74: Middle East and Africa Market Volume (Metric Tons) Forecast by Material Type, 2020-2035
  • Table 75: Middle East and Africa Market Value (USD Million) Forecast by Capacity Type, 2020-2035
  • Table 76: Middle East and Africa Market Volume (Metric Tons) Forecast by Capacity Type, 2020-2035
  • Table 77: Middle East and Africa Market Value (USD Million) Forecast by Product Type, 2020-2035
  • Table 78: Middle East and Africa Market Volume (Metric Tons) Forecast by Product Type, 2020-2035
  • Table 79: Middle East and Africa Market Value (USD Million) Forecast by End Use, 2020-2035
  • Table 80: Middle East and Africa Market Volume (Metric Tons) Forecast by End Use, 2020-2035

List of Figures

  • Figure 1: Global Market Volume (Metric Tons) Forecast 2020-2035
  • Figure 2: Global Market Pricing Analysis
  • Figure 3: Global Market Value (USD Million) Forecast 2020-2035
  • Figure 4: Global Market Value Share and BPS Analysis by Material Type, 2025 and 2035
  • Figure 5: Global Market Y-o-Y Growth Comparison by Material Type, 2025-2035
  • Figure 6: Global Market Attractiveness Analysis by Material Type
  • Figure 7: Global Market Value Share and BPS Analysis by Capacity Type, 2025 and 2035
  • Figure 8: Global Market Y-o-Y Growth Comparison by Capacity Type, 2025-2035
  • Figure 9: Global Market Attractiveness Analysis by Capacity Type
  • Figure 10: Global Market Value Share and BPS Analysis by Product Type, 2025 and 2035
  • Figure 11: Global Market Y-o-Y Growth Comparison by Product Type, 2025-2035
  • Figure 12: Global Market Attractiveness Analysis by Product Type
  • Figure 13: Global Market Value Share and BPS Analysis by End Use, 2025 and 2035
  • Figure 14: Global Market Y-o-Y Growth Comparison by End Use, 2025-2035
  • Figure 15: Global Market Attractiveness Analysis by End Use
  • Figure 16: Global Market Value (USD Million) Share and BPS Analysis by Region, 2025 and 2035
  • Figure 17: Global Market Y-o-Y Growth Comparison by Region, 2025-2035
  • Figure 18: Global Market Attractiveness Analysis by Region
  • Figure 19: North America Market Incremental $ Opportunity, 2025-2035
  • Figure 20: Latin America Market Incremental $ Opportunity, 2025-2035
  • Figure 21: Western Europe Market Incremental $ Opportunity, 2025-2035
  • Figure 22: Eastern Europe Market Incremental $ Opportunity, 2025-2035
  • Figure 23: East Asia Market Incremental $ Opportunity, 2025-2035
  • Figure 24: South Asia & Pacific Market Incremental $ Opportunity, 2025-2035
  • Figure 25: Middle East and Africa Market Incremental $ Opportunity, 2025-2035
  • Figure 26: North America Market Value Share and BPS Analysis by Country, 2025 and 2035
  • Figure 27: North America Market Value Share and BPS Analysis by Material Type, 2025 and 2035
  • Figure 28: North America Market Y-o-Y Growth Comparison by Material Type, 2025-2035
  • Figure 29: North America Market Attractiveness Analysis by Material Type
  • Figure 30: North America Market Value Share and BPS Analysis by Capacity Type, 2025 and 2035
  • Figure 31: North America Market Y-o-Y Growth Comparison by Capacity Type, 2025-2035
  • Figure 32: North America Market Attractiveness Analysis by Capacity Type
  • Figure 33: North America Market Value Share and BPS Analysis by Product Type, 2025 and 2035
  • Figure 34: North America Market Y-o-Y Growth Comparison by Product Type, 2025-2035
  • Figure 35: North America Market Attractiveness Analysis by Product Type
  • Figure 36: North America Market Value Share and BPS Analysis by End Use, 2025 and 2035
  • Figure 37: North America Market Y-o-Y Growth Comparison by End Use, 2025-2035
  • Figure 38: North America Market Attractiveness Analysis by End Use
  • Figure 39: Latin America Market Value Share and BPS Analysis by Country, 2025 and 2035
  • Figure 40: Latin America Market Value Share and BPS Analysis by Material Type, 2025 and 2035
  • Figure 41: Latin America Market Y-o-Y Growth Comparison by Material Type, 2025-2035
  • Figure 42: Latin America Market Attractiveness Analysis by Material Type
  • Figure 43: Latin America Market Value Share and BPS Analysis by Capacity Type, 2025 and 2035
  • Figure 44: Latin America Market Y-o-Y Growth Comparison by Capacity Type, 2025-2035
  • Figure 45: Latin America Market Attractiveness Analysis by Capacity Type
  • Figure 46: Latin America Market Value Share and BPS Analysis by Product Type, 2025 and 2035
  • Figure 47: Latin America Market Y-o-Y Growth Comparison by Product Type, 2025-2035
  • Figure 48: Latin America Market Attractiveness Analysis by Product Type
  • Figure 49: Latin America Market Value Share and BPS Analysis by End Use, 2025 and 2035
  • Figure 50: Latin America Market Y-o-Y Growth Comparison by End Use, 2025-2035
  • Figure 51: Latin America Market Attractiveness Analysis by End Use
  • Figure 52: Western Europe Market Value Share and BPS Analysis by Country, 2025 and 2035
  • Figure 53: Western Europe Market Value Share and BPS Analysis by Material Type, 2025 and 2035
  • Figure 54: Western Europe Market Y-o-Y Growth Comparison by Material Type, 2025-2035
  • Figure 55: Western Europe Market Attractiveness Analysis by Material Type
  • Figure 56: Western Europe Market Value Share and BPS Analysis by Capacity Type, 2025 and 2035
  • Figure 57: Western Europe Market Y-o-Y Growth Comparison by Capacity Type, 2025-2035
  • Figure 58: Western Europe Market Attractiveness Analysis by Capacity Type
  • Figure 59: Western Europe Market Value Share and BPS Analysis by Product Type, 2025 and 2035
  • Figure 60: Western Europe Market Y-o-Y Growth Comparison by Product Type, 2025-2035
  • Figure 61: Western Europe Market Attractiveness Analysis by Product Type
  • Figure 62: Western Europe Market Value Share and BPS Analysis by End Use, 2025 and 2035
  • Figure 63: Western Europe Market Y-o-Y Growth Comparison by End Use, 2025-2035
  • Figure 64: Western Europe Market Attractiveness Analysis by End Use
  • Figure 65: Eastern Europe Market Value Share and BPS Analysis by Country, 2025 and 2035
  • Figure 66: Eastern Europe Market Value Share and BPS Analysis by Material Type, 2025 and 2035
  • Figure 67: Eastern Europe Market Y-o-Y Growth Comparison by Material Type, 2025-2035
  • Figure 68: Eastern Europe Market Attractiveness Analysis by Material Type
  • Figure 69: Eastern Europe Market Value Share and BPS Analysis by Capacity Type, 2025 and 2035
  • Figure 70: Eastern Europe Market Y-o-Y Growth Comparison by Capacity Type, 2025-2035
  • Figure 71: Eastern Europe Market Attractiveness Analysis by Capacity Type
  • Figure 72: Eastern Europe Market Value Share and BPS Analysis by Product Type, 2025 and 2035
  • Figure 73: Eastern Europe Market Y-o-Y Growth Comparison by Product Type, 2025-2035
  • Figure 74: Eastern Europe Market Attractiveness Analysis by Product Type
  • Figure 75: Eastern Europe Market Value Share and BPS Analysis by End Use, 2025 and 2035
  • Figure 76: Eastern Europe Market Y-o-Y Growth Comparison by End Use, 2025-2035
  • Figure 77: Eastern Europe Market Attractiveness Analysis by End Use
  • Figure 78: East Asia Market Value Share and BPS Analysis by Country, 2025 and 2035
  • Figure 79: East Asia Market Value Share and BPS Analysis by Material Type, 2025 and 2035
  • Figure 80: East Asia Market Y-o-Y Growth Comparison by Material Type, 2025-2035
  • Figure 81: East Asia Market Attractiveness Analysis by Material Type
  • Figure 82: East Asia Market Value Share and BPS Analysis by Capacity Type, 2025 and 2035
  • Figure 83: East Asia Market Y-o-Y Growth Comparison by Capacity Type, 2025-2035
  • Figure 84: East Asia Market Attractiveness Analysis by Capacity Type
  • Figure 85: East Asia Market Value Share and BPS Analysis by Product Type, 2025 and 2035
  • Figure 86: East Asia Market Y-o-Y Growth Comparison by Product Type, 2025-2035
  • Figure 87: East Asia Market Attractiveness Analysis by Product Type
  • Figure 88: East Asia Market Value Share and BPS Analysis by End Use, 2025 and 2035
  • Figure 89: East Asia Market Y-o-Y Growth Comparison by End Use, 2025-2035
  • Figure 90: East Asia Market Attractiveness Analysis by End Use
  • Figure 91: South Asia & Pacific Market Value Share and BPS Analysis by Country, 2025 and 2035
  • Figure 92: South Asia & Pacific Market Value Share and BPS Analysis by Material Type, 2025 and 2035
  • Figure 93: South Asia & Pacific Market Y-o-Y Growth Comparison by Material Type, 2025-2035
  • Figure 94: South Asia & Pacific Market Attractiveness Analysis by Material Type
  • Figure 95: South Asia & Pacific Market Value Share and BPS Analysis by Capacity Type, 2025 and 2035
  • Figure 96: South Asia & Pacific Market Y-o-Y Growth Comparison by Capacity Type, 2025-2035
  • Figure 97: South Asia & Pacific Market Attractiveness Analysis by Capacity Type
  • Figure 98: South Asia & Pacific Market Value Share and BPS Analysis by Product Type, 2025 and 2035
  • Figure 99: South Asia & Pacific Market Y-o-Y Growth Comparison by Product Type, 2025-2035
  • Figure 100: South Asia & Pacific Market Attractiveness Analysis by Product Type
  • Figure 101: South Asia & Pacific Market Value Share and BPS Analysis by End Use, 2025 and 2035
  • Figure 102: South Asia & Pacific Market Y-o-Y Growth Comparison by End Use, 2025-2035
  • Figure 103: South Asia & Pacific Market Attractiveness Analysis by End Use
  • Figure 104: Middle East and Africa Market Value Share and BPS Analysis by Country, 2025 and 2035
  • Figure 105: Middle East and Africa Market Value Share and BPS Analysis by Material Type, 2025 and 2035
  • Figure 106: Middle East and Africa Market Y-o-Y Growth Comparison by Material Type, 2025-2035
  • Figure 107: Middle East and Africa Market Attractiveness Analysis by Material Type
  • Figure 108: Middle East and Africa Market Value Share and BPS Analysis by Capacity Type, 2025 and 2035
  • Figure 109: Middle East and Africa Market Y-o-Y Growth Comparison by Capacity Type, 2025-2035
  • Figure 110: Middle East and Africa Market Attractiveness Analysis by Capacity Type
  • Figure 111: Middle East and Africa Market Value Share and BPS Analysis by Product Type, 2025 and 2035
  • Figure 112: Middle East and Africa Market Y-o-Y Growth Comparison by Product Type, 2025-2035
  • Figure 113: Middle East and Africa Market Attractiveness Analysis by Product Type
  • Figure 114: Middle East and Africa Market Value Share and BPS Analysis by End Use, 2025 and 2035
  • Figure 115: Middle East and Africa Market Y-o-Y Growth Comparison by End Use, 2025-2035
  • Figure 116: Middle East and Africa Market Attractiveness Analysis by End Use
  • Figure 117: Global Market - Tier Structure Analysis
  • Figure 118: Global Market - Company Share Analysis

Frequently Asked Questions

What is the forecasted CAGR of the Container Liner Market from 2025 to 2035?

The market is expected to grow at a CAGR of 4.6% during this period.

Which container liner capacity type holds the largest market share?

40 Foot liners dominate, holding 47% of the market share in 2025.

What is the leading material used in container liners?

What is the leading material used in container liners?

Which product type leads the container liner market?

Top Fill liners lead with a 29% share of the market.

Which regions are expected to witness the highest growth?

The United States leads with a CAGR of 6.5%, followed by South Korea (6.3%), the United Kingdom (6.2%), and Japan (6.0%).

Explore Similar Insights

Future Market Insights

Container Liner Market