Full Container Shrink Sleeves Market Size, Share, and Forecast Outlook 2025 to 2035

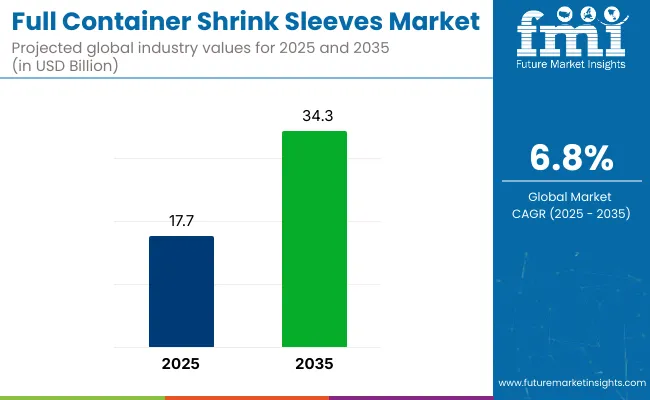
In 2025, the global full container shrink sleeves (FCSS) market is expected to reach USD 17.7 billion, growing to USD 34.3 billion by 2035 at a 6.8% CAGR. This growth is fueled by increasing demand for visually striking, tamper-evident labels with 360° coverage, especially in the food & beverage, pharmaceutical, cosmetic, and household chemical sectors.
Quick Stats of Full Container Shrink Sleeves Market

  • Market Value (2025): USD 17.7 billion
  • Forecast Value (2035): USD 34.3 billion
  • Forecast CAGR: 6.8%
  • Product Leader in 2025: Polyethylene (PE) - 39% market share
  • Top Distribution Channel: Food & Beverage sector - 46% share
  • Key Growth Region: European Union (7.0% CAGR)
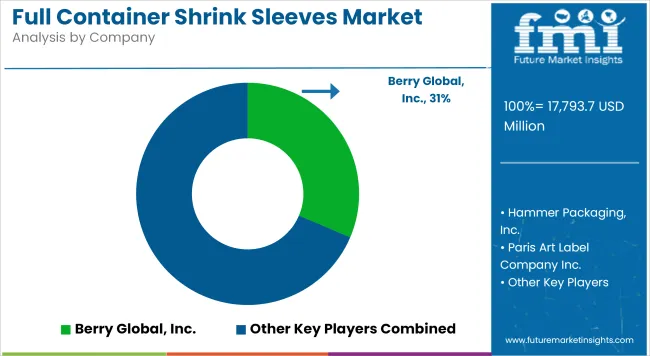
  • Leading Player: Berry Global, Inc. (31% industry share)

Full Container Shrink Sleeves Market

Attribute Detail
Industry Size (2025) USD 17.7 billion
Industry Size (2035) USD 34.3 billion
CAGR (2025 to 2035) 6.8%

FCSS labels offer superior shelf appeal and fit complex container shapes, enhancing brand value. Eco-friendly films like PET-G, PLA, and polyolefins are gaining traction amid ecofriendly mandates. Advancements in digital and flexographic printing support faster, customized runs, with Asia-Pacific leading due to strong manufacturing and consumption bases.

The market holds varying degrees of share across its parent markets. It accounts for approximately 5-7% of the global packaging market, driven by its niche but growing role in product differentiation. Within the labeling and decoration market, it commands a larger share around 18-22%, due to its increasing preference over traditional labels for 360-degree coverage.

In the plastic films and sheets market, it represents roughly 3-4%, as it is just one of many applications for plastic films. It forms about 6-8% of the flexible packaging market, with rising adoption in retail sectors. In the beverage and food packaging market, it makes up around 12-15%, supported by branding needs, tamper evidence, and high-volume usage.

In a November 2024 interview with Packaging Strategies, Geoffrey Martin, CEO of CCL Label, emphasized the growing role of shrink sleeves as a strategic branding asset. He noted that as packaging evolves into a primary medium for conveying sustainability and innovation, clients increasingly demand solutions that balance high performance with visual appeal.

Hill underscored CCL’s commitment to expanding eco-efficient shrink sleeve options that maintain premium print quality. This perspective highlights the industry's dual priorities brand differentiation and environmental responsibility. With ongoing material innovation and changing consumer expectations, FCSS are expected to become a core element of product marketing strategies well into 2035.

Analyzing Full Container Shrink Sleeves Market by Top Investment Segments

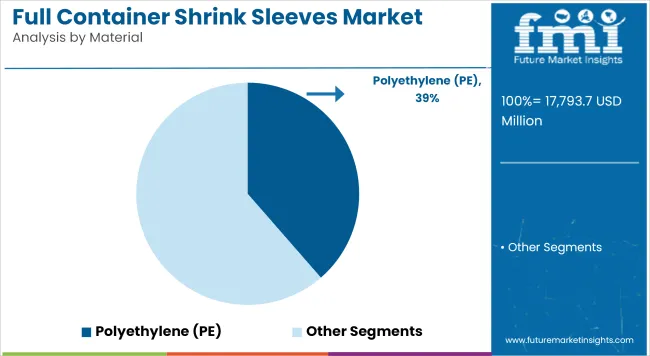
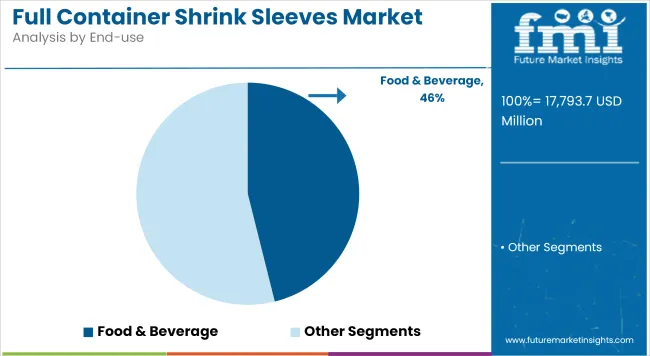
Polyethylene (PE) dominates the material segment with a 39% market share, while food & beverage leads end-use applications with 46% share in 2025. Market growth is attributed to increasing demand for tamper-proof labeling, enhanced branding space, and growing global packaging volumes across FMCG, pharmaceutical, and personal care sectors.
Polyethylene Captures Lead with 39% Share in 2025

Full Container Shrink Sleeves Market Analysis By Material

Polyethylene (PE) is projected to command 39% of the global market share in 2025, making it the top material used for shrink sleeves. Its dominance is driven by its high flexibility, low production cost, and print adaptability. Major producers like Berry Global, Clicker Pentaplast, and Amcor have expanded PE-based production lines due to its widespread application across beverage and personal care markets.
  • Global PE sleeve usage expected to surpass 1.7 million tons by 2030, up from 1.1 million tons in 2025, indicating a strong replacement trend from rigid labeling.
  • PE-based shrink sleeves offer up to 20% cost savings over PETG and PVC in high-volume bottling applications.
  • Over 45% of bottled water brands globally used PE full-body sleeves as of 2024 due to form-fit flexibility and clarity.

Food & Beverage Segment to Maintain 46% Dominance in 2025

Full Container Shrink Sleeves Market Analysis By End Use

The food & beverage industry will lead end-use demand with a 46% market share in 2025, equivalent to approximately USD 8.19 billion in value. High consumption of bottled drinks, sauces, and dairy products has led to widespread deployment of shrink sleeves for 360-degree branding. Companies like Nestlé, PepsiCo, and Danone use full-body sleeves on high-SKU product lines to improve visual differentiation and shelf appeal.

  • Global bottled beverage volumes exceeded 480 billion liters in 2024, with over 38% packaged using full shrink sleeves.
  • Shrink sleeve penetration in Asia-Pacific beverage packaging reached 51% by late 2024 due to demand in India and China.
  • Over 67% of new RTD tea and energy drink launches in North America featured full-body sleeves in 2024.

Top Full Container Shrink Sleeves Market Dynamics

Demand patterns in the full container shrink sleeves market are shifting toward low-waste, application-efficient formats driven by filling line upgrades and label contamination controls. Resin cost instability, recycling mandates, and brand-specific artwork complexity are pushing converters to rethink material blends, adhesive chemistries, and line-speed compatibility for beverage, homecare, and nutraceutical products.

Line Throughput Optimization and Mislabeling Risk Reduction

Filling operators in Mexico and Poland upgraded shrink tunnel systems to infrared-assisted variants, improving label adhesion on PET containers at high speeds. Average sleeve application errors dropped from 3.2% to 1.4% on 600 bpm lines after shifting to low-memory polyolefin films.

Thailand-based beverage co-packers reported a 17% rise in line efficiency after replacing full-body PVC sleeves with hybrid PETG formulations. Automated optical verification tools introduced on French nutraceutical lines reduced downstream rejection tied to sleeve rotation by 23%. These refinements allowed shorter job changeovers, lowering idle time between batch runs and improving SKU flexibility in private-label and short-run segments.

Artwork Complexity Driving Print and Waste Management Shifts

Label art variation across SKUs has led converters in Brazil and South Korea to transition toward inline digital print systems for 500-5,000-unit runs. Across Q1 2025, average print-ready file processing time fell by 34% with AI-driven prepress automation.

Shrink sleeve scrap generation in short-run projects dropped 12% due to better alignment between artwork layout and cutter registration marks. Homecare brands switching to tamper-evident full-body sleeves added variable data zones QR, batch ID, localized barcodes triggering retrofits across flexo-digital hybrid lines. The move has intensified material planning cycles and prompted downstream recyclers to request pre-separated substrates for waste stream compatibility.

Margin Strain from Resin Prices and Film Transition Costs

From January to May 2025, PETG and OPS resin prices rose by 9-12% YoY, squeezing converter margins. European brands seeking PVC-free compliance accelerated trials of recyclable mono material films, raising formulation costs and slowing large-scale rollouts.

Mid-sized converters in India reported per-unit cost increases of USD 0.006 to USD 0.009 due to adhesive changes needed for new eco-aligned films. Some FMCG buyers reduced SKU counts and froze price points, passing inventory risk to converters. Vendors responded by consolidating procurement cycles, extending roll lengths to cut changeovers, and adjusting customer contracts to include resin price indexing. These adaptations are reshaping delivery terms across beverage, cosmetic, and household supply chains.
Top Countries Driving Growth in the Full Container Shrink Sleeves Market

Country Wise Analysis Of Full Container Shrink Sleeves Market

Countries CAGR (2025 to 2035)
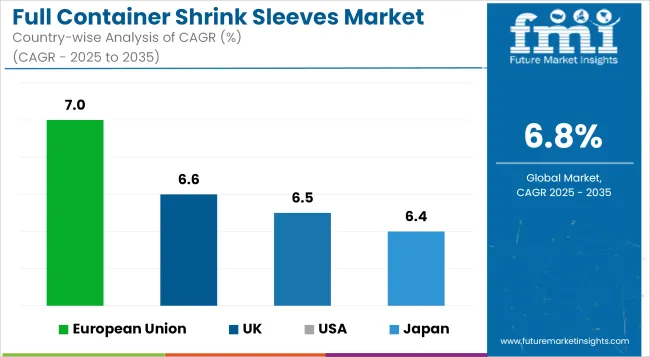
European Union 7.0%
South Korea 6.7%
United Kingdom 6.6%
United States 6.5%
Japan 6.4%

The global market for FCSS is anticipated to grow at a 6.8% CAGR between 2025 and 2035. Among OECD participants, the European Union leads with a 7.0% CAGR -0.2% points above the global benchmark. South Korea follows closely at 6.7% (-0.1%), while the United Kingdom and United States trail slightly at 6.6% (-0.2%) and 6.5% (-0.3%), respectively.

Japan registers the lowest among this group at 6.4% (-0.4%). No BRICS members appear among the top performers, highlighting an ongoing regional divergence in packaging technology adoption. These figures reflect a steady push in OECD economies for automated packaging workflows and visual branding continuity, with growth variations largely shaped by regulatory momentum and localized production capabilities.

The report covers detailed analysis of 40+ countries, with the top five countries shared as a reference.

Market Expansion Outlook for Full Container Shrink Sleeves in the European Union

The EU full container shrink sleeves market is advancing at a CAGR of 7.0%, supported by stringent labeling regulations across sectors like food, beverages, and pharmaceuticals. Over 58% of beverage manufacturers in the region have transitioned to full body shrink sleeves for SKU differentiation and tamper evidence.

Moreover, thermoform-compatible sleeve labels are now found on over 35% of dairy and yogurt-based drink packaging. The market is driven by increasing investments in high-barrier sleeve films, with Germany and France accounting for nearly 40% of the regional demand.

  • Full-body sleeve penetration in alcoholic RTDs exceeded 62% in 2024.
  • Over 45% of nutraceutical exports from Spain now use digitally printed shrink sleeves.
  • EU-based packaging converters saw a 12% YoY rise in shrink sleeve orders from SME brands.

Growth Assessment of Full Container Shrink Sleeves Market in the United States

With a projected CAGR of 6.5%, the USA shrink sleeves market is being propelled by SKU proliferation and shelf-level visual competition. As of 2024, over 67% of flavored water and carbonated soft drinks feature shrink sleeve labeling, up from 52% in 2020.

Around 48% of brand managers in the mid-tier cosmetics sector identified shrink sleeves as their top strategy for visual differentiation. Increasing usage in functional beverages and cold-brew coffee segments has led to a 9.4% increase in demand for seamless 360° sleeve formats.

  • More than 31% of wellness beverage startups adopted biodegradable shrink sleeve films in 2024.
  • Over 70% of limited-time flavored sodas used holographic sleeve variants in Q1 2025.
  • Contract manufacturers reported a 16% growth in sleeve application equipment sales year-over-year.

Future Outlook for Full Container Shrink Sleeves in the United Kingdom

The FCSS market in UK, growing at 6.6% CAGR, is witnessing a strategic shift post-Brexit, with over 59% of FMCG exporters opting for sleeves to strengthen brand recognition abroad. Sleeve adoption in the UK’s alcoholic beverage sector has surged, with 72% of craft distilleries using shrink sleeves for branding flexibility. In Q2 2025 alone, more than 19 million units of shrink-sleeve-labeled condiments were distributed via private-label supermarket chains.

  • Digital sleeve print volumes grew by 27% in 2024 among boutique beverage brands.
  • 34% of premium dairy producers integrated embossed texture sleeves in early 2025.
  • Export-ready brands in personal care recorded a 21% increase in tamper-evident sleeve adoption.

Competitive Dynamics of Full Container Shrink Sleeves in Japan

The FC shrink sleeves market in Japan is expanding at 6.4% CAGR, backed by high-tech manufacturing and packaging automation. Over 43% of personal hygiene and wellness drinks now feature shrink sleeves with anti-fraud QR integrations.

Packaging audits in Q1 2025 revealed that over 60% of limited-edition beverages used shrink sleeves as the primary labeling format. The high-resolution CMYK shrink sleeves are seeing usage in over 35% of functional drink SKUs in Japan’s convenience store channel.

  • 29% of shrink sleeve applications now include micro-text and laser-etched identifiers.
  • The smart-label-ready sleeve market is projected to exceed USD 120M in Japan by 2027.
  • Over 52% of consumer electronics brands used decorative sleeves in Q4 2024 for campaign packaging.

Demand Trends for Full Container Shrink Sleeves in South Korea

The full container shrink sleeves market in South Korea is growing at 6.7%, powered by beauty-beverage innovation and cross-category design influence. In 2024, more than 66% of K-beauty beverage SKUs featured stylized shrink sleeves, with gradient and UV-reactive designs seeing sharp growth.

An estimated 24% increase in e-commerce-ready packaging formats was recorded between 2023 and 2024. Packaging resilience testing indicated shrink sleeves outperformed conventional labels by 31% in transit durability across DTC (direct-to-consumer) fulfillment models.
  • 38% of health drink brands adopted soft-touch sleeve films for tactile appeal in 2025.
  • Over 41% of e-commerce-exclusive brands are integrating NFC-enabled shrink sleeves.
  • Matte-varnish sleeve production volume grew by 19% YoY among high-end supplement makers.

Leading Full Container Shrink Sleeves Manufacturers, Suppliers, Distributors Leading player

Full Container Shrink Sleeves Market Analysis By Company

Berry Global, Inc. holding 31% Industry share

The industry is dominated by key players like Berry Global, Inc. and Avery Dennison Corporation, which leverage acquisitions and product innovations to maintain leadership. Fuji Seal International, Inc. invests in R&D for high-performance films, while Klöckner Pentaplast and Constantia Flexibles benefit from economies of scale.

Emerging competitors, such as Taurus Packaging and Bothra Industries, focus on affordability and niche markets to gain traction. Entry barriers include high capital costs for advanced machinery and compliance with strict industry standards.

Established brands like Hammer Packaging, Inc. and Macfarlane Group PLC enjoy strong customer loyalty, making it difficult for new entrants to compete. Smaller firms, including Paris Art Label Company Inc., differentiate through rapid customization and unique designs to carve out market share. Regulatory complexities further increase operational challenges.

Recent Industry News

  • In 2024, Berry Global revolutionized shrink sleeve application with its new high-speed applicator, slashing application time by 20% while maintaining energy efficiency - a game-changer for beverage production lines.
  • In 2024, CCL Industries strategically expanded its European footprint by acquiring a specialty shrink sleeve manufacturer, strengthening its position in the fast-growing craft beer and spirits packaging market.

Leading Players

  • Berry Global, Inc.
  • Hammer Packaging, Inc.
  • Paris Art Label Company Inc.
  • Avery Dennison Corporation
  • Constantia Flexibles
  • KlöcknerPentaplast
  • Macfarlane Group PLC
  • Fuji Seal International, Inc.
  • Bothra Industries
  • Taurus Packaging

Report Scope of Full Container Shrink Sleeves Market

Report Attributes Details
Market Size (2025) USD 17.7 billion
Projected Market Size (2035) USD 34.3 billion
CAGR (2025 to 2035) 6.8%
Base Year for Estimation 2024
Historical Period 2020 to 2024
Projection Period 2025 to 2035
Quantitative Units USD billion for value and million square meters for volume
Material Types Analyzed (Segment 1) Polyethylene (PE), Polyvinyl Chloride (PVC), Polyethylene Terephthalate (PET), Polylactic Acid (PLA), Others
End-use Industries Covered (Segment 2) Food & Beverage, Pharmaceuticals, Household, Personal Care & Cosmetics, Others
Regions Covered North America, Latin America, Western Europe, Eastern Europe, East Asia, South Asia Pacific, Middle East & Africa
Countries Tracked United States, Canada, Germany, France, Italy, India, China, Japan, Brazil, South Korea
Key Players Berry Global, Inc., Hammer Packaging, Inc., Paris Art Label Company Inc., Avery Dennison Corporation, Constantia Flexibles, Klöckner Pentaplast, Macfarlane Group PLC, Fuji Seal International, Inc., Bothra Industries, Taurus Packaging
Additional Attributes Dollar sales, share by resin type and end-use, demand driven by FMCG and pharmaceutical packaging, rapid shift toward PET and PLA films, expansion of personalization and digital printing, regional production hubs emerging in South Asia Pacific and Latin America

Key Segments

By Material:

  • Polyethylene (PE)
  • Polyvinyl Chloride (PVC)
  • Polyethylene Terephthalate (PET)
  • Polylactic Acid (PLA)
  • Others

By End-use:

  • Food & Beverage
  • Pharmaceuticals
  • Household
  • Personal Care & Cosmetics
  • Others

By Region:

  • North America
  • Latin America
  • Western Europe
  • Eastern Europe
  • East Asia
  • South Asia Pacific
  • Middle East and Africa

Table of Content

  1. Executive Summary
    • Global Market Outlook
    • Demand-side Trends
    • Supply-side Trends
    • Technology Roadmap Analysis
    • Analysis and Recommendations
  2. Market Overview
    • Market Coverage/Taxonomy
    • Market Definition/Scope/Limitations
  3. Market Background
    • Market Dynamics
      • Drivers
      • Restraints
      • Opportunity
      • Trends
    • Scenario Forecast
      • Demand in Optimistic Scenario
      • Demand in Likely Scenario
      • Demand in Conservative Scenario
    • Opportunity Map Analysis
    • Product Life Cycle Analysis
    • Supply Chain Analysis
      • Supply Side Participants and their Roles
        • Producers
        • Mid-Level Participants (Traders/ Agents/ Brokers)
        • Wholesalers and Distributors
      • Value Added and Value Created at Node in the Supply Chain
      • List of Raw Material Suppliers
      • List of Existing and Potential Buyer’s
    • Investment Feasibility Matrix
    • Value Chain Analysis
      • Profit Margin Analysis
      • Wholesalers and Distributors
      • Retailers
    • PESTLE and Porter’s Analysis
    • Regulatory Landscape
      • By Key Regions
      • By Key Countries
    • Regional Parent Market Outlook
    • Production and Consumption Statistics
    • Import and Export Statistics
  4. Global Market Analysis 2020 to 2024 and Forecast, 2025 to 2035
    • Historical Market Size Value (USD Billion) & Volume (K Units) Analysis, 2020 to 2024
    • Current and Future Market Size Value (USD Billion) & Volume (K Units) Projections, 2025 to 2035
      • Y-o-Y Growth Trend Analysis
      • Absolute $ Opportunity Analysis
  5. Global Market Pricing Analysis 2020 to 2024 and Forecast 2025 to 2035
  6. Global Market Analysis 2020 to 2024 and Forecast 2025 to 2035, By Material
    • Introduction/Key Findings
    • Historical Market Size Value (USD Billion) & Volume (K Units) Analysis By Material, 2020 to 2024
    • Current and Future Market Size Value (USD Billion) & Volume (K Units) Analysis and Forecast By Material, 2025 to 2035
      • Polyethylene (PE)
      • Polyvinyl Chloride (PVC)
      • Polyethylene Terephthalate (PET)
      • Polylactic Acid (PLA)
      • Others
    • Y-o-Y Growth Trend Analysis By Material, 2020 to 2024
    • Absolute $ Opportunity Analysis By Material, 2025 to 2035
  7. Global Market Analysis 2020 to 2024 and Forecast 2025 to 2035, By End-use
    • Introduction/Key Findings
    • Historical Market Size Value (USD Billion) & Volume (K Units) Analysis By End-use, 2020 to 2024
    • Current and Future Market Size Value (USD Billion) & Volume (K Units) Analysis and Forecast By End-use, 2025 to 2035
      • Food & Beverage
      • Pharmaceuticals
      • Household
      • Personal Care & Cosmetics
      • Others
    • Y-o-Y Growth Trend Analysis By End-use, 2020 to 2024
    • Absolute $ Opportunity Analysis By End-use, 2025 to 2035
  8. Global Market Analysis 2020 to 2024 and Forecast 2025 to 2035, By Region
    • Introduction
    • Historical Market Size Value (USD Billion) & Volume (K Units) Analysis By Region, 2020 to 2024
    • Current Market Size Value (USD Billion) & Volume (K Units) Analysis and Forecast By Region, 2025 to 2035
      • North America
      • Latin America
      • Western Europe
      • Eastern Europe
      • East Asia
      • South Asia & Pacific
      • Middle East and Africa
    • Market Attractiveness Analysis By Region
  9. North America Market Analysis 2020 to 2024 and Forecast 2025 to 2035, By Country
    • Historical Market Size Value (USD Billion) & Volume (K Units) Trend Analysis By Market Taxonomy, 2020 to 2024
    • Market Size Value (USD Billion) & Volume (K Units) Forecast By Market Taxonomy, 2025 to 2035
      • By Country
        • USA
        • Canada
        • Mexico
      • By Material
      • By End-use
    • Market Attractiveness Analysis
      • By Country
      • By Material
      • By End-use
    • Key Takeaways
  10. Latin America Market Analysis 2020 to 2024 and Forecast 2025 to 2035, By Country
    • Historical Market Size Value (USD Billion) & Volume (K Units) Trend Analysis By Market Taxonomy, 2020 to 2024
    • Market Size Value (USD Billion) & Volume (K Units) Forecast By Market Taxonomy, 2025 to 2035
      • By Country
        • Brazil
        • Argentina
        • Rest of LATAM
      • By Material
      • By End-use
    • Market Attractiveness Analysis
      • By Country
      • By Material
      • By End-use
    • Key Takeaways
  11. Western Europe Market Analysis 2020 to 2024 and Forecast 2025 to 2035, By Country
    • Historical Market Size Value (USD Billion) & Volume (K Units) Trend Analysis By Market Taxonomy, 2020 to 2024
    • Market Size Value (USD Billion) & Volume (K Units) Forecast By Market Taxonomy, 2025 to 2035
      • By Country
        • Germany
        • Italy
        • France
        • UK
        • Spain
        • BENELUX
        • Nordic
        • Rest of W.Europe
      • By Material
      • By End-use
    • Market Attractiveness Analysis
      • By Country
      • By Material
      • By End-use
    • Key Takeaways
  12. Eastern Europe Market Analysis 2020 to 2024 and Forecast 2025 to 2035, By Country
    • Historical Market Size Value (USD Billion) & Volume (K Units) Trend Analysis By Market Taxonomy, 2020 to 2024
    • Market Size Value (USD Billion) & Volume (K Units) Forecast By Market Taxonomy, 2025 to 2035
      • By Country
        • Russia
        • Hungary
        • Poland
        • Balkan & Baltics
        • Rest of E. Europe
      • By Material
      • By End-use
    • Market Attractiveness Analysis
      • By Country
      • By Material
      • By End-use
    • Key Takeaways
  13. East Asia Market Analysis 2020 to 2024 and Forecast 2025 to 2035, By Country
    • Historical Market Size Value (USD Billion) & Volume (K Units) Trend Analysis By Market Taxonomy, 2020 to 2024
    • Market Size Value (USD Billion) & Volume (K Units) Forecast By Market Taxonomy, 2025 to 2035
      • By Country
        • China
        • Japan
        • South Korea
      • By Material
      • By End-use
    • Market Attractiveness Analysis
      • By Country
      • By Material
      • By End-use
    • Key Takeaways
  14. South Asia & Pacific Market Analysis 2020 to 2024 and Forecast 2025 to 2035, By Country
    • Historical Market Size Value (USD Billion) & Volume (K Units) Trend Analysis By Market Taxonomy, 2020 to 2024
    • Market Size Value (USD Billion) & Volume (K Units) Forecast By Market Taxonomy, 2025 to 2035
      • By Country
        • India
        • Australia & New Zealand
        • ASEAN
        • Rest of SAP
      • By Material
      • By End-use
    • Market Attractiveness Analysis
      • By Country
      • By Material
      • By End-use
    • Key Takeaways
  15. Middle East and Africa Market Analysis 2020 to 2024 and Forecast 2025 to 2035, By Country
    • Historical Market Size Value (USD Billion) & Volume (K Units) Trend Analysis By Market Taxonomy, 2020 to 2024
    • Market Size Value (USD Billion) & Volume (K Units) Forecast By Market Taxonomy, 2025 to 2035
      • By Country
        • GCC Countries
        • Northern Africa
        • South Africa
        • Turkiye
        • Rest of MEA
      • By Material
      • By End-use
    • Market Attractiveness Analysis
      • By Country
      • By Material
      • By End-use
    • Key Takeaways
  16. Key Countries Market Analysis
    • USA
      • Pricing Analysis
      • Market Share Analysis, 2024
        • By Material
        • By End-use
    • Canada
      • Pricing Analysis
      • Market Share Analysis, 2024
        • By Material
        • By End-use
    • Brazil
      • Pricing Analysis
      • Market Share Analysis, 2024
        • By Material
        • By End-use
    • Mexico
      • Pricing Analysis
      • Market Share Analysis, 2024
        • By Material
        • By End-use
    • Argentina
      • Pricing Analysis
      • Market Share Analysis, 2024
        • By Material
        • By End-use
  17. Market Structure Analysis
    • Competition Dashboard
    • Competition Benchmarking
    • Market Share Analysis of Top Players
      • By Regional
      • By Material
      • By End-use
  18. Competition Analysis
    • Competition Deep Dive
      • Berry Global, Inc.
        • Overview
        • Product Portfolio
        • Profitability by Market Segments (Product/Age /Sales Channel/Region)
        • Sales Footprint
        • Strategy Overview
          • Marketing Strategy
          • Product Strategy
          • Channel Strategy
      • Hammer Packaging, Inc.
        • Overview
        • Product Portfolio
        • Profitability by Market Segments (Product/Age /Sales Channel/Region)
        • Sales Footprint
        • Strategy Overview
          • Marketing Strategy
          • Product Strategy
          • Channel Strategy
      • Paris Art Label Company Inc.
        • Overview
        • Product Portfolio
        • Profitability by Market Segments (Product/Age /Sales Channel/Region)
        • Sales Footprint
        • Strategy Overview
          • Marketing Strategy
          • Product Strategy
          • Channel Strategy
      • Avery Dennison Corporation
        • Overview
        • Product Portfolio
        • Profitability by Market Segments (Product/Age /Sales Channel/Region)
        • Sales Footprint
        • Strategy Overview
          • Marketing Strategy
          • Product Strategy
          • Channel Strategy
      • Constantia Flexibles
        • Overview
        • Product Portfolio
        • Profitability by Market Segments (Product/Age /Sales Channel/Region)
        • Sales Footprint
        • Strategy Overview
          • Marketing Strategy
          • Product Strategy
          • Channel Strategy
      • Klöckner Pentaplast
        • Overview
        • Product Portfolio
        • Profitability by Market Segments (Product/Age /Sales Channel/Region)
        • Sales Footprint
        • Strategy Overview
          • Marketing Strategy
          • Product Strategy
          • Channel Strategy
      • Macfarlane Group PLC
        • Overview
        • Product Portfolio
        • Profitability by Market Segments (Product/Age /Sales Channel/Region)
        • Sales Footprint
        • Strategy Overview
          • Marketing Strategy
          • Product Strategy
          • Channel Strategy
      • Fuji Seal International, Inc.
        • Overview
        • Product Portfolio
        • Profitability by Market Segments (Product/Age /Sales Channel/Region)
        • Sales Footprint
        • Strategy Overview
          • Marketing Strategy
          • Product Strategy
          • Channel Strategy
      • Bothra Industries
        • Overview
        • Product Portfolio
        • Profitability by Market Segments (Product/Age /Sales Channel/Region)
        • Sales Footprint
        • Strategy Overview
          • Marketing Strategy
          • Product Strategy
          • Channel Strategy
      • Taurus Packaging
        • Overview
        • Product Portfolio
        • Profitability by Market Segments (Product/Age /Sales Channel/Region)
        • Sales Footprint
        • Strategy Overview
          • Marketing Strategy
          • Product Strategy
          • Channel Strategy
  19. Assumptions & Acronyms Used
  20. Research Methodology

List of Tables

  • Table 1: Global Market Value (USD Billion) Forecast by Region, 2020-2035
  • Table 2: Global Market Volume (K Units) Forecast by Region, 2020-2035
  • Table 3: Global Market Value (USD Billion) Forecast by Material, 2020-2035
  • Table 4: Global Market Volume (K Units) Forecast by Material, 2020-2035
  • Table 5: Global Market Value (USD Billion) Forecast by End-use, 2020-2035
  • Table 6: Global Market Volume (K Units) Forecast by End-use, 2020-2035
  • Table 7: North America Market Value (USD Billion) Forecast by Country, 2020-2035
  • Table 8: North America Market Volume (K Units) Forecast by Country, 2020-2035
  • Table 9: North America Market Value (USD Billion) Forecast by Material, 2020-2035
  • Table 10: North America Market Volume (K Units) Forecast by Material, 2020-2035
  • Table 11: North America Market Value (USD Billion) Forecast by End-use, 2020-2035
  • Table 12: North America Market Volume (K Units) Forecast by End-use, 2020-2035
  • Table 13: Latin America Market Value (USD Billion) Forecast by Country, 2020-2035
  • Table 14: Latin America Market Volume (K Units) Forecast by Country, 2020-2035
  • Table 15: Latin America Market Value (USD Billion) Forecast by Material, 2020-2035
  • Table 16: Latin America Market Volume (K Units) Forecast by Material, 2020-2035
  • Table 17: Latin America Market Value (USD Billion) Forecast by End-use, 2020-2035
  • Table 18: Latin America Market Volume (K Units) Forecast by End-use, 2020-2035
  • Table 19: Western Europe Market Value (USD Billion) Forecast by Country, 2020-2035
  • Table 20: Western Europe Market Volume (K Units) Forecast by Country, 2020-2035
  • Table 21: Western Europe Market Value (USD Billion) Forecast by Material, 2020-2035
  • Table 22: Western Europe Market Volume (K Units) Forecast by Material, 2020-2035
  • Table 23: Western Europe Market Value (USD Billion) Forecast by End-use, 2020-2035
  • Table 24: Western Europe Market Volume (K Units) Forecast by End-use, 2020-2035
  • Table 25: Eastern Europe Market Value (USD Billion) Forecast by Country, 2020-2035
  • Table 26: Eastern Europe Market Volume (K Units) Forecast by Country, 2020-2035
  • Table 27: Eastern Europe Market Value (USD Billion) Forecast by Material, 2020-2035
  • Table 28: Eastern Europe Market Volume (K Units) Forecast by Material, 2020-2035
  • Table 29: Eastern Europe Market Value (USD Billion) Forecast by End-use, 2020-2035
  • Table 30: Eastern Europe Market Volume (K Units) Forecast by End-use, 2020-2035
  • Table 31: East Asia Market Value (USD Billion) Forecast by Country, 2020-2035
  • Table 32: East Asia Market Volume (K Units) Forecast by Country, 2020-2035
  • Table 33: East Asia Market Value (USD Billion) Forecast by Material, 2020-2035
  • Table 34: East Asia Market Volume (K Units) Forecast by Material, 2020-2035
  • Table 35: East Asia Market Value (USD Billion) Forecast by End-use, 2020-2035
  • Table 36: East Asia Market Volume (K Units) Forecast by End-use, 2020-2035
  • Table 37: South Asia & Pacific Market Value (USD Billion) Forecast by Country, 2020-2035
  • Table 38: South Asia & Pacific Market Volume (K Units) Forecast by Country, 2020-2035
  • Table 39: South Asia & Pacific Market Value (USD Billion) Forecast by Material, 2020-2035
  • Table 40: South Asia & Pacific Market Volume (K Units) Forecast by Material, 2020-2035
  • Table 41: South Asia & Pacific Market Value (USD Billion) Forecast by End-use, 2020-2035
  • Table 42: South Asia & Pacific Market Volume (K Units) Forecast by End-use, 2020-2035
  • Table 43: Middle East and Africa Market Value (USD Billion) Forecast by Country, 2020-2035
  • Table 44: Middle East and Africa Market Volume (K Units) Forecast by Country, 2020-2035
  • Table 45: Middle East and Africa Market Value (USD Billion) Forecast by Material, 2020-2035
  • Table 46: Middle East and Africa Market Volume (K Units) Forecast by Material, 2020-2035
  • Table 47: Middle East and Africa Market Value (USD Billion) Forecast by End-use, 2020-2035
  • Table 48: Middle East and Africa Market Volume (K Units) Forecast by End-use, 2020-2035

List of Figures

  • Figure 1: Global Market Volume (K Units) Forecast 2020-2035
  • Figure 2: Global Market Pricing Analysis
  • Figure 3: Global Market Value (USD Billion) Forecast 2020-2035
  • Figure 4: Global Market Value Share and BPS Analysis by Material, 2025 and 2035
  • Figure 5: Global Market Y-o-Y Growth Comparison by Material, 2025-2035
  • Figure 6: Global Market Attractiveness Analysis by Material
  • Figure 7: Global Market Value Share and BPS Analysis by End-use, 2025 and 2035
  • Figure 8: Global Market Y-o-Y Growth Comparison by End-use, 2025-2035
  • Figure 9: Global Market Attractiveness Analysis by End-use
  • Figure 10: Global Market Value (USD Billion) Share and BPS Analysis by Region, 2025 and 2035
  • Figure 11: Global Market Y-o-Y Growth Comparison by Region, 2025-2035
  • Figure 12: Global Market Attractiveness Analysis by Region
  • Figure 13: North America Market Incremental $ Opportunity, 2025-2035
  • Figure 14: Latin America Market Incremental $ Opportunity, 2025-2035
  • Figure 15: Western Europe Market Incremental $ Opportunity, 2025-2035
  • Figure 16: Eastern Europe Market Incremental $ Opportunity, 2025-2035
  • Figure 17: East Asia Market Incremental $ Opportunity, 2025-2035
  • Figure 18: South Asia & Pacific Market Incremental $ Opportunity, 2025-2035
  • Figure 19: Middle East and Africa Market Incremental $ Opportunity, 2025-2035
  • Figure 20: North America Market Value Share and BPS Analysis by Country, 2025 and 2035
  • Figure 21: North America Market Value Share and BPS Analysis by Material, 2025 and 2035
  • Figure 22: North America Market Y-o-Y Growth Comparison by Material, 2025-2035
  • Figure 23: North America Market Attractiveness Analysis by Material
  • Figure 24: North America Market Value Share and BPS Analysis by End-use, 2025 and 2035
  • Figure 25: North America Market Y-o-Y Growth Comparison by End-use, 2025-2035
  • Figure 26: North America Market Attractiveness Analysis by End-use
  • Figure 27: Latin America Market Value Share and BPS Analysis by Country, 2025 and 2035
  • Figure 28: Latin America Market Value Share and BPS Analysis by Material, 2025 and 2035
  • Figure 29: Latin America Market Y-o-Y Growth Comparison by Material, 2025-2035
  • Figure 30: Latin America Market Attractiveness Analysis by Material
  • Figure 31: Latin America Market Value Share and BPS Analysis by End-use, 2025 and 2035
  • Figure 32: Latin America Market Y-o-Y Growth Comparison by End-use, 2025-2035
  • Figure 33: Latin America Market Attractiveness Analysis by End-use
  • Figure 34: Western Europe Market Value Share and BPS Analysis by Country, 2025 and 2035
  • Figure 35: Western Europe Market Value Share and BPS Analysis by Material, 2025 and 2035
  • Figure 36: Western Europe Market Y-o-Y Growth Comparison by Material, 2025-2035
  • Figure 37: Western Europe Market Attractiveness Analysis by Material
  • Figure 38: Western Europe Market Value Share and BPS Analysis by End-use, 2025 and 2035
  • Figure 39: Western Europe Market Y-o-Y Growth Comparison by End-use, 2025-2035
  • Figure 40: Western Europe Market Attractiveness Analysis by End-use
  • Figure 41: Eastern Europe Market Value Share and BPS Analysis by Country, 2025 and 2035
  • Figure 42: Eastern Europe Market Value Share and BPS Analysis by Material, 2025 and 2035
  • Figure 43: Eastern Europe Market Y-o-Y Growth Comparison by Material, 2025-2035
  • Figure 44: Eastern Europe Market Attractiveness Analysis by Material
  • Figure 45: Eastern Europe Market Value Share and BPS Analysis by End-use, 2025 and 2035
  • Figure 46: Eastern Europe Market Y-o-Y Growth Comparison by End-use, 2025-2035
  • Figure 47: Eastern Europe Market Attractiveness Analysis by End-use
  • Figure 48: East Asia Market Value Share and BPS Analysis by Country, 2025 and 2035
  • Figure 49: East Asia Market Value Share and BPS Analysis by Material, 2025 and 2035
  • Figure 50: East Asia Market Y-o-Y Growth Comparison by Material, 2025-2035
  • Figure 51: East Asia Market Attractiveness Analysis by Material
  • Figure 52: East Asia Market Value Share and BPS Analysis by End-use, 2025 and 2035
  • Figure 53: East Asia Market Y-o-Y Growth Comparison by End-use, 2025-2035
  • Figure 54: East Asia Market Attractiveness Analysis by End-use
  • Figure 55: South Asia & Pacific Market Value Share and BPS Analysis by Country, 2025 and 2035
  • Figure 56: South Asia & Pacific Market Value Share and BPS Analysis by Material, 2025 and 2035
  • Figure 57: South Asia & Pacific Market Y-o-Y Growth Comparison by Material, 2025-2035
  • Figure 58: South Asia & Pacific Market Attractiveness Analysis by Material
  • Figure 59: South Asia & Pacific Market Value Share and BPS Analysis by End-use, 2025 and 2035
  • Figure 60: South Asia & Pacific Market Y-o-Y Growth Comparison by End-use, 2025-2035
  • Figure 61: South Asia & Pacific Market Attractiveness Analysis by End-use
  • Figure 62: Middle East and Africa Market Value Share and BPS Analysis by Country, 2025 and 2035
  • Figure 63: Middle East and Africa Market Value Share and BPS Analysis by Material, 2025 and 2035
  • Figure 64: Middle East and Africa Market Y-o-Y Growth Comparison by Material, 2025-2035
  • Figure 65: Middle East and Africa Market Attractiveness Analysis by Material
  • Figure 66: Middle East and Africa Market Value Share and BPS Analysis by End-use, 2025 and 2035
  • Figure 67: Middle East and Africa Market Y-o-Y Growth Comparison by End-use, 2025-2035
  • Figure 68: Middle East and Africa Market Attractiveness Analysis by End-use
  • Figure 69: Global Market - Tier Structure Analysis
  • Figure 70: Global Market - Company Share Analysis

Frequently Asked Questions

What is the projected size of the full container shrink sleeves market by 2035?

The industry is expected to reach USD 34.3 billion by 2035, up from USD 17.7 billion in 2025.

Which material dominates the full container shrink sleeves market in 2025?

Polyethylene (PE) holds the largest share in 2025, accounting for 39% of the total material usage.

Which end-use industry contributes most to full container shrink sleeves demand in 2025?

The food and beverage sector leads with a 46% market share, equivalent to approximately USD 8.19 billion in 2025.

Which region shows the highest growth rate in the full container shrink sleeves market from 2025 to 2035?

The European Union is projected to grow at a 7.0% compound annual growth rate, exceeding the global average.

Who is the leading player in the market in 2025?

Berry Global, Inc. leads the market with a 31% industry share.

Explore Similar Insights

Future Market Insights

Full Container Shrink Sleeves Market