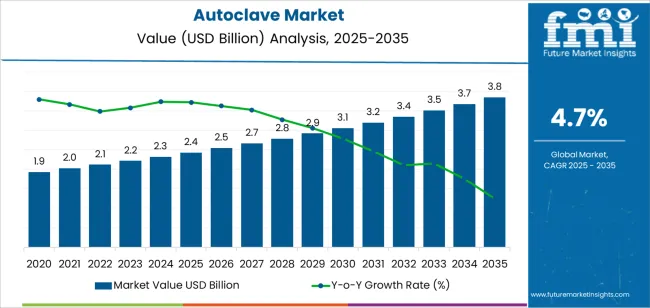
The autoclave market had an estimated market share worth USD 2.2 billion in 2023, and it is predicted to reach a global market valuation of USD 3.68 billion by 2034, advancing at a CAGR of 4.70% from 2024 to 2034.
Demand Analysis of Autoclaves
Report Attribute | Details |
---|---|
Estimated Market Value in 2023 | USD 2.2 billion |
Expected Market Value in 2024 | USD 2.32 billion |
Projected Forecast Value in 2034 | USD 3.68 billion |
Anticipated Growth Rate from 2024 to 2034 | 4.7% |
The global demand for the autoclave market was estimated to reach a valuation of USD 1,723.60 million in 2018, according to a report from Future Market Insights. From 2019 to 2023, the autoclave market witnessed significant growth, registering a CAGR of 5%.
Historical CAGR 2019 to 2023 | 5% |
---|---|
Forecast CAGR 2024 to 2034 | 4.70% |
The market for autoclave is expected to grow in the future due to these factors
Increasing Focus on Infection Prevention and Control to Push Market Growth
An increasing focus on infection prevention and control in healthcare settings is driving the autoclave market. Sterilization procedures are being given top priority in hospitals and clinics throughout the globe in order to reduce hazards and guarantee patient safety, since healthcare associated infections continue to be a major problem.
Given the increased emphasis on infection control, autoclaves are becoming more and more in demand as essential tools for sterilizing medical equipment and instruments, which is driving market expansion. The market for autoclaves is growing as a result of strict regulations controlling sterilization standards.
Healthcare establishments are required by regulatory authorities to purchase dependable autoclaves that either meet or surpass these criteria for sterilizing procedures, as these agencies are always updating their rules and regulations. Healthcare facilities are under regulatory pressure to purchase sophisticated autoclave systems, which is fueling market growth and continuous demand.
High Initials Costs and Technological Challenges to Restrict Market Growth
A number of obstacles, including the high initial investment costs involved in purchasing and maintaining autoclave equipment, may hinder market growth in the global autoclave market.
Healthcare institutions may also face obstacles from complicated regulatory compliance requirements and the demand for substantial training in order to operate autoclaves efficiently, which would restrict their use and impede market development. Technological constraints or improvements in substitute sterilizing techniques may potentially provide obstacles to the autoclave market's further expansion.
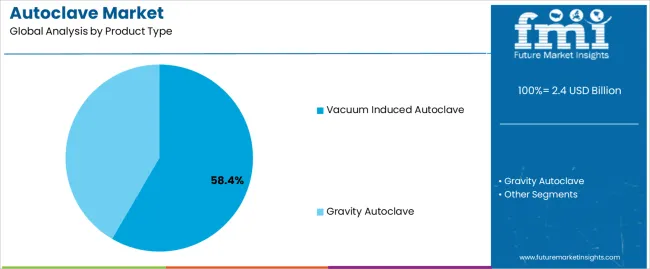
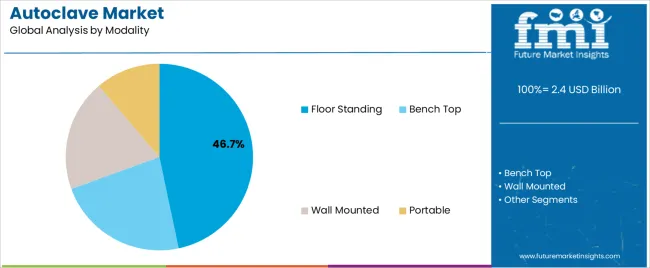
This section focuses on providing detailed analysis of two particular market segments for the autoclave, the dominant product and the significant modality. The two main segments discussed below are the gravity autoclave and floor standing modality.
Product Type | Gravity Autoclave |
---|---|
Market Share in 2024 | 53% |
In 2024, the gravity autoclave is likely to gain a market share of 53%. Gravity autoclaves are a reliable and affordable option that will likely see growth in this market. Gravity autoclaves are easier to build and operate than other types of autoclaves since they sterilize using air's inherent downward movement.
They are a desirable alternative for healthcare institutions, particularly in environments with limited resources, owing to their cheaper initial investment and ongoing maintenance costs, which encourages more adoption and fosters market expansion.
Modality | Floor Standing |
---|---|
Market Share in 2024 | 34.80% |
In 2024, the floor standing modality segment is anticipated to acquire 34.80% market share. The floor standing modality autoclave is expected to gain popularity owing to its adaptability and ability to handle heavier loads of medical equipment and apparatus.
These autoclaves are ideal for busy healthcare establishments with high sterilization demands since they have a large chamber volume. Their strong design and innovative features, such as programmable cycles and effective drying systems, improve workflow management and sterilizing efficiency. They therefore appeal to medical professionals looking for dependable and effective sterilizing solutions, which promotes market acceptance.
This section will go into detail on the autoclave markets in a few key countries, including the United States, the United Kingdom,China, Japan and South Korea. This part will focus on the key factors that are driving up demand in these countries for the autoclave.
Countries | CAGR from 2024 to 2034 |
---|---|
The United States | 2.90% |
The United Kingdom | 4.10% |
China | 2.90% |
Japan | 1.30% |
South Korea | 1.60% |
The United States autoclave ecosystem is anticipated to gain a CAGR of 2.90% through 2034. Factors that are bolstering the growth are:
The autoclave market in the United Kingdom is expected to expand with a 4.10% CAGR through 2034. The factors pushing the growth are:
The autoclave ecosystem in China is anticipated to develop with a 2.90% CAGR from 2024 to 2034. The drivers behind this growth are:
The autoclave industry in Japan is anticipated to reach a 1.30% CAGR from 2024 to 2034. The drivers propelling growth forward are:
The autoclave ecosystem in South Korea is likely to evolve with a 1.6% CAGR during the forecast period. The factors bolstering the growth are:
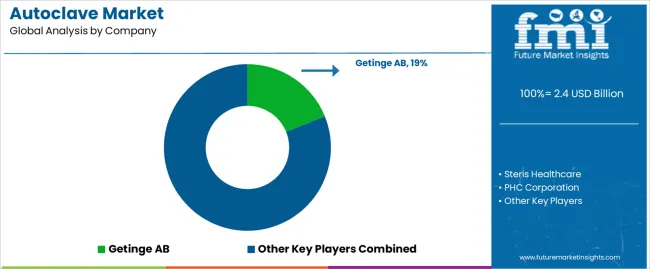
To stay competitive and take advantage of new chances, market players in the global autoclave market are concentrating on innovation, growth, and strategic partnerships. Companies spend money on research and development to bring in innovative technologies like automation, Internet of Things connectivity, and environmentally friendly sterilizing techniques.
Through joint ventures and acquisitions, they increase their geographic reach in order to get access to new markets and clientele. Strategic partnerships with regulatory agencies and healthcare providers support and strengthen efforts to create new products, which in turn propels market expansion.
The key players in this market include:
Significant advancements in the autoclave market are being made by key market participants, and their offerings include:
Report Attribute | Details |
---|---|
Growth Rate | CAGR of 4.7% from 2024 to 2034 |
Market value in 2024 | USD 2.32 billion |
Market value in 2034 | USD 3.68 billion |
Base Year for Estimation | 2023 |
Historical Data | 2018 to 2023 |
Forecast Period | 2024 to 2034 |
Quantitative Units | USD billion for value |
Report Coverage | Revenue Forecast, Company Ranking, Competitive Landscape, Growth Factors, Trends, and Pricing Analysis |
Segments Covered | Product Type, Modality, Loading Type, Chamber Type, End User, Region |
Regions Covered | North America; Latin America; Western Europe; Eastern Europe; South Asia and Pacific; East Asia; The Middle East & Africa |
Countries Profiled | The United States, Canada, Brazil, Mexico, Germany, The United Kingdom, France, Spain, Italy, Poland, Russia, Czech Republic, Romania, India, Bangladesh, Australia, New Zealand, China, Japan, South Korea, GCC Countries, South Africa, Israel |
Key Companies Profiled | Steris healthcare; Getinge AB; PHC Corporation; Shinva Medical Instruments Co. Ltd.; MELAG Medizintechnik GmbH & Co. KG; Astell Scientific; Consolidated Sterilizer Systems; Tuttnauer; Labtron Equipment; BMT Medical Technology S.R.O.; LTE Scientific |
Customization Scope | Available on Request |
Table 1: Global Market Value (US$ Billion) Forecast by Region, 2019 to 2034
Table 2: Global Market Volume (Units) Forecast by Region, 2019 to 2034
Table 3: Global Market Value (US$ Billion) Forecast by Product Type, 2019 to 2034
Table 4: Global Market Volume (Units) Forecast by Product Type, 2019 to 2034
Table 5: Global Market Value (US$ Billion) Forecast by Modality, 2019 to 2034
Table 6: Global Market Volume (Units) Forecast by Modality, 2019 to 2034
Table 7: Global Market Value (US$ Billion) Forecast by Loading Type, 2019 to 2034
Table 8: Global Market Volume (Units) Forecast by Loading Type, 2019 to 2034
Table 9: Global Market Value (US$ Billion) Forecast by Chamber Type, 2019 to 2034
Table 10: Global Market Volume (Units) Forecast by Chamber Type, 2019 to 2034
Table 11: Global Market Value (US$ Billion) Forecast by End-User, 2019 to 2034
Table 12: Global Market Volume (Units) Forecast by End-User, 2019 to 2034
Table 13: North America Market Value (US$ Billion) Forecast by Country, 2019 to 2034
Table 14: North America Market Volume (Units) Forecast by Country, 2019 to 2034
Table 15: North America Market Value (US$ Billion) Forecast by Product Type, 2019 to 2034
Table 16: North America Market Volume (Units) Forecast by Product Type, 2019 to 2034
Table 17: North America Market Value (US$ Billion) Forecast by Modality, 2019 to 2034
Table 18: North America Market Volume (Units) Forecast by Modality, 2019 to 2034
Table 19: North America Market Value (US$ Billion) Forecast by Loading Type, 2019 to 2034
Table 20: North America Market Volume (Units) Forecast by Loading Type, 2019 to 2034
Table 21: North America Market Value (US$ Billion) Forecast by Chamber Type, 2019 to 2034
Table 22: North America Market Volume (Units) Forecast by Chamber Type, 2019 to 2034
Table 23: North America Market Value (US$ Billion) Forecast by End-User, 2019 to 2034
Table 24: North America Market Volume (Units) Forecast by End-User, 2019 to 2034
Table 25: Latin America Market Value (US$ Billion) Forecast by Country, 2019 to 2034
Table 26: Latin America Market Volume (Units) Forecast by Country, 2019 to 2034
Table 27: Latin America Market Value (US$ Billion) Forecast by Product Type, 2019 to 2034
Table 28: Latin America Market Volume (Units) Forecast by Product Type, 2019 to 2034
Table 29: Latin America Market Value (US$ Billion) Forecast by Modality, 2019 to 2034
Table 30: Latin America Market Volume (Units) Forecast by Modality, 2019 to 2034
Table 31: Latin America Market Value (US$ Billion) Forecast by Loading Type, 2019 to 2034
Table 32: Latin America Market Volume (Units) Forecast by Loading Type, 2019 to 2034
Table 33: Latin America Market Value (US$ Billion) Forecast by Chamber Type, 2019 to 2034
Table 34: Latin America Market Volume (Units) Forecast by Chamber Type, 2019 to 2034
Table 35: Latin America Market Value (US$ Billion) Forecast by End-User, 2019 to 2034
Table 36: Latin America Market Volume (Units) Forecast by End-User, 2019 to 2034
Table 37: Western Europe Market Value (US$ Billion) Forecast by Country, 2019 to 2034
Table 38: Western Europe Market Volume (Units) Forecast by Country, 2019 to 2034
Table 39: Western Europe Market Value (US$ Billion) Forecast by Product Type, 2019 to 2034
Table 40: Western Europe Market Volume (Units) Forecast by Product Type, 2019 to 2034
Table 41: Western Europe Market Value (US$ Billion) Forecast by Modality, 2019 to 2034
Table 42: Western Europe Market Volume (Units) Forecast by Modality, 2019 to 2034
Table 43: Western Europe Market Value (US$ Billion) Forecast by Loading Type, 2019 to 2034
Table 44: Western Europe Market Volume (Units) Forecast by Loading Type, 2019 to 2034
Table 45: Western Europe Market Value (US$ Billion) Forecast by Chamber Type, 2019 to 2034
Table 46: Western Europe Market Volume (Units) Forecast by Chamber Type, 2019 to 2034
Table 47: Western Europe Market Value (US$ Billion) Forecast by End-User, 2019 to 2034
Table 48: Western Europe Market Volume (Units) Forecast by End-User, 2019 to 2034
Table 49: Eastern Europe Market Value (US$ Billion) Forecast by Country, 2019 to 2034
Table 50: Eastern Europe Market Volume (Units) Forecast by Country, 2019 to 2034
Table 51: Eastern Europe Market Value (US$ Billion) Forecast by Product Type, 2019 to 2034
Table 52: Eastern Europe Market Volume (Units) Forecast by Product Type, 2019 to 2034
Table 53: Eastern Europe Market Value (US$ Billion) Forecast by Modality, 2019 to 2034
Table 54: Eastern Europe Market Volume (Units) Forecast by Modality, 2019 to 2034
Table 55: Eastern Europe Market Value (US$ Billion) Forecast by Loading Type, 2019 to 2034
Table 56: Eastern Europe Market Volume (Units) Forecast by Loading Type, 2019 to 2034
Table 57: Eastern Europe Market Value (US$ Billion) Forecast by Chamber Type, 2019 to 2034
Table 58: Eastern Europe Market Volume (Units) Forecast by Chamber Type, 2019 to 2034
Table 59: Eastern Europe Market Value (US$ Billion) Forecast by End-User, 2019 to 2034
Table 60: Eastern Europe Market Volume (Units) Forecast by End-User, 2019 to 2034
Table 61: South Asia and Pacific Market Value (US$ Billion) Forecast by Country, 2019 to 2034
Table 62: South Asia and Pacific Market Volume (Units) Forecast by Country, 2019 to 2034
Table 63: South Asia and Pacific Market Value (US$ Billion) Forecast by Product Type, 2019 to 2034
Table 64: South Asia and Pacific Market Volume (Units) Forecast by Product Type, 2019 to 2034
Table 65: South Asia and Pacific Market Value (US$ Billion) Forecast by Modality, 2019 to 2034
Table 66: South Asia and Pacific Market Volume (Units) Forecast by Modality, 2019 to 2034
Table 67: South Asia and Pacific Market Value (US$ Billion) Forecast by Loading Type, 2019 to 2034
Table 68: South Asia and Pacific Market Volume (Units) Forecast by Loading Type, 2019 to 2034
Table 69: South Asia and Pacific Market Value (US$ Billion) Forecast by Chamber Type, 2019 to 2034
Table 70: South Asia and Pacific Market Volume (Units) Forecast by Chamber Type, 2019 to 2034
Table 71: South Asia and Pacific Market Value (US$ Billion) Forecast by End-User, 2019 to 2034
Table 72: South Asia and Pacific Market Volume (Units) Forecast by End-User, 2019 to 2034
Table 73: East Asia Market Value (US$ Billion) Forecast by Country, 2019 to 2034
Table 74: East Asia Market Volume (Units) Forecast by Country, 2019 to 2034
Table 75: East Asia Market Value (US$ Billion) Forecast by Product Type, 2019 to 2034
Table 76: East Asia Market Volume (Units) Forecast by Product Type, 2019 to 2034
Table 77: East Asia Market Value (US$ Billion) Forecast by Modality, 2019 to 2034
Table 78: East Asia Market Volume (Units) Forecast by Modality, 2019 to 2034
Table 79: East Asia Market Value (US$ Billion) Forecast by Loading Type, 2019 to 2034
Table 80: East Asia Market Volume (Units) Forecast by Loading Type, 2019 to 2034
Table 81: East Asia Market Value (US$ Billion) Forecast by Chamber Type, 2019 to 2034
Table 82: East Asia Market Volume (Units) Forecast by Chamber Type, 2019 to 2034
Table 83: East Asia Market Value (US$ Billion) Forecast by End-User, 2019 to 2034
Table 84: East Asia Market Volume (Units) Forecast by End-User, 2019 to 2034
Table 85: Middle East and Africa Market Value (US$ Billion) Forecast by Country, 2019 to 2034
Table 86: Middle East and Africa Market Volume (Units) Forecast by Country, 2019 to 2034
Table 87: Middle East and Africa Market Value (US$ Billion) Forecast by Product Type, 2019 to 2034
Table 88: Middle East and Africa Market Volume (Units) Forecast by Product Type, 2019 to 2034
Table 89: Middle East and Africa Market Value (US$ Billion) Forecast by Modality, 2019 to 2034
Table 90: Middle East and Africa Market Volume (Units) Forecast by Modality, 2019 to 2034
Table 91: Middle East and Africa Market Value (US$ Billion) Forecast by Loading Type, 2019 to 2034
Table 92: Middle East and Africa Market Volume (Units) Forecast by Loading Type, 2019 to 2034
Table 93: Middle East and Africa Market Value (US$ Billion) Forecast by Chamber Type, 2019 to 2034
Table 94: Middle East and Africa Market Volume (Units) Forecast by Chamber Type, 2019 to 2034
Table 95: Middle East and Africa Market Value (US$ Billion) Forecast by End-User, 2019 to 2034
Table 96: Middle East and Africa Market Volume (Units) Forecast by End-User, 2019 to 2034
Figure 1: Global Market Value (US$ Billion) by Product Type, 2024 to 2034
Figure 2: Global Market Value (US$ Billion) by Modality, 2024 to 2034
Figure 3: Global Market Value (US$ Billion) by Loading Type, 2024 to 2034
Figure 4: Global Market Value (US$ Billion) by Chamber Type, 2024 to 2034
Figure 5: Global Market Value (US$ Billion) by End-User, 2024 to 2034
Figure 6: Global Market Value (US$ Billion) by Region, 2024 to 2034
Figure 7: Global Market Value (US$ Billion) Analysis by Region, 2019 to 2034
Figure 8: Global Market Volume (Units) Analysis by Region, 2019 to 2034
Figure 9: Global Market Value Share (%) and BPS Analysis by Region, 2024 to 2034
Figure 10: Global Market Y-o-Y Growth (%) Projections by Region, 2024 to 2034
Figure 11: Global Market Value (US$ Billion) Analysis by Product Type, 2019 to 2034
Figure 12: Global Market Volume (Units) Analysis by Product Type, 2019 to 2034
Figure 13: Global Market Value Share (%) and BPS Analysis by Product Type, 2024 to 2034
Figure 14: Global Market Y-o-Y Growth (%) Projections by Product Type, 2024 to 2034
Figure 15: Global Market Value (US$ Billion) Analysis by Modality, 2019 to 2034
Figure 16: Global Market Volume (Units) Analysis by Modality, 2019 to 2034
Figure 17: Global Market Value Share (%) and BPS Analysis by Modality, 2024 to 2034
Figure 18: Global Market Y-o-Y Growth (%) Projections by Modality, 2024 to 2034
Figure 19: Global Market Value (US$ Billion) Analysis by Loading Type, 2019 to 2034
Figure 20: Global Market Volume (Units) Analysis by Loading Type, 2019 to 2034
Figure 21: Global Market Value Share (%) and BPS Analysis by Loading Type, 2024 to 2034
Figure 22: Global Market Y-o-Y Growth (%) Projections by Loading Type, 2024 to 2034
Figure 23: Global Market Value (US$ Billion) Analysis by Chamber Type, 2019 to 2034
Figure 24: Global Market Volume (Units) Analysis by Chamber Type, 2019 to 2034
Figure 25: Global Market Value Share (%) and BPS Analysis by Chamber Type, 2024 to 2034
Figure 26: Global Market Y-o-Y Growth (%) Projections by Chamber Type, 2024 to 2034
Figure 27: Global Market Value (US$ Billion) Analysis by End-User, 2019 to 2034
Figure 28: Global Market Volume (Units) Analysis by End-User, 2019 to 2034
Figure 29: Global Market Value Share (%) and BPS Analysis by End-User, 2024 to 2034
Figure 30: Global Market Y-o-Y Growth (%) Projections by End-User, 2024 to 2034
Figure 31: Global Market Attractiveness by Product Type, 2024 to 2034
Figure 32: Global Market Attractiveness by Modality, 2024 to 2034
Figure 33: Global Market Attractiveness by Loading Type, 2024 to 2034
Figure 34: Global Market Attractiveness by Chamber Type, 2024 to 2034
Figure 35: Global Market Attractiveness by End-User, 2024 to 2034
Figure 36: Global Market Attractiveness by Region, 2024 to 2034
Figure 37: North America Market Value (US$ Billion) by Product Type, 2024 to 2034
Figure 38: North America Market Value (US$ Billion) by Modality, 2024 to 2034
Figure 39: North America Market Value (US$ Billion) by Loading Type, 2024 to 2034
Figure 40: North America Market Value (US$ Billion) by Chamber Type, 2024 to 2034
Figure 41: North America Market Value (US$ Billion) by End-User, 2024 to 2034
Figure 42: North America Market Value (US$ Billion) by Country, 2024 to 2034
Figure 43: North America Market Value (US$ Billion) Analysis by Country, 2019 to 2034
Figure 44: North America Market Volume (Units) Analysis by Country, 2019 to 2034
Figure 45: North America Market Value Share (%) and BPS Analysis by Country, 2024 to 2034
Figure 46: North America Market Y-o-Y Growth (%) Projections by Country, 2024 to 2034
Figure 47: North America Market Value (US$ Billion) Analysis by Product Type, 2019 to 2034
Figure 48: North America Market Volume (Units) Analysis by Product Type, 2019 to 2034
Figure 49: North America Market Value Share (%) and BPS Analysis by Product Type, 2024 to 2034
Figure 50: North America Market Y-o-Y Growth (%) Projections by Product Type, 2024 to 2034
Figure 51: North America Market Value (US$ Billion) Analysis by Modality, 2019 to 2034
Figure 52: North America Market Volume (Units) Analysis by Modality, 2019 to 2034
Figure 53: North America Market Value Share (%) and BPS Analysis by Modality, 2024 to 2034
Figure 54: North America Market Y-o-Y Growth (%) Projections by Modality, 2024 to 2034
Figure 55: North America Market Value (US$ Billion) Analysis by Loading Type, 2019 to 2034
Figure 56: North America Market Volume (Units) Analysis by Loading Type, 2019 to 2034
Figure 57: North America Market Value Share (%) and BPS Analysis by Loading Type, 2024 to 2034
Figure 58: North America Market Y-o-Y Growth (%) Projections by Loading Type, 2024 to 2034
Figure 59: North America Market Value (US$ Billion) Analysis by Chamber Type, 2019 to 2034
Figure 60: North America Market Volume (Units) Analysis by Chamber Type, 2019 to 2034
Figure 61: North America Market Value Share (%) and BPS Analysis by Chamber Type, 2024 to 2034
Figure 62: North America Market Y-o-Y Growth (%) Projections by Chamber Type, 2024 to 2034
Figure 63: North America Market Value (US$ Billion) Analysis by End-User, 2019 to 2034
Figure 64: North America Market Volume (Units) Analysis by End-User, 2019 to 2034
Figure 65: North America Market Value Share (%) and BPS Analysis by End-User, 2024 to 2034
Figure 66: North America Market Y-o-Y Growth (%) Projections by End-User, 2024 to 2034
Figure 67: North America Market Attractiveness by Product Type, 2024 to 2034
Figure 68: North America Market Attractiveness by Modality, 2024 to 2034
Figure 69: North America Market Attractiveness by Loading Type, 2024 to 2034
Figure 70: North America Market Attractiveness by Chamber Type, 2024 to 2034
Figure 71: North America Market Attractiveness by End-User, 2024 to 2034
Figure 72: North America Market Attractiveness by Country, 2024 to 2034
Figure 73: Latin America Market Value (US$ Billion) by Product Type, 2024 to 2034
Figure 74: Latin America Market Value (US$ Billion) by Modality, 2024 to 2034
Figure 75: Latin America Market Value (US$ Billion) by Loading Type, 2024 to 2034
Figure 76: Latin America Market Value (US$ Billion) by Chamber Type, 2024 to 2034
Figure 77: Latin America Market Value (US$ Billion) by End-User, 2024 to 2034
Figure 78: Latin America Market Value (US$ Billion) by Country, 2024 to 2034
Figure 79: Latin America Market Value (US$ Billion) Analysis by Country, 2019 to 2034
Figure 80: Latin America Market Volume (Units) Analysis by Country, 2019 to 2034
Figure 81: Latin America Market Value Share (%) and BPS Analysis by Country, 2024 to 2034
Figure 82: Latin America Market Y-o-Y Growth (%) Projections by Country, 2024 to 2034
Figure 83: Latin America Market Value (US$ Billion) Analysis by Product Type, 2019 to 2034
Figure 84: Latin America Market Volume (Units) Analysis by Product Type, 2019 to 2034
Figure 85: Latin America Market Value Share (%) and BPS Analysis by Product Type, 2024 to 2034
Figure 86: Latin America Market Y-o-Y Growth (%) Projections by Product Type, 2024 to 2034
Figure 87: Latin America Market Value (US$ Billion) Analysis by Modality, 2019 to 2034
Figure 88: Latin America Market Volume (Units) Analysis by Modality, 2019 to 2034
Figure 89: Latin America Market Value Share (%) and BPS Analysis by Modality, 2024 to 2034
Figure 90: Latin America Market Y-o-Y Growth (%) Projections by Modality, 2024 to 2034
Figure 91: Latin America Market Value (US$ Billion) Analysis by Loading Type, 2019 to 2034
Figure 92: Latin America Market Volume (Units) Analysis by Loading Type, 2019 to 2034
Figure 93: Latin America Market Value Share (%) and BPS Analysis by Loading Type, 2024 to 2034
Figure 94: Latin America Market Y-o-Y Growth (%) Projections by Loading Type, 2024 to 2034
Figure 95: Latin America Market Value (US$ Billion) Analysis by Chamber Type, 2019 to 2034
Figure 96: Latin America Market Volume (Units) Analysis by Chamber Type, 2019 to 2034
Figure 97: Latin America Market Value Share (%) and BPS Analysis by Chamber Type, 2024 to 2034
Figure 98: Latin America Market Y-o-Y Growth (%) Projections by Chamber Type, 2024 to 2034
Figure 99: Latin America Market Value (US$ Billion) Analysis by End-User, 2019 to 2034
Figure 100: Latin America Market Volume (Units) Analysis by End-User, 2019 to 2034
Figure 101: Latin America Market Value Share (%) and BPS Analysis by End-User, 2024 to 2034
Figure 102: Latin America Market Y-o-Y Growth (%) Projections by End-User, 2024 to 2034
Figure 103: Latin America Market Attractiveness by Product Type, 2024 to 2034
Figure 104: Latin America Market Attractiveness by Modality, 2024 to 2034
Figure 105: Latin America Market Attractiveness by Loading Type, 2024 to 2034
Figure 106: Latin America Market Attractiveness by Chamber Type, 2024 to 2034
Figure 107: Latin America Market Attractiveness by End-User, 2024 to 2034
Figure 108: Latin America Market Attractiveness by Country, 2024 to 2034
Figure 109: Western Europe Market Value (US$ Billion) by Product Type, 2024 to 2034
Figure 110: Western Europe Market Value (US$ Billion) by Modality, 2024 to 2034
Figure 111: Western Europe Market Value (US$ Billion) by Loading Type, 2024 to 2034
Figure 112: Western Europe Market Value (US$ Billion) by Chamber Type, 2024 to 2034
Figure 113: Western Europe Market Value (US$ Billion) by End-User, 2024 to 2034
Figure 114: Western Europe Market Value (US$ Billion) by Country, 2024 to 2034
Figure 115: Western Europe Market Value (US$ Billion) Analysis by Country, 2019 to 2034
Figure 116: Western Europe Market Volume (Units) Analysis by Country, 2019 to 2034
Figure 117: Western Europe Market Value Share (%) and BPS Analysis by Country, 2024 to 2034
Figure 118: Western Europe Market Y-o-Y Growth (%) Projections by Country, 2024 to 2034
Figure 119: Western Europe Market Value (US$ Billion) Analysis by Product Type, 2019 to 2034
Figure 120: Western Europe Market Volume (Units) Analysis by Product Type, 2019 to 2034
Figure 121: Western Europe Market Value Share (%) and BPS Analysis by Product Type, 2024 to 2034
Figure 122: Western Europe Market Y-o-Y Growth (%) Projections by Product Type, 2024 to 2034
Figure 123: Western Europe Market Value (US$ Billion) Analysis by Modality, 2019 to 2034
Figure 124: Western Europe Market Volume (Units) Analysis by Modality, 2019 to 2034
Figure 125: Western Europe Market Value Share (%) and BPS Analysis by Modality, 2024 to 2034
Figure 126: Western Europe Market Y-o-Y Growth (%) Projections by Modality, 2024 to 2034
Figure 127: Western Europe Market Value (US$ Billion) Analysis by Loading Type, 2019 to 2034
Figure 128: Western Europe Market Volume (Units) Analysis by Loading Type, 2019 to 2034
Figure 129: Western Europe Market Value Share (%) and BPS Analysis by Loading Type, 2024 to 2034
Figure 130: Western Europe Market Y-o-Y Growth (%) Projections by Loading Type, 2024 to 2034
Figure 131: Western Europe Market Value (US$ Billion) Analysis by Chamber Type, 2019 to 2034
Figure 132: Western Europe Market Volume (Units) Analysis by Chamber Type, 2019 to 2034
Figure 133: Western Europe Market Value Share (%) and BPS Analysis by Chamber Type, 2024 to 2034
Figure 134: Western Europe Market Y-o-Y Growth (%) Projections by Chamber Type, 2024 to 2034
Figure 135: Western Europe Market Value (US$ Billion) Analysis by End-User, 2019 to 2034
Figure 136: Western Europe Market Volume (Units) Analysis by End-User, 2019 to 2034
Figure 137: Western Europe Market Value Share (%) and BPS Analysis by End-User, 2024 to 2034
Figure 138: Western Europe Market Y-o-Y Growth (%) Projections by End-User, 2024 to 2034
Figure 139: Western Europe Market Attractiveness by Product Type, 2024 to 2034
Figure 140: Western Europe Market Attractiveness by Modality, 2024 to 2034
Figure 141: Western Europe Market Attractiveness by Loading Type, 2024 to 2034
Figure 142: Western Europe Market Attractiveness by Chamber Type, 2024 to 2034
Figure 143: Western Europe Market Attractiveness by End-User, 2024 to 2034
Figure 144: Western Europe Market Attractiveness by Country, 2024 to 2034
Figure 145: Eastern Europe Market Value (US$ Billion) by Product Type, 2024 to 2034
Figure 146: Eastern Europe Market Value (US$ Billion) by Modality, 2024 to 2034
Figure 147: Eastern Europe Market Value (US$ Billion) by Loading Type, 2024 to 2034
Figure 148: Eastern Europe Market Value (US$ Billion) by Chamber Type, 2024 to 2034
Figure 149: Eastern Europe Market Value (US$ Billion) by End-User, 2024 to 2034
Figure 150: Eastern Europe Market Value (US$ Billion) by Country, 2024 to 2034
Figure 151: Eastern Europe Market Value (US$ Billion) Analysis by Country, 2019 to 2034
Figure 152: Eastern Europe Market Volume (Units) Analysis by Country, 2019 to 2034
Figure 153: Eastern Europe Market Value Share (%) and BPS Analysis by Country, 2024 to 2034
Figure 154: Eastern Europe Market Y-o-Y Growth (%) Projections by Country, 2024 to 2034
Figure 155: Eastern Europe Market Value (US$ Billion) Analysis by Product Type, 2019 to 2034
Figure 156: Eastern Europe Market Volume (Units) Analysis by Product Type, 2019 to 2034
Figure 157: Eastern Europe Market Value Share (%) and BPS Analysis by Product Type, 2024 to 2034
Figure 158: Eastern Europe Market Y-o-Y Growth (%) Projections by Product Type, 2024 to 2034
Figure 159: Eastern Europe Market Value (US$ Billion) Analysis by Modality, 2019 to 2034
Figure 160: Eastern Europe Market Volume (Units) Analysis by Modality, 2019 to 2034
Figure 161: Eastern Europe Market Value Share (%) and BPS Analysis by Modality, 2024 to 2034
Figure 162: Eastern Europe Market Y-o-Y Growth (%) Projections by Modality, 2024 to 2034
Figure 163: Eastern Europe Market Value (US$ Billion) Analysis by Loading Type, 2019 to 2034
Figure 164: Eastern Europe Market Volume (Units) Analysis by Loading Type, 2019 to 2034
Figure 165: Eastern Europe Market Value Share (%) and BPS Analysis by Loading Type, 2024 to 2034
Figure 166: Eastern Europe Market Y-o-Y Growth (%) Projections by Loading Type, 2024 to 2034
Figure 167: Eastern Europe Market Value (US$ Billion) Analysis by Chamber Type, 2019 to 2034
Figure 168: Eastern Europe Market Volume (Units) Analysis by Chamber Type, 2019 to 2034
Figure 169: Eastern Europe Market Value Share (%) and BPS Analysis by Chamber Type, 2024 to 2034
Figure 170: Eastern Europe Market Y-o-Y Growth (%) Projections by Chamber Type, 2024 to 2034
Figure 171: Eastern Europe Market Value (US$ Billion) Analysis by End-User, 2019 to 2034
Figure 172: Eastern Europe Market Volume (Units) Analysis by End-User, 2019 to 2034
Figure 173: Eastern Europe Market Value Share (%) and BPS Analysis by End-User, 2024 to 2034
Figure 174: Eastern Europe Market Y-o-Y Growth (%) Projections by End-User, 2024 to 2034
Figure 175: Eastern Europe Market Attractiveness by Product Type, 2024 to 2034
Figure 176: Eastern Europe Market Attractiveness by Modality, 2024 to 2034
Figure 177: Eastern Europe Market Attractiveness by Loading Type, 2024 to 2034
Figure 178: Eastern Europe Market Attractiveness by Chamber Type, 2024 to 2034
Figure 179: Eastern Europe Market Attractiveness by End-User, 2024 to 2034
Figure 180: Eastern Europe Market Attractiveness by Country, 2024 to 2034
Figure 181: South Asia and Pacific Market Value (US$ Billion) by Product Type, 2024 to 2034
Figure 182: South Asia and Pacific Market Value (US$ Billion) by Modality, 2024 to 2034
Figure 183: South Asia and Pacific Market Value (US$ Billion) by Loading Type, 2024 to 2034
Figure 184: South Asia and Pacific Market Value (US$ Billion) by Chamber Type, 2024 to 2034
Figure 185: South Asia and Pacific Market Value (US$ Billion) by End-User, 2024 to 2034
Figure 186: South Asia and Pacific Market Value (US$ Billion) by Country, 2024 to 2034
Figure 187: South Asia and Pacific Market Value (US$ Billion) Analysis by Country, 2019 to 2034
Figure 188: South Asia and Pacific Market Volume (Units) Analysis by Country, 2019 to 2034
Figure 189: South Asia and Pacific Market Value Share (%) and BPS Analysis by Country, 2024 to 2034
Figure 190: South Asia and Pacific Market Y-o-Y Growth (%) Projections by Country, 2024 to 2034
Figure 191: South Asia and Pacific Market Value (US$ Billion) Analysis by Product Type, 2019 to 2034
Figure 192: South Asia and Pacific Market Volume (Units) Analysis by Product Type, 2019 to 2034
Figure 193: South Asia and Pacific Market Value Share (%) and BPS Analysis by Product Type, 2024 to 2034
Figure 194: South Asia and Pacific Market Y-o-Y Growth (%) Projections by Product Type, 2024 to 2034
Figure 195: South Asia and Pacific Market Value (US$ Billion) Analysis by Modality, 2019 to 2034
Figure 196: South Asia and Pacific Market Volume (Units) Analysis by Modality, 2019 to 2034
Figure 197: South Asia and Pacific Market Value Share (%) and BPS Analysis by Modality, 2024 to 2034
Figure 198: South Asia and Pacific Market Y-o-Y Growth (%) Projections by Modality, 2024 to 2034
Figure 199: South Asia and Pacific Market Value (US$ Billion) Analysis by Loading Type, 2019 to 2034
Figure 200: South Asia and Pacific Market Volume (Units) Analysis by Loading Type, 2019 to 2034
Figure 201: South Asia and Pacific Market Value Share (%) and BPS Analysis by Loading Type, 2024 to 2034
Figure 202: South Asia and Pacific Market Y-o-Y Growth (%) Projections by Loading Type, 2024 to 2034
Figure 203: South Asia and Pacific Market Value (US$ Billion) Analysis by Chamber Type, 2019 to 2034
Figure 204: South Asia and Pacific Market Volume (Units) Analysis by Chamber Type, 2019 to 2034
Figure 205: South Asia and Pacific Market Value Share (%) and BPS Analysis by Chamber Type, 2024 to 2034
Figure 206: South Asia and Pacific Market Y-o-Y Growth (%) Projections by Chamber Type, 2024 to 2034
Figure 207: South Asia and Pacific Market Value (US$ Billion) Analysis by End-User, 2019 to 2034
Figure 208: South Asia and Pacific Market Volume (Units) Analysis by End-User, 2019 to 2034
Figure 209: South Asia and Pacific Market Value Share (%) and BPS Analysis by End-User, 2024 to 2034
Figure 210: South Asia and Pacific Market Y-o-Y Growth (%) Projections by End-User, 2024 to 2034
Figure 211: South Asia and Pacific Market Attractiveness by Product Type, 2024 to 2034
Figure 212: South Asia and Pacific Market Attractiveness by Modality, 2024 to 2034
Figure 213: South Asia and Pacific Market Attractiveness by Loading Type, 2024 to 2034
Figure 214: South Asia and Pacific Market Attractiveness by Chamber Type, 2024 to 2034
Figure 215: South Asia and Pacific Market Attractiveness by End-User, 2024 to 2034
Figure 216: South Asia and Pacific Market Attractiveness by Country, 2024 to 2034
Figure 217: East Asia Market Value (US$ Billion) by Product Type, 2024 to 2034
Figure 218: East Asia Market Value (US$ Billion) by Modality, 2024 to 2034
Figure 219: East Asia Market Value (US$ Billion) by Loading Type, 2024 to 2034
Figure 220: East Asia Market Value (US$ Billion) by Chamber Type, 2024 to 2034
Figure 221: East Asia Market Value (US$ Billion) by End-User, 2024 to 2034
Figure 222: East Asia Market Value (US$ Billion) by Country, 2024 to 2034
Figure 223: East Asia Market Value (US$ Billion) Analysis by Country, 2019 to 2034
Figure 224: East Asia Market Volume (Units) Analysis by Country, 2019 to 2034
Figure 225: East Asia Market Value Share (%) and BPS Analysis by Country, 2024 to 2034
Figure 226: East Asia Market Y-o-Y Growth (%) Projections by Country, 2024 to 2034
Figure 227: East Asia Market Value (US$ Billion) Analysis by Product Type, 2019 to 2034
Figure 228: East Asia Market Volume (Units) Analysis by Product Type, 2019 to 2034
Figure 229: East Asia Market Value Share (%) and BPS Analysis by Product Type, 2024 to 2034
Figure 230: East Asia Market Y-o-Y Growth (%) Projections by Product Type, 2024 to 2034
Figure 231: East Asia Market Value (US$ Billion) Analysis by Modality, 2019 to 2034
Figure 232: East Asia Market Volume (Units) Analysis by Modality, 2019 to 2034
Figure 233: East Asia Market Value Share (%) and BPS Analysis by Modality, 2024 to 2034
Figure 234: East Asia Market Y-o-Y Growth (%) Projections by Modality, 2024 to 2034
Figure 235: East Asia Market Value (US$ Billion) Analysis by Loading Type, 2019 to 2034
Figure 236: East Asia Market Volume (Units) Analysis by Loading Type, 2019 to 2034
Figure 237: East Asia Market Value Share (%) and BPS Analysis by Loading Type, 2024 to 2034
Figure 238: East Asia Market Y-o-Y Growth (%) Projections by Loading Type, 2024 to 2034
Figure 239: East Asia Market Value (US$ Billion) Analysis by Chamber Type, 2019 to 2034
Figure 240: East Asia Market Volume (Units) Analysis by Chamber Type, 2019 to 2034
Figure 241: East Asia Market Value Share (%) and BPS Analysis by Chamber Type, 2024 to 2034
Figure 242: East Asia Market Y-o-Y Growth (%) Projections by Chamber Type, 2024 to 2034
Figure 243: East Asia Market Value (US$ Billion) Analysis by End-User, 2019 to 2034
Figure 244: East Asia Market Volume (Units) Analysis by End-User, 2019 to 2034
Figure 245: East Asia Market Value Share (%) and BPS Analysis by End-User, 2024 to 2034
Figure 246: East Asia Market Y-o-Y Growth (%) Projections by End-User, 2024 to 2034
Figure 247: East Asia Market Attractiveness by Product Type, 2024 to 2034
Figure 248: East Asia Market Attractiveness by Modality, 2024 to 2034
Figure 249: East Asia Market Attractiveness by Loading Type, 2024 to 2034
Figure 250: East Asia Market Attractiveness by Chamber Type, 2024 to 2034
Figure 251: East Asia Market Attractiveness by End-User, 2024 to 2034
Figure 252: East Asia Market Attractiveness by Country, 2024 to 2034
Figure 253: Middle East and Africa Market Value (US$ Billion) by Product Type, 2024 to 2034
Figure 254: Middle East and Africa Market Value (US$ Billion) by Modality, 2024 to 2034
Figure 255: Middle East and Africa Market Value (US$ Billion) by Loading Type, 2024 to 2034
Figure 256: Middle East and Africa Market Value (US$ Billion) by Chamber Type, 2024 to 2034
Figure 257: Middle East and Africa Market Value (US$ Billion) by End-User, 2024 to 2034
Figure 258: Middle East and Africa Market Value (US$ Billion) by Country, 2024 to 2034
Figure 259: Middle East and Africa Market Value (US$ Billion) Analysis by Country, 2019 to 2034
Figure 260: Middle East and Africa Market Volume (Units) Analysis by Country, 2019 to 2034
Figure 261: Middle East and Africa Market Value Share (%) and BPS Analysis by Country, 2024 to 2034
Figure 262: Middle East and Africa Market Y-o-Y Growth (%) Projections by Country, 2024 to 2034
Figure 263: Middle East and Africa Market Value (US$ Billion) Analysis by Product Type, 2019 to 2034
Figure 264: Middle East and Africa Market Volume (Units) Analysis by Product Type, 2019 to 2034
Figure 265: Middle East and Africa Market Value Share (%) and BPS Analysis by Product Type, 2024 to 2034
Figure 266: Middle East and Africa Market Y-o-Y Growth (%) Projections by Product Type, 2024 to 2034
Figure 267: Middle East and Africa Market Value (US$ Billion) Analysis by Modality, 2019 to 2034
Figure 268: Middle East and Africa Market Volume (Units) Analysis by Modality, 2019 to 2034
Figure 269: Middle East and Africa Market Value Share (%) and BPS Analysis by Modality, 2024 to 2034
Figure 270: Middle East and Africa Market Y-o-Y Growth (%) Projections by Modality, 2024 to 2034
Figure 271: Middle East and Africa Market Value (US$ Billion) Analysis by Loading Type, 2019 to 2034
Figure 272: Middle East and Africa Market Volume (Units) Analysis by Loading Type, 2019 to 2034
Figure 273: Middle East and Africa Market Value Share (%) and BPS Analysis by Loading Type, 2024 to 2034
Figure 274: Middle East and Africa Market Y-o-Y Growth (%) Projections by Loading Type, 2024 to 2034
Figure 275: Middle East and Africa Market Value (US$ Billion) Analysis by Chamber Type, 2019 to 2034
Figure 276: Middle East and Africa Market Volume (Units) Analysis by Chamber Type, 2019 to 2034
Figure 277: Middle East and Africa Market Value Share (%) and BPS Analysis by Chamber Type, 2024 to 2034
Figure 278: Middle East and Africa Market Y-o-Y Growth (%) Projections by Chamber Type, 2024 to 2034
Figure 279: Middle East and Africa Market Value (US$ Billion) Analysis by End-User, 2019 to 2034
Figure 280: Middle East and Africa Market Volume (Units) Analysis by End-User, 2019 to 2034
Figure 281: Middle East and Africa Market Value Share (%) and BPS Analysis by End-User, 2024 to 2034
Figure 282: Middle East and Africa Market Y-o-Y Growth (%) Projections by End-User, 2024 to 2034
Figure 283: Middle East and Africa Market Attractiveness by Product Type, 2024 to 2034
Figure 284: Middle East and Africa Market Attractiveness by Modality, 2024 to 2034
Figure 285: Middle East and Africa Market Attractiveness by Loading Type, 2024 to 2034
Figure 286: Middle East and Africa Market Attractiveness by Chamber Type, 2024 to 2034
Figure 287: Middle East and Africa Market Attractiveness by End-User, 2024 to 2034
Figure 288: Middle East and Africa Market Attractiveness by Country, 2024 to 2034
The autoclave market is expected to garner a 4.70% CAGR from 2024 to 2034.
By 2024, the global autoclave market is likely to gain USD 2.32 billion.
By 2034, the autoclave market valuation is likely to reach a sum of USD 3.68 billion.
The autoclave industry in the United States is likely to garner a 2.90% CAGR during the forecast period.
The gravity autoclave is likely to gain traction in the global autoclave market with a 53% market share in 2024.
The floor standing modality is anticipated to be dominantly used, with an expected 34.80% market share in 2024.
Explore Similar Insights
Thank you!
You will receive an email from our Business Development Manager. Please be sure to check your SPAM/JUNK folder too.