Autoclave Market Snapshot from 2024 to 2034

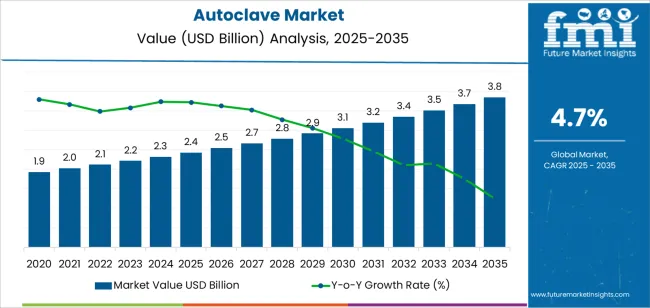
The autoclave market had an estimated market share worth US$ 2.2 billion in 2023, and it is predicted to reach a global market valuation of US$ 3.68 billion by 2034, advancing at a CAGR of 4.70% from 2024 to 2034.

Demand Analysis of Autoclaves

  • Companies may profit from autoclave sales by making sure that the strict sterilization regulations in healthcare and laboratory environments are followed, which will help them stay out of problems and keep their good name.
  • Companies may stand out from the competition by providing top notch autoclaves with innovative features and exceptional performance. This will draw in clients looking for dependable sterilizing options and promote brand loyalty.
  • Autoclaves make it possible to sterilize medical equipment quickly and effectively, which streamlines processes and boosts output in hospitals and improves patient care while also saving money.
  • Companies may diversify their income streams and take advantage of emerging market prospects by adding autoclaves to their product offerings in addition to other medical supplies and equipment. This will allow them to tap into the growing need for sterilizing equipment.
Report Attribute Details
Estimated Market Value in 2023 US$ 2.2 billion
Expected Market Value in 2024 US$ 2.32 billion
Projected Forecast Value in 2034 US$ 3.68 billion
Anticipated Growth Rate from 2024 to 2034 4.7%

Don't pay for what you don't need

Customize your report by selecting specific countries or regions and save 30%!

Autoclave Market Historical Analysis 2019 to 2023 Vs. Forecast Outlook 2024 to 2034

The global demand for the autoclave market was estimated to reach a valuation of US$ 1,723.60 million in 2018, according to a report from Future Market Insights. From 2019 to 2023, the autoclave market witnessed significant growth, registering a CAGR of 5%.

Historical CAGR 2019 to 2023 5%
Forecast CAGR 2024 to 2034 4.70%

The market for autoclave is expected to grow in the future due to these factors

  • Demand will be fueled by the rising incidence of infectious disorders as well as the continuous focus on infection control and sterilization in healthcare settings.
  • Automation, Internet of Things integration, and better sterilizing techniques are examples of technological developments that will increase productivity and dependability.
  • Global healthcare infrastructure development and the increasing use of autoclaves in developing nations will both contribute to market expansion.
  • There will be new prospects for market development due to the growing need for small and portable autoclaves, especially in distant or mobile healthcare institutions.

Key Factors Driving the Autoclave Market

Increasing Focus on Infection Prevention and Control to Push Market Growth

An increasing focus on infection prevention and control in healthcare settings is driving the autoclave market. Sterilization procedures are being given top priority in hospitals and clinics throughout the globe in order to reduce hazards and guarantee patient safety, since healthcare associated infections continue to be a major problem.

Given the increased emphasis on infection control, autoclaves are becoming more and more in demand as essential tools for sterilizing medical equipment and instruments, which is driving market expansion. The market for autoclaves is growing as a result of strict regulations controlling sterilization standards.

Healthcare establishments are required by regulatory authorities to purchase dependable autoclaves that either meet or surpass these criteria for sterilizing procedures, as these agencies are always updating their rules and regulations. Healthcare facilities are under regulatory pressure to purchase sophisticated autoclave systems, which is fueling market growth and continuous demand.

Sabyasachi Ghosh
Sabyasachi Ghosh

Principal Consultant

Talk to Analyst

Find your sweet spots for generating winning opportunities in this market.

Factors that can impede Market Growth

High Initials Costs and Technological Challenges to Restrict Market Growth

A number of obstacles, including the high initial investment costs involved in purchasing and maintaining autoclave equipment, may hinder market growth in the global autoclave market.

Healthcare institutions may also face obstacles from complicated regulatory compliance requirements and the demand for substantial training in order to operate autoclaves efficiently, which would restrict their use and impede market development. Technological constraints or improvements in substitute sterilizing techniques may potentially provide obstacles to the autoclave market's further expansion.

Category wise Insights

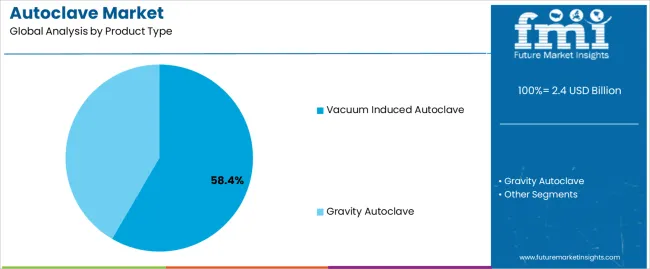
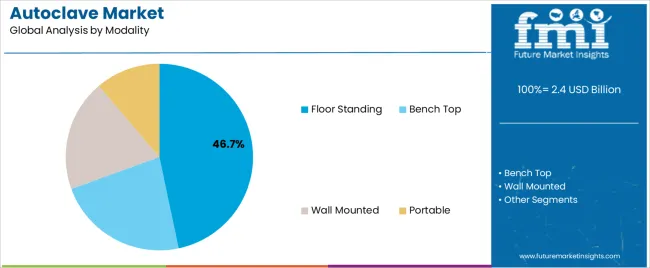
This section focuses on providing detailed analysis of two particular market segments for the autoclave, the dominant product and the significant modality. The two main segments discussed below are the gravity autoclave and floor standing modality.

Gravity Autoclave to Gain Prominence in the Autoclave Market in 2024

Product Type Gravity Autoclave
Market Share in 2024 53%

In 2024, the gravity autoclave is likely to gain a market share of 53%. Gravity autoclaves are a reliable and affordable option that will likely see growth in this market. Gravity autoclaves are easier to build and operate than other types of autoclaves since they sterilize using air's inherent downward movement.

They are a desirable alternative for healthcare institutions, particularly in environments with limited resources, owing to their cheaper initial investment and ongoing maintenance costs, which encourages more adoption and fosters market expansion.

Autoclaves with Floor Standing Modality will be in Greater Demand

Modality Floor Standing
Market Share in 2024 34.80%

In 2024, the floor standing modality segment is anticipated to acquire 34.80% market share. The floor standing modality autoclave is expected to gain popularity owing to its adaptability and ability to handle heavier loads of medical equipment and apparatus.

These autoclaves are ideal for busy healthcare establishments with high sterilization demands since they have a large chamber volume. Their strong design and innovative features, such as programmable cycles and effective drying systems, improve workflow management and sterilizing efficiency. They therefore appeal to medical professionals looking for dependable and effective sterilizing solutions, which promotes market acceptance.

Get the data you need at a Fraction of the cost

Personalize your report by choosing insights you need
and save 40%!

Comparative View of Adjacent Markets

In this section, analysis will be drawn among three relevant markets. These are the autoclave market, dental autoclaves market, and infection prevention market.

Growing emphasis on sterilization as well as infection control in healthcare settings is one of the common driving factors for the autoclave, dental autoclave, and infection prevention markets. Demand is further increased by stricter regulations and an increase in the frequency of infectious illnesses.

The market is growing as a result of expanding healthcare facilities and technological improvements, especially owing to the growing demand for less invasive surgical treatments.

Autoclave Market:

Market Name Autoclave Market
CAGR from 2024 to 2034 4.70%
Growth Factor The market for autoclaves is primarily driven by the growing importance of infection control and sterilization in healthcare settings, which is being driven by more stringent laws and an increase in the incidence of infectious illnesses.
Future Opportunities The rising need for portable and compact autoclave machines, especially in emerging economies and rural healthcare institutions, presents one potential in the autoclave market.

Dental Autoclaves Market:

Market Name Dental Autoclaves Market
CAGR from 2024 to 2034 5.1%
Growth Factor Demand in the market is anticipated to rise in response to the growing incidence of infectious illnesses as well as growing awareness of contamination and the transmission of infections via equipment and persons.
Future Opportunities Dental autoclave demand is expected to rise as a result of instrument sterilizers' effective performance in producing timely and high quality outcomes.

Infection Prevention Market:

Market Name Infection Prevention Market
CAGR from 2024 to 2034 3.1%
Growth Factor The market is primarily propelled by a rise in clinical and surgical procedures that need stringent infection control.
Future Opportunities The type of chemicals used as agents and the availability of different commodities based on heat sensitivity have an impact on market growth.

Region wise Analysis

This section will go into detail on the autoclave markets in a few key countries, including the United States, the United Kingdom,China, Japan and South Korea. This part will focus on the key factors that are driving up demand in these countries for the autoclave.

Countries CAGR from 2024 to 2034
The United States 2.90%
The United Kingdom 4.10%
China 2.90%
Japan 1.30%
South Korea 1.60%

Rise in Outpatient Surgeries and Regulations in the United States to Accelerate Demand

The United States autoclave ecosystem is anticipated to gain a CAGR of 2.90% through 2034. Factors that are bolstering the growth are:

  • The need for autoclaves in ambulatory surgical centers and clinics is driven by the increase in outpatient operations and minimally invasive procedures. Sterilization of equipment is crucial for ensuring patient safety and preventing infections.
  • Healthcare institutions must employ autoclaves for sterilization in order to comply with strict regulations imposed by agencies like the CDC and FDA. This ensures adherence to infection control protocols and fuels demand for dependable sterilization products.

Healthcare across Underserved Communities in the United Kingdom to Boost Demand

The autoclave market in the United Kingdom is expected to expand with a 4.10% CAGR through 2034. The factors pushing the growth are:

  • High quality autoclaves are used in healthcare institutions all across the United Kingdom considering the strict sterilizing criteria imposed by the NHS. This ensures compliance with strict infection control measures and drives demand in the market.
  • Healthcare institutions seek for autoclaves with environmentally friendly characteristics, including energy efficient operation and recyclable materials, in order to connect with the United Kingdom's green initiatives and drive market growth. This is a result of the country's focus on environmental sustainability.

Adoption of Traditional Chinese Medicine (TCM) in China to Bolster Growth

The autoclave ecosystem in China is anticipated to develop with a 2.90% CAGR from 2024 to 2034. The drivers behind this growth are:

  • The need for autoclaves to sanitize TCM instruments and equipment, like acupuncture needles as well as herbal preparation tools, is fueled by TCM's growing popularity in China and is expected to drive market development.
  • The necessity for dependable autoclaves to guarantee the efficacy of sterilization procedures is further driven by the increased emphasis on patient safety and infection control requirements in TCM clinics and hospitals.

Increasing Focus on Disaster Preparedness in Japan to Heighten Demand

The autoclave industry in Japan is anticipated to reach a 1.30% CAGR from 2024 to 2034. The drivers propelling growth forward are:

  • A greater emphasis is being placed on disaster preparedness in healthcare institutions due to Japan's vulnerability to natural catastrophes, such as earthquakes and tsunamis.
  • Autoclaves are critical in assuring the availability of clean medical equipment and supplies during emergency response activities, which drives demand for dependable sterilizing solutions.

Cultural Emphasis on Hygiene in South Korea to Enhance Market Growth

The autoclave ecosystem in South Korea is likely to evolve with a 1.6% CAGR during the forecast period. The factors bolstering the growth are:
  • Health and hygiene are highly valued in South Korean society, which increases the need for advanced sterilization tools like autoclaves to maintain hygienic conditions and public safety in medical institutions and other settings.
  • A favorable environment for market expansion is created by the South Korean government's expenditures in healthcare infrastructure. It includes programs to improve infection control measures, which lead to a rise in the use of autoclaves in medical institutions.

Market Competition

To stay competitive and take advantage of new chances, market players in the global autoclave market are concentrating on innovation, growth, and strategic partnerships. Companies spend money on research and development to bring in innovative technologies like automation, Internet of Things connectivity, and environmentally friendly sterilizing techniques.

Through joint ventures and acquisitions, they increase their geographic reach in order to get access to new markets and clientele. Strategic partnerships with regulatory agencies and healthcare providers support and strengthen efforts to create new products, which in turn propels market expansion.

The key players in this market include:

  • Steris healthcare
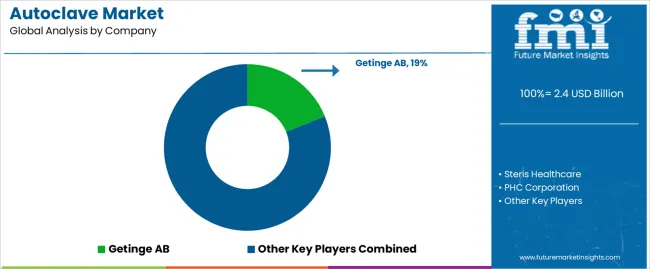
  • Getinge AB
  • PHC Corporation
  • Shinva Medical Instruments Co. Ltd.
  • MELAG Medizintechnik GmbH & Co. KG
  • Astell Scientific
  • Consolidated Sterilizer Systems
  • Tuttnauer
  • Labtron Equipment
  • BMT Medical Technology S.R.O.
  • LTE Scientific

Significant advancements in the autoclave market are being made by key market participants, and their offerings include:

  • In 2023, Getinge has announced a deal to purchase 100% of the stock in High Purity New England, Inc., a leading USA based firm in the rapidly expanding field of tailored single use solutions for bioprocessing applications. The acquisition represents a new phase in Getinge Life Science's strategic plan to increase their market share in the biopharma industry.

Key Coverage in Autoclave Market Report

  • Steam Autoclave Market
  • Autoclaves Market Size, Share and Growth
  • Dental Autoclave Market
  • Pharmaceutical Autoclave Market
  • Portable Steam Autoclave Market

Report Scope

Report Attribute Details
Growth Rate CAGR of 4.7% from 2024 to 2034
Market value in 2024 US$ 2.32 billion
Market value in 2034 US$ 3.68 billion
Base Year for Estimation 2023
Historical Data 2018 to 2023
Forecast Period 2024 to 2034
Quantitative Units US$ billion for value
Report Coverage Revenue Forecast, Company Ranking, Competitive Landscape, Growth Factors, Trends, and Pricing Analysis
Segments Covered
  • Product Type
  • Modality
  • Loading Type
  • Chamber Type
  • End User
  • Region
Regions Covered
  • North America
  • Latin America
  • Western Europe
  • Eastern Europe
  • South Asia and Pacific
  • East Asia
  • The Middle East & Africa
Countries Profiled
  • The United States
  • Canada
  • Brazil
  • Mexico
  • Germany
  • The United Kingdom
  • France
  • Spain
  • Italy
  • Poland
  • Russia
  • Czech Republic
  • Romania
  • India
  • Bangladesh
  • Australia
  • New Zealand
  • China
  • Japan
  • South Korea
  • GCC Countries
  • South Africa
  • Israel
Key Companies Profiled
  • Steris healthcare
  • Getinge AB
  • PHC Corporation
  • Shinva Medical Instruments Co. Ltd.
  • MELAG Medizintechnik GmbH & Co. KG
  • Astell Scientific
  • Consolidated Sterilizer Systems
  • Tuttnauer
  • Labtron Equipment
  • BMT Medical Technology S.R.O.
  • LTE Scientific
Customization Scope Available on Request

Key Segments Profiled in the Autoclave Market

By Product Type:

  • Gravity Autoclave
  • Vacuum induced Autoclave

By Modality:

  • Floor standing
  • Bench Top
  • Wall Mounted
  • Portable

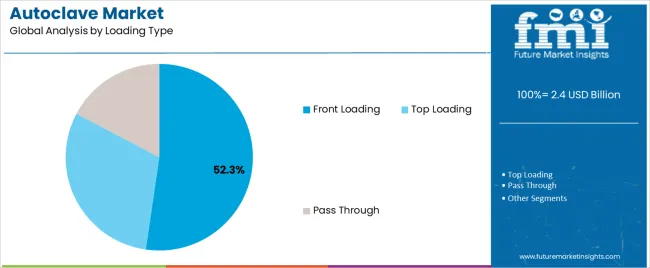
By Loading Type:

  • Top Loading
  • Front Loading
  • Pass Through

By Chamber Type:

  • Cylindrical
  • Rectangular

By End User:

  • Hospitals
  • Office Based Clinics
  • Academic and Research Institutes
  • Research Laboratories
  • Pathology Laboratories
  • Biopharmaceutical Companies
  • Food and Beverages Companies

By Region:

  • North America
  • Latin America
  • Western Europe
  • Eastern Europe
  • South Asia and Pacific
  • East Asia
  • Middle East & Africa

Frequently Asked Questions

What is the anticipated growth rate of the autoclave market from 2024 to 2034?

The autoclave market is expected to garner a 4.70% CAGR from 2024 to 2034.

What will be the global market outlook for autoclave through 2024?

By 2024, the global autoclave market is likely to gain US$ 2.32 billion.

What is the expected global market valuation for autoclave by 2034?

By 2034, the autoclave market valuation is likely to reach a sum of US$ 3.68 billion.

How will the demand for autoclave develop in the United States?

The autoclave industry in the United States is likely to garner a 2.90% CAGR during the forecast period.

Which type of autoclave is likely to gain traction in the autoclave market?

The gravity autoclave is likely to gain traction in the global autoclave market with a 53% market share in 2024.

Which modality of autoclave will dominantly be used in the autoclave market?

The floor standing modality is anticipated to be dominantly used, with an expected 34.80% market share in 2024.

Table of Content
1. Executive Summary

    1.1. Global Market Outlook

    1.2. Demand-side Trends

    1.3. Supply-side Trends

    1.4. Technology Roadmap Analysis

    1.5. Analysis and Recommendations

2. Market Overview

    2.1. Market Coverage / Taxonomy

    2.2. Market Definition / Scope / Limitations

3. Market Background

    3.1. Market Dynamics

        3.1.1. Drivers

        3.1.2. Restraints

        3.1.3. Opportunity

        3.1.4. Trends

    3.2. Scenario Forecast

        3.2.1. Demand in Optimistic Scenario

        3.2.2. Demand in Likely Scenario

        3.2.3. Demand in Conservative Scenario

    3.3. Opportunity Map Analysis

    3.4. Product Life Cycle Analysis

    3.5. Supply Chain Analysis

        3.5.1. Supply Side Participants and their Roles

            3.5.1.1. Manufacturer

            3.5.1.2. Mid-Level Participants (Traders)

            3.5.1.3. Distributors

        3.5.2. Value Added and Value Created at Node in the Supply Chain

        3.5.3. List of Raw Material Suppliers

        3.5.4. List of Existing and Potential Buyer’s

    3.6. Investment Feasibility Matrix

    3.7. Value Chain Analysis

        3.7.1. Profit Margin Analysis

        3.7.2. Distributors

    3.8. PESTLE and Porter’s Analysis

    3.9. Regulatory Landscape

        3.9.1. By Key Regions

        3.9.2. By Key Countries

    3.10. Regional Parent Market Outlook

    3.11. Production and Consumption Statistics

    3.12. Import and Export Statistics

4. Global Market Analysis 2019 to 2023 and Forecast, 2024 to 2034

    4.1. Historical Market Size Value (US$ Billion) & Volume (Units) Analysis, 2019 to 2023

    4.2. Current and Future Market Size Value (US$ Billion) & Volume (Units) Projections, 2024 to 2034

        4.2.1. Y-o-Y Growth Trend Analysis

        4.2.2. Absolute $ Opportunity Analysis

5. Global Market Analysis 2019 to 2023 and Forecast 2024 to 2034, By Product Type

    5.1. Introduction / Key Findings

    5.2. Historical Market Size Value (US$ Billion) & Volume (Units) Analysis By Product Type, 2019 to 2023

    5.3. Current and Future Market Size Value (US$ Billion) & Volume (Units) Analysis and Forecast By Product Type, 2024 to 2034

        5.3.1. Gravity Autoclave

        5.3.2. Vacuum-Induced Autoclave

    5.4. Y-o-Y Growth Trend Analysis By Product Type, 2019 to 2023

    5.5. Absolute $ Opportunity Analysis By Product Type, 2024 to 2034

6. Global Market Analysis 2019 to 2023 and Forecast 2024 to 2034, By Modality

    6.1. Introduction / Key Findings

    6.2. Historical Market Size Value (US$ Billion) & Volume (Units) Analysis By Modality, 2019 to 2023

    6.3. Current and Future Market Size Value (US$ Billion) & Volume (Units) Analysis and Forecast By Modality, 2024 to 2034

        6.3.1. Floor Standing

        6.3.2. Bench Top

        6.3.3. Wall Mounted

        6.3.4. Portable

    6.4. Y-o-Y Growth Trend Analysis By Modality, 2019 to 2023

    6.5. Absolute $ Opportunity Analysis By Modality, 2024 to 2034

7. Global Market Analysis 2019 to 2023 and Forecast 2024 to 2034, By Loading Type

    7.1. Introduction / Key Findings

    7.2. Historical Market Size Value (US$ Billion) & Volume (Units) Analysis By Loading Type, 2019 to 2023

    7.3. Current and Future Market Size Value (US$ Billion) & Volume (Units) Analysis and Forecast By Loading Type, 2024 to 2034

        7.3.1. Top Loading

        7.3.2. Front Loading

        7.3.3. Pass-Through

    7.4. Y-o-Y Growth Trend Analysis By Loading Type, 2019 to 2023

    7.5. Absolute $ Opportunity Analysis By Loading Type, 2024 to 2034

8. Global Market Analysis 2019 to 2023 and Forecast 2024 to 2034, By Chamber Type

    8.1. Introduction / Key Findings

    8.2. Historical Market Size Value (US$ Billion) & Volume (Units) Analysis By Chamber Type, 2019 to 2023

    8.3. Current and Future Market Size Value (US$ Billion) & Volume (Units) Analysis and Forecast By Chamber Type, 2024 to 2034

        8.3.1. Cylindrical Chamber

        8.3.2. Rectangular Chamber

    8.4. Y-o-Y Growth Trend Analysis By Chamber Type, 2019 to 2023

    8.5. Absolute $ Opportunity Analysis By Chamber Type, 2024 to 2034

9. Global Market Analysis 2019 to 2023 and Forecast 2024 to 2034, By End-User

    9.1. Introduction / Key Findings

    9.2. Historical Market Size Value (US$ Billion) & Volume (Units) Analysis By End-User, 2019 to 2023

    9.3. Current and Future Market Size Value (US$ Billion) & Volume (Units) Analysis and Forecast By End-User, 2024 to 2034

        9.3.1. Hospitals

        9.3.2. Office-Based Clinics

        9.3.3. Academic and Research Institutes

        9.3.4. Research Laboratories

        9.3.5. Pathology Laboratories

        9.3.6. Biopharmaceutical Companies

        9.3.7. Food and Beverages Companies

    9.4. Y-o-Y Growth Trend Analysis By End-User, 2019 to 2023

    9.5. Absolute $ Opportunity Analysis By End-User, 2024 to 2034

10. Global Market Analysis 2019 to 2023 and Forecast 2024 to 2034, By Region

    10.1. Introduction

    10.2. Historical Market Size Value (US$ Billion) & Volume (Units) Analysis By Region, 2019 to 2023

    10.3. Current Market Size Value (US$ Billion) & Volume (Units) Analysis and Forecast By Region, 2024 to 2034

        10.3.1. North America

        10.3.2. Latin America

        10.3.3. Western Europe

        10.3.4. Eastern Europe

        10.3.5. South Asia and Pacific

        10.3.6. East Asia

        10.3.7. Middle East and Africa

    10.4. Market Attractiveness Analysis By Region

11. North America Market Analysis 2019 to 2023 and Forecast 2024 to 2034, By Country

    11.1. Historical Market Size Value (US$ Billion) & Volume (Units) Trend Analysis By Market Taxonomy, 2019 to 2023

    11.2. Market Size Value (US$ Billion) & Volume (Units) Forecast By Market Taxonomy, 2024 to 2034

        11.2.1. By Country

            11.2.1.1. USA

            11.2.1.2. Canada

        11.2.2. By Product Type

        11.2.3. By Modality

        11.2.4. By Loading Type

        11.2.5. By Chamber Type

        11.2.6. By End-User

    11.3. Market Attractiveness Analysis

        11.3.1. By Country

        11.3.2. By Product Type

        11.3.3. By Modality

        11.3.4. By Loading Type

        11.3.5. By Chamber Type

        11.3.6. By End-User

    11.4. Key Takeaways

12. Latin America Market Analysis 2019 to 2023 and Forecast 2024 to 2034, By Country

    12.1. Historical Market Size Value (US$ Billion) & Volume (Units) Trend Analysis By Market Taxonomy, 2019 to 2023

    12.2. Market Size Value (US$ Billion) & Volume (Units) Forecast By Market Taxonomy, 2024 to 2034

        12.2.1. By Country

            12.2.1.1. Brazil

            12.2.1.2. Mexico

            12.2.1.3. Rest of Latin America

        12.2.2. By Product Type

        12.2.3. By Modality

        12.2.4. By Loading Type

        12.2.5. By Chamber Type

        12.2.6. By End-User

    12.3. Market Attractiveness Analysis

        12.3.1. By Country

        12.3.2. By Product Type

        12.3.3. By Modality

        12.3.4. By Loading Type

        12.3.5. By Chamber Type

        12.3.6. By End-User

    12.4. Key Takeaways

13. Western Europe Market Analysis 2019 to 2023 and Forecast 2024 to 2034, By Country

    13.1. Historical Market Size Value (US$ Billion) & Volume (Units) Trend Analysis By Market Taxonomy, 2019 to 2023

    13.2. Market Size Value (US$ Billion) & Volume (Units) Forecast By Market Taxonomy, 2024 to 2034

        13.2.1. By Country

            13.2.1.1. Germany

            13.2.1.2. UK

            13.2.1.3. France

            13.2.1.4. Spain

            13.2.1.5. Italy

            13.2.1.6. Rest of Western Europe

        13.2.2. By Product Type

        13.2.3. By Modality

        13.2.4. By Loading Type

        13.2.5. By Chamber Type

        13.2.6. By End-User

    13.3. Market Attractiveness Analysis

        13.3.1. By Country

        13.3.2. By Product Type

        13.3.3. By Modality

        13.3.4. By Loading Type

        13.3.5. By Chamber Type

        13.3.6. By End-User

    13.4. Key Takeaways

14. Eastern Europe Market Analysis 2019 to 2023 and Forecast 2024 to 2034, By Country

    14.1. Historical Market Size Value (US$ Billion) & Volume (Units) Trend Analysis By Market Taxonomy, 2019 to 2023

    14.2. Market Size Value (US$ Billion) & Volume (Units) Forecast By Market Taxonomy, 2024 to 2034

        14.2.1. By Country

            14.2.1.1. Poland

            14.2.1.2. Russia

            14.2.1.3. Czech Republic

            14.2.1.4. Romania

            14.2.1.5. Rest of Eastern Europe

        14.2.2. By Product Type

        14.2.3. By Modality

        14.2.4. By Loading Type

        14.2.5. By Chamber Type

        14.2.6. By End-User

    14.3. Market Attractiveness Analysis

        14.3.1. By Country

        14.3.2. By Product Type

        14.3.3. By Modality

        14.3.4. By Loading Type

        14.3.5. By Chamber Type

        14.3.6. By End-User

    14.4. Key Takeaways

15. South Asia and Pacific Market Analysis 2019 to 2023 and Forecast 2024 to 2034, By Country

    15.1. Historical Market Size Value (US$ Billion) & Volume (Units) Trend Analysis By Market Taxonomy, 2019 to 2023

    15.2. Market Size Value (US$ Billion) & Volume (Units) Forecast By Market Taxonomy, 2024 to 2034

        15.2.1. By Country

            15.2.1.1. India

            15.2.1.2. Bangladesh

            15.2.1.3. Australia

            15.2.1.4. New Zealand

            15.2.1.5. Rest of South Asia and Pacific

        15.2.2. By Product Type

        15.2.3. By Modality

        15.2.4. By Loading Type

        15.2.5. By Chamber Type

        15.2.6. By End-User

    15.3. Market Attractiveness Analysis

        15.3.1. By Country

        15.3.2. By Product Type

        15.3.3. By Modality

        15.3.4. By Loading Type

        15.3.5. By Chamber Type

        15.3.6. By End-User

    15.4. Key Takeaways

16. East Asia Market Analysis 2019 to 2023 and Forecast 2024 to 2034, By Country

    16.1. Historical Market Size Value (US$ Billion) & Volume (Units) Trend Analysis By Market Taxonomy, 2019 to 2023

    16.2. Market Size Value (US$ Billion) & Volume (Units) Forecast By Market Taxonomy, 2024 to 2034

        16.2.1. By Country

            16.2.1.1. China

            16.2.1.2. Japan

            16.2.1.3. South Korea

        16.2.2. By Product Type

        16.2.3. By Modality

        16.2.4. By Loading Type

        16.2.5. By Chamber Type

        16.2.6. By End-User

    16.3. Market Attractiveness Analysis

        16.3.1. By Country

        16.3.2. By Product Type

        16.3.3. By Modality

        16.3.4. By Loading Type

        16.3.5. By Chamber Type

        16.3.6. By End-User

    16.4. Key Takeaways

17. Middle East and Africa Market Analysis 2019 to 2023 and Forecast 2024 to 2034, By Country

    17.1. Historical Market Size Value (US$ Billion) & Volume (Units) Trend Analysis By Market Taxonomy, 2019 to 2023

    17.2. Market Size Value (US$ Billion) & Volume (Units) Forecast By Market Taxonomy, 2024 to 2034

        17.2.1. By Country

            17.2.1.1. GCC Countries

            17.2.1.2. South Africa

            17.2.1.3. Israel

            17.2.1.4. Rest of MEA

        17.2.2. By Product Type

        17.2.3. By Modality

        17.2.4. By Loading Type

        17.2.5. By Chamber Type

        17.2.6. By End-User

    17.3. Market Attractiveness Analysis

        17.3.1. By Country

        17.3.2. By Product Type

        17.3.3. By Modality

        17.3.4. By Loading Type

        17.3.5. By Chamber Type

        17.3.6. By End-User

    17.4. Key Takeaways

18. Key Countries Market Analysis

    18.1. USA

        18.1.1. Pricing Analysis

        18.1.2. Market Share Analysis, 2023

            18.1.2.1. By Product Type

            18.1.2.2. By Modality

            18.1.2.3. By Loading Type

            18.1.2.4. By Chamber Type

            18.1.2.5. By End-User

    18.2. Canada

        18.2.1. Pricing Analysis

        18.2.2. Market Share Analysis, 2023

            18.2.2.1. By Product Type

            18.2.2.2. By Modality

            18.2.2.3. By Loading Type

            18.2.2.4. By Chamber Type

            18.2.2.5. By End-User

    18.3. Brazil

        18.3.1. Pricing Analysis

        18.3.2. Market Share Analysis, 2023

            18.3.2.1. By Product Type

            18.3.2.2. By Modality

            18.3.2.3. By Loading Type

            18.3.2.4. By Chamber Type

            18.3.2.5. By End-User

    18.4. Mexico

        18.4.1. Pricing Analysis

        18.4.2. Market Share Analysis, 2023

            18.4.2.1. By Product Type

            18.4.2.2. By Modality

            18.4.2.3. By Loading Type

            18.4.2.4. By Chamber Type

            18.4.2.5. By End-User

    18.5. Germany

        18.5.1. Pricing Analysis

        18.5.2. Market Share Analysis, 2023

            18.5.2.1. By Product Type

            18.5.2.2. By Modality

            18.5.2.3. By Loading Type

            18.5.2.4. By Chamber Type

            18.5.2.5. By End-User

    18.6. UK

        18.6.1. Pricing Analysis

        18.6.2. Market Share Analysis, 2023

            18.6.2.1. By Product Type

            18.6.2.2. By Modality

            18.6.2.3. By Loading Type

            18.6.2.4. By Chamber Type

            18.6.2.5. By End-User

    18.7. France

        18.7.1. Pricing Analysis

        18.7.2. Market Share Analysis, 2023

            18.7.2.1. By Product Type

            18.7.2.2. By Modality

            18.7.2.3. By Loading Type

            18.7.2.4. By Chamber Type

            18.7.2.5. By End-User

    18.8. Spain

        18.8.1. Pricing Analysis

        18.8.2. Market Share Analysis, 2023

            18.8.2.1. By Product Type

            18.8.2.2. By Modality

            18.8.2.3. By Loading Type

            18.8.2.4. By Chamber Type

            18.8.2.5. By End-User

    18.9. Italy

        18.9.1. Pricing Analysis

        18.9.2. Market Share Analysis, 2023

            18.9.2.1. By Product Type

            18.9.2.2. By Modality

            18.9.2.3. By Loading Type

            18.9.2.4. By Chamber Type

            18.9.2.5. By End-User

    18.10. Poland

        18.10.1. Pricing Analysis

        18.10.2. Market Share Analysis, 2023

            18.10.2.1. By Product Type

            18.10.2.2. By Modality

            18.10.2.3. By Loading Type

            18.10.2.4. By Chamber Type

            18.10.2.5. By End-User

    18.11. Russia

        18.11.1. Pricing Analysis

        18.11.2. Market Share Analysis, 2023

            18.11.2.1. By Product Type

            18.11.2.2. By Modality

            18.11.2.3. By Loading Type

            18.11.2.4. By Chamber Type

            18.11.2.5. By End-User

    18.12. Czech Republic

        18.12.1. Pricing Analysis

        18.12.2. Market Share Analysis, 2023

            18.12.2.1. By Product Type

            18.12.2.2. By Modality

            18.12.2.3. By Loading Type

            18.12.2.4. By Chamber Type

            18.12.2.5. By End-User

    18.13. Romania

        18.13.1. Pricing Analysis

        18.13.2. Market Share Analysis, 2023

            18.13.2.1. By Product Type

            18.13.2.2. By Modality

            18.13.2.3. By Loading Type

            18.13.2.4. By Chamber Type

            18.13.2.5. By End-User

    18.14. India

        18.14.1. Pricing Analysis

        18.14.2. Market Share Analysis, 2023

            18.14.2.1. By Product Type

            18.14.2.2. By Modality

            18.14.2.3. By Loading Type

            18.14.2.4. By Chamber Type

            18.14.2.5. By End-User

    18.15. Bangladesh

        18.15.1. Pricing Analysis

        18.15.2. Market Share Analysis, 2023

            18.15.2.1. By Product Type

            18.15.2.2. By Modality

            18.15.2.3. By Loading Type

            18.15.2.4. By Chamber Type

            18.15.2.5. By End-User

    18.16. Australia

        18.16.1. Pricing Analysis

        18.16.2. Market Share Analysis, 2023

            18.16.2.1. By Product Type

            18.16.2.2. By Modality

            18.16.2.3. By Loading Type

            18.16.2.4. By Chamber Type

            18.16.2.5. By End-User

    18.17. New Zealand

        18.17.1. Pricing Analysis

        18.17.2. Market Share Analysis, 2023

            18.17.2.1. By Product Type

            18.17.2.2. By Modality

            18.17.2.3. By Loading Type

            18.17.2.4. By Chamber Type

            18.17.2.5. By End-User

    18.18. China

        18.18.1. Pricing Analysis

        18.18.2. Market Share Analysis, 2023

            18.18.2.1. By Product Type

            18.18.2.2. By Modality

            18.18.2.3. By Loading Type

            18.18.2.4. By Chamber Type

            18.18.2.5. By End-User

    18.19. Japan

        18.19.1. Pricing Analysis

        18.19.2. Market Share Analysis, 2023

            18.19.2.1. By Product Type

            18.19.2.2. By Modality

            18.19.2.3. By Loading Type

            18.19.2.4. By Chamber Type

            18.19.2.5. By End-User

    18.20. South Korea

        18.20.1. Pricing Analysis

        18.20.2. Market Share Analysis, 2023

            18.20.2.1. By Product Type

            18.20.2.2. By Modality

            18.20.2.3. By Loading Type

            18.20.2.4. By Chamber Type

            18.20.2.5. By End-User

    18.21. GCC Countries

        18.21.1. Pricing Analysis

        18.21.2. Market Share Analysis, 2023

            18.21.2.1. By Product Type

            18.21.2.2. By Modality

            18.21.2.3. By Loading Type

            18.21.2.4. By Chamber Type

            18.21.2.5. By End-User

    18.22. South Africa

        18.22.1. Pricing Analysis

        18.22.2. Market Share Analysis, 2023

            18.22.2.1. By Product Type

            18.22.2.2. By Modality

            18.22.2.3. By Loading Type

            18.22.2.4. By Chamber Type

            18.22.2.5. By End-User

    18.23. Israel

        18.23.1. Pricing Analysis

        18.23.2. Market Share Analysis, 2023

            18.23.2.1. By Product Type

            18.23.2.2. By Modality

            18.23.2.3. By Loading Type

            18.23.2.4. By Chamber Type

            18.23.2.5. By End-User

19. Market Structure Analysis

    19.1. Competition Dashboard

    19.2. Competition Benchmarking

    19.3. Market Share Analysis of Top Players

        19.3.1. By Regional

        19.3.2. By Product Type

        19.3.3. By Modality

        19.3.4. By Loading Type

        19.3.5. By Chamber Type

        19.3.6. By End-User

20. Competition Analysis

    20.1. Competition Deep Dive

        20.1.1. Steris healthcare

            20.1.1.1. Overview

            20.1.1.2. Product Portfolio

            20.1.1.3. Profitability by Market Segments

            20.1.1.4. Sales Footprint

            20.1.1.5. Strategy Overview

                20.1.1.5.1. Marketing Strategy

                20.1.1.5.2. Product Strategy

                20.1.1.5.3. Channel Strategy

        20.1.2. Getinge AB

            20.1.2.1. Overview

            20.1.2.2. Product Portfolio

            20.1.2.3. Profitability by Market Segments

            20.1.2.4. Sales Footprint

            20.1.2.5. Strategy Overview

                20.1.2.5.1. Marketing Strategy

                20.1.2.5.2. Product Strategy

                20.1.2.5.3. Channel Strategy

        20.1.3. PHC Corporation

            20.1.3.1. Overview

            20.1.3.2. Product Portfolio

            20.1.3.3. Profitability by Market Segments

            20.1.3.4. Sales Footprint

            20.1.3.5. Strategy Overview

                20.1.3.5.1. Marketing Strategy

                20.1.3.5.2. Product Strategy

                20.1.3.5.3. Channel Strategy

        20.1.4. Shinva Medical Instruments Co. Ltd.

            20.1.4.1. Overview

            20.1.4.2. Product Portfolio

            20.1.4.3. Profitability by Market Segments

            20.1.4.4. Sales Footprint

            20.1.4.5. Strategy Overview

                20.1.4.5.1. Marketing Strategy

                20.1.4.5.2. Product Strategy

                20.1.4.5.3. Channel Strategy

        20.1.5. MELAG Medizintechnik GmbH & Co. KG

            20.1.5.1. Overview

            20.1.5.2. Product Portfolio

            20.1.5.3. Profitability by Market Segments

            20.1.5.4. Sales Footprint

            20.1.5.5. Strategy Overview

                20.1.5.5.1. Marketing Strategy

                20.1.5.5.2. Product Strategy

                20.1.5.5.3. Channel Strategy

        20.1.6. Astell Scientific

            20.1.6.1. Overview

            20.1.6.2. Product Portfolio

            20.1.6.3. Profitability by Market Segments

            20.1.6.4. Sales Footprint

            20.1.6.5. Strategy Overview

                20.1.6.5.1. Marketing Strategy

                20.1.6.5.2. Product Strategy

                20.1.6.5.3. Channel Strategy

        20.1.7. Consolidated Sterilizer Systems

            20.1.7.1. Overview

            20.1.7.2. Product Portfolio

            20.1.7.3. Profitability by Market Segments

            20.1.7.4. Sales Footprint

            20.1.7.5. Strategy Overview

                20.1.7.5.1. Marketing Strategy

                20.1.7.5.2. Product Strategy

                20.1.7.5.3. Channel Strategy

        20.1.8. Tuttnauer

            20.1.8.1. Overview

            20.1.8.2. Product Portfolio

            20.1.8.3. Profitability by Market Segments

            20.1.8.4. Sales Footprint

            20.1.8.5. Strategy Overview

                20.1.8.5.1. Marketing Strategy

                20.1.8.5.2. Product Strategy

                20.1.8.5.3. Channel Strategy

        20.1.9. Labtron Equipment

            20.1.9.1. Overview

            20.1.9.2. Product Portfolio

            20.1.9.3. Profitability by Market Segments

            20.1.9.4. Sales Footprint

            20.1.9.5. Strategy Overview

                20.1.9.5.1. Marketing Strategy

                20.1.9.5.2. Product Strategy

                20.1.9.5.3. Channel Strategy

        20.1.10. BMT Medical Technology S.R.O.

            20.1.10.1. Overview

            20.1.10.2. Product Portfolio

            20.1.10.3. Profitability by Market Segments

            20.1.10.4. Sales Footprint

            20.1.10.5. Strategy Overview

                20.1.10.5.1. Marketing Strategy

                20.1.10.5.2. Product Strategy

                20.1.10.5.3. Channel Strategy

        20.1.11. LTE Scientific

            20.1.11.1. Overview

            20.1.11.2. Product Portfolio

            20.1.11.3. Profitability by Market Segments

            20.1.11.4. Sales Footprint

            20.1.11.5. Strategy Overview

                20.1.11.5.1. Marketing Strategy

                20.1.11.5.2. Product Strategy

                20.1.11.5.3. Channel Strategy

21. Assumptions & Acronyms Used

22. Research Methodology
Recommendations

Healthcare

Infection Prevention Market

September 2021

REP-GB-13950

December 2023

333 pages

Healthcare

Industrial Microbiology Market

July 2021

REP-GB-1743

June 2023

342 pages

Healthcare

Dental Autoclaves Market

April 2022

REP-GB-14569

May 2023

342 pages

Packaging

Autoclaving Trays Market

September 2024

REP-GB-13398

Upcoming

Explore Healthcare Insights

View Reports