Reports

- Global Locations -

Headquarters

Future Market Insights, Inc.

Christiana Corporate, 200
Continental Drive, Suite 401,
Newark, Delaware - 19713,
United States

T: +1-845-579-5705

Americas

Future Market Insights, Inc.

616 Corporate Way, Suite 2-9018,
Valley Cottage, NY 10989, United States

T: +1-347-918-3531

MEA

Future Market Insights

1602-6 Jumeirah Bay X2 Tower, Plot No: JLT-PH2-X2A,
Jumeirah Lakes Towers, Dubai,
United Arab Emirates

Europe

Future Market Insights

3rd Floor, 207 Regent Street,
W1B 3HH London
United Kingdom

T: + 44 (0) 20 8123 9659
D: +44 (0) 20 3287 4268

Asia Pacific

Future Market Insights

IndiaLand Global Tech Park, Unit UG-1, Behind Grand HighStreet, Phase 1, Hinjawadi, MH, Pune – 411057, India

Bathroom Cabinets Market Snapshot (2023 to 2033)

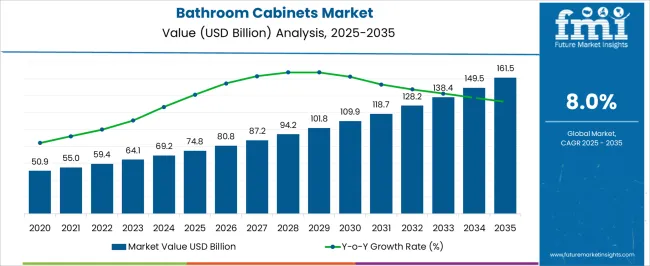
The global bathroom cabinets market is currently valued at US$ 64.12 Billion and is expected to grow at a CAGR of 8%. Bathroom cabinets will represent approximately 8% of the global market by 2033, owing to the significant design and technological advancements over the past few decades.

The designs of bathroom cabinets offer a sophisticated style, brilliant functionality, and a feeling of organization in the bathroom. Bathroom vanities, also known as cabinets, provide the ideal storage, décor, and hygiene solution. The latest bathroom cabinet designs will give consumers a great way to create real storage space in their bathroom without making it appear cluttered.

The vast majority of hotel guests and people around the world enjoy the convenience and tranquility of bathroom furniture that includes smart technology such as aroma diffusers, color-changing LEDs, and built-in speakers. It is expected that these technological advancements will boost the growth of bathroom cabinets in the years to come. Moreover, good utility services near sinks will become increasingly necessary as the construction industry continues to grow, especially in the hospitality sector.

Report Attribute Details
Expected Market Value (2023) US$ 64.12 Billion
Projected Forecast Value (2033) US$ 138.42 Billion
Global Growth Rate (2023 to 2033) 8% CAGR

Don't pay for what you don't need

Customize your report by selecting specific countries or regions and save 30%!

Bathroom Cabinets Revenue Analysis 2018 to 2022 vs. Future Outlook 2023 to 2033

According to market research and competitive intelligence provider FMI, the bathroom cabinets industry grew at a CAGR of 7% from 2018 to 2022. Due to the affordability of prices and the aesthetic appeal of bath cabinets that are built to fit the consumer bath experience, the market growth in the coming years is expected to be driven by the surge in demand for customized bath cabinets in the market. The industry's key players are developing advanced material products and launching major initiatives to address this trend in the market.

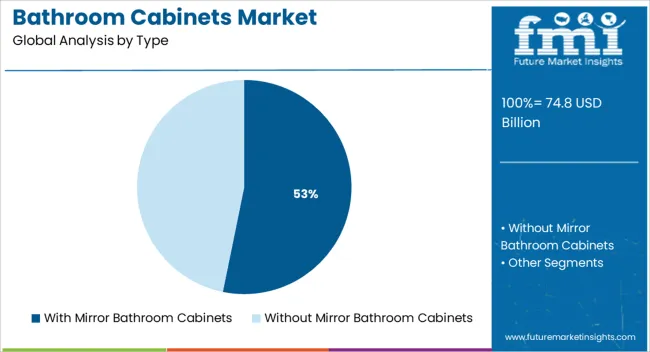
Increasing demand for premium products and high-quality products as well as designer bathrooms are expected to expand the market for bathroom cabinets in the future. Due to the increased concern over aesthetic appearances and cosmetics among consumers, the supply of bathroom cabinets with mirrors has become more important in modern times.

In addition to medicine chests, storage units, and frameless vanities, cabinets with value-added amenities are in great demand, as they offer a safer and more attractive storage alternative to free-standing cabinets or open shelves as compared to freestanding and open cabinets. Growing consumer awareness of contemporary and minimalist bathroom designs, sleek and low-profile wall cabinets are becoming more popular as they suit sleek and trendy bathroom designs. Hence the market for bathroom cabinets is expected to grow at a CAGR of 8% during the forecast period.

What are the Key Factors Driving the Market for Bathroom Cabinets?

The industry is seeing a gradual increase in the number of bathroom renovations and remodeling due to a greater awareness of bathroom décor among consumers and a higher standard of living is expected to grow the market for bathroom cabinets. Materials used in custom countertops, such as engineered wood, cherry wood, granite, marble, etc., are experiencing a surge in demand. The broad range of patterns offered by these products, the reasonable price point, and their ability to be used in a wide variety of applications are all factors that are expected to stimulate strong growth during the forecast period.

Since mobile phone penetration is increasing, the online market is expected to grow exponentially as customers move towards devices such as smartphones for shopping for everyday items. Businesses are now establishing online business channels to acquire new customers, instead of relying on a single-dimensional approach. In response, e-commerce has become one of the world's fastest-growing industries. With the growth of the e-commerce industry over the past few years, players have shifted their strategies to meet the growing demands of customers by focusing on having an omnichannel presence that caters to the needs of products, services, and so on.

Technological innovation and Designer Furniture are expected to Grow Market Demand for Bathroom Cabinets

Consumers are seeking out new design ideas and aesthetic experiences in bathroom cabinets, which makes the market for bathroom cabinets grow. In addition, the growing number of millennials who are tech-savvy has contributed to the growth of the market in recent years.

An analysis of the real estate market revealed that 77 percent of these young buyers are looking for homes with advanced features. Smart home automation systems are currently the hottest gadgets. The market is expected to grow steadily as consumers' demand for sensor cabinets and digital cabinets in bathrooms is expected to continue to grow. For instance, AXENT has ushered in a new era of artificial intelligence that is well-suited to the youth. The AXENT Group has officially launched its first fully-intelligent bathroom cabinet in the world. It has been a challenging but exciting project that the AXENT team has been working on, resulting in an invention that is revolutionizing the bathroom industry.

Sneha Verghese
Sneha Verghese

Principal Consultant

Talk to Analyst

Find your sweet spots for generating winning opportunities in this market.

Why is the Growth Rates of the Bathroom Cabinets Market Decelerating?

Labor and raw material costs are expected to pose a challenge to the market in the coming years. Providing seamless customer experiences and internal processes is a challenge for a growing number of local market players and active stakeholders. Increasing maintenance issues as well as changes in humidity are likely to hamper the growth of these markets.
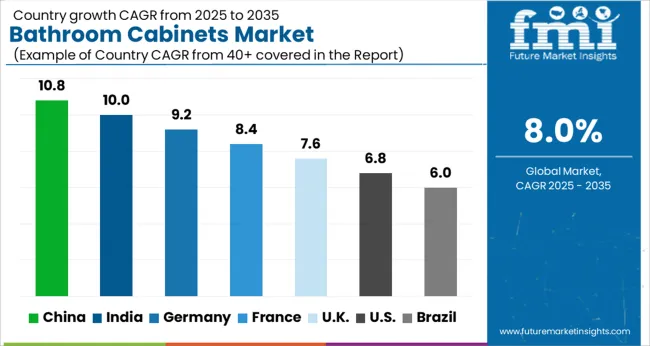
Country-wise Analysis

How does North America Contribute to Global Bathroom Cabinet Production?

Innovation and Technologies to Drive Growth in the Bathroom Cabinet Sector

North America held a significant share of the market in 2023, with the USA having the largest revenue contribution in the market. According to forecasts, North America will have a leading market share in bathroom cabinet sales. Smart bathroom cabinet products have high revenue-generating potential in countries such as the USA, and Canada, where consumers are willing to spend more on these products. Sensor technology-enabled bathroom cabinets also offer greater convenience to consumers, thus multiplying the value of the USA market by 2.5X within the next decade.

Due to the rise in residential projects and luxury hotels, as well as house renovations and construction, this region is experiencing an increase in demand for products. Further, the regional market is expected to grow in the coming years as a result of increasing demand for high-priced and multifunctioning bathroom cabinets in the hospitality sector, in addition to key manufacturers' efforts to innovate raw materials and incorporate advanced technologies into their manufacturing processes.
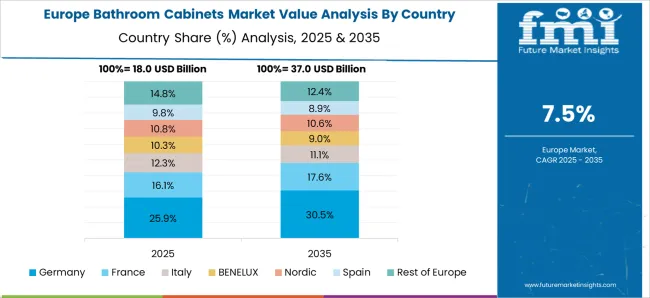
What Makes Europe a Lucrative Market for Bathroom Cabinets?

European Region will spearhead Bathroom Cabinet Production in Near Future

European bathroom cabinets will grow at a compound annual growth rate of more than 9.6% between 2023 and 2032. Consumer inclinations toward interior decorations and rising disposable incomes are expected to propel the European bathroom cabinet market during the forecast period.

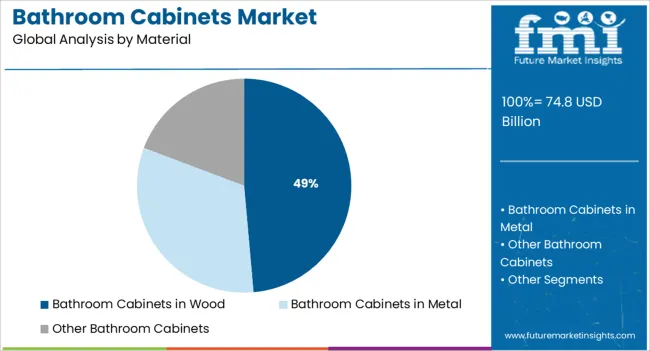
European consumers are moving towards modern design patterns and vivid colors for bathroom cabinets, which is likely to drive the market for European bathroom cabinets. A surge in demand for sustainable wooden cabinets as well as an increase in the use of mirror wall cabinets is expected to boost the market. Over the years, manufacturers have developed products that are eco-friendlier, versatile, durable, and easy to install.

The German market is considered to be one of the most important markets in the European region for bathroom cabinets. High-quality and advanced cabinet products are available in the country, including mirrored bathroom cabinets and digital wall cabinets for bathrooms. Another key factor that contributes to the growth of the market in the region is the significant amount of consumer spending on the construction of residential and commercial properties is expected to grow the market. Low-interest rates and state investments are factors contributing to the growth of the construction industry. German bathroom cabinet market growth is mainly influenced by the rapidly expanding residential infrastructure requirements that are expected to increase in the coming years.

How are Bathroom Cabinets Impacting the Market in the Asia Pacific Region?

Changing Demographics and Economic Growth to Create Demand for Bathroom Cabinets

According to market research, Asia Pacific is the most attractive market for bathroom cabinets. With a revenue share of 39%, the bathroom cabinets market continues to dominate the Asia Pacific market. With the rise in the middle-class population and the willingness of consumers to spend on premium bathroom cabinet products, bathroom cabinet demand is expected to grow positively in the near future. According to predictions, the Indian bathroom cabinets market will grow by 2X by 2025 due to the increase in consumer spending and the recent trend of home renovations in the market.

Lifestyles in emerging markets, such as China and India, are expected to change rapidly due to urbanization, which will boost regional markets' growth in the coming years. Increasing demand for modern and elegant bathroom styles, as well as large commercial bathroom settings with mirrors, is expected to enhance the market for bathroom cabinets in this region.

Get the data you need at a Fraction of the cost

Personalize your report by choosing insights you need
and save 40%!

Category-wise Insights

What is the Most Lucrative Product Type in the Bathroom Cabinets Market?

Increasing Demand for Compact Furniture Will Lead to High Revenues in the Bathroom Cabinet Market

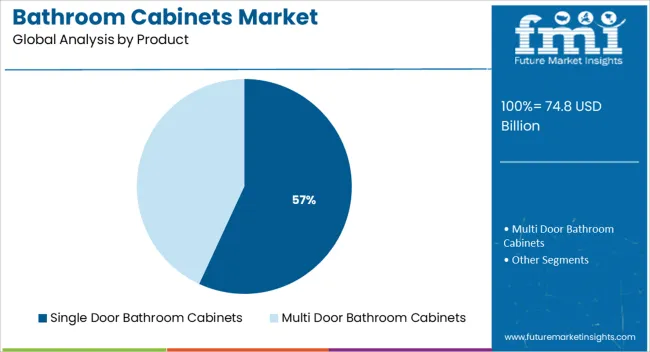
Based on product type the bathroom cabinet market is segmented into single-door and multi-door cabinets. According to the forecast, multi-door cabinets will grow at a CAGR of 6.9% from 2023 to 2033. Changing individual preferences, as well as accessibility to a variety of designs and materials are expected to increase consumer interest in multi-door bathroom cabinets. On a global scale, it is predicted that consumer comfort usage and aesthetics will be some of the factors that will positively impact the global demand for comfort products in the bathroom cabinets market.

As a result of urban housing development's-imposed preference for smaller spaces in order to enhance the living experience of residents, compact furniture for multi-purpose use is in high demand. The multifunctional nature of multi-door cabinets, which have a variety of uses, contributed greatly to the growth of the industry by making them much more attractive to consumers.

What is Driving the Popularity of Residential Bathroom Cabinets?

Modern and Elegant Designs Drive the Market for Bathroom Cabinets to Grow in Residential Segments

Residential bathroom cabinets accounted for more than 76% of sales of global market revenue in 2023. Residential bathroom cabinets are expected to grow at a CAGR of 12% during the forecast period. As a result of technological advancements and aesthetic enhancements over the past few years in the residential segment, there has been an increase in feature sets that can serve multiple purposes and impressive stylings to the consumers in the market. The urbanization of the world and the growth of the population have increased the demand for housing, which has led to smaller living spaces and a stronger real estate market.

A wide range of patterns and reliability are among the reasons why most consumers favor mirrored single-door cabinets. Increasing demand for new home development and renovations of existing homes has led to rapid growth in the residential market over the past few years. Increasing economic conditions and high standards of living among people, especially in developing regions, are likely to result in the market demand for bathroom cabinets increasing significantly in the near future.

Start-up Scenario

What is the Contribution of New Entrants to the Bathroom Cabinet Market?

Startups are increasingly entering the market for bathroom cabinets to meet the needs of consumers in the commercial and residential sectors. Innovative cabinet companies are also known for providing innovative designs and technologies to manufacture and design bathroom cabinets. In recent years, startups have started providing a variety of solutions to the bathroom cabinets market, from online solutions to offline solutions.

Some of the start-ups in the bathroom cabinets market include-
  • Sihe.com was established in 2000, in Shanghai, China. The firm is an online retailer that sells cabinets, tables, kitchen tiles, kitchen hardware, kitchen appliances, flooring, sanitary ware, bathroom hardware, bathroom tile, bathroom cabinet, etc. A broad range of products is sold on their platform, including those from domestic and international brands. A manufacturer of engineered wood flooring, Sihe Wood (Shanghai New Sihe Wood Co.) provides its products online through Sihe.com.
  • Cabinet Core was founded in 2020, in Ireland. The firm is SaaS-driven authoring software designed for cabinet manufacturers. Using the application, manufacturers can design cabinets for kitchens, bathrooms, bedrooms, and offices. This application allows users to perform 3D rendering, generate furniture quotes, add shelves, doors, partitions, and drawers, and manage errors.
  • The Cabinet World was founded in 2001, in Farmington, United States. A first-to-market online retailer, Cabinet World offers its products under a private label brand for kitchen and bathroom cabinets. A wide range of products is offered by this company, including kitchen cabinets, bathroom vanities, doors, etc. Additionally, the company offers custom-made services to homeowners.
  • Cabinetry can be customized by selecting the material, design, dimensions, etc., and it can also be viewed in 3D. It provides free shipping on all orders above $2.5k.

Competitive Landscape

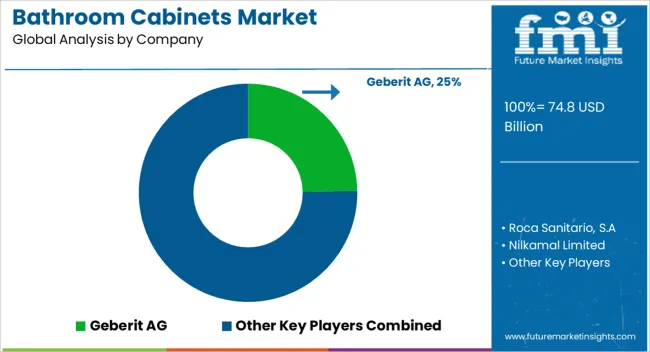
Bathroom cabinet manufacturers are aiming to meet changing consumer demands by offering innovative product designs. Leading manufacturers are working with reputed brands to launch new products that target a wider audience. For instance,

  • Geberit has enhanced its Geberit ONE and iCon series through a number of product enhancements based on the company's sanitary technology expertise and design capabilities. A variety of individual design options are available with the Geberit ONE washbasin cabinet and wash tops, such as single and double washbasins or washbasins with minimalist wash tops. With the launch of the new series, there will be three new types of washbasins to choose from - a standard washbasin, slim washbasins in various sizes, lay-on washbasins in two shapes, rectangular basins, and bowl basins.
  • A VitrA Bathrooms showroom has opened in Mumbai, strengthening its presence in the Indian market after opening flagship showrooms in London and Dubai. A 5500-square-foot bathroom experience center in the western suburbs offers a lot more than just a bathroom. Designed for the unique challenges of its clients, VitrA Bathrooms Mumbai Showroom is a unique combination of design inspiration, technical support, and exhibition space. Arik Levy, Ross Lovegrove, Terri Pecora, Claudio Bellini, and Arik Levy are among the designers collaborating on the showroom's designer bathroom collections.

Report Scope

Report Attribute Details
Growth Rate (2023 to 2033) 8%
Expected Market Value (2023) US$ 8.2 Billion
Projected Forecast Value (2033) US$ 138.42 Billion
Base Year for Estimation 2022
Historical Data 2018 to 2022
Forecast Period 2023 to 2033
Quantitative Units Revenue in USD Million and CAGR from 2023 to 2033
Report Coverage Revenue Forecast, Volume Forecast, Company Ranking, Competitive Landscape, Growth Factors, Trends, and Pricing Analysis
Segments Covered
  • Type
  • Material
  • Product
  • Application
  • Regions
Regions Covered
  • North America
  • Latin America
  • Europe
  • Asia Pacific
  • Middle East and Africa(MEA)
Key Countries Profiled
  • USA
  • Canada
  • Brazil
  • Mexico
  • Germany
  • United Kingdom
  • France
  • Spain
  • Italy
  • Rest of Europe
  • China
  • Japan
  • South Korea
  • Singapore
  • Thailand
  • Indonesia
  • Australia
  • New Zealand
  • Rest of Asia Pacific
  • GCC Countries
  • South Africa
  • Israel
  • Rest of the Middle East and Africa(MEA)
Key Companies Profiled
  • Geberit AG
  • Roca Sanitario
  • S.A, Nilkamal Limited
  • Duravit AG
  • Laufen Bathrooms AG
  • W.Scneider+Co AG
  • HiB
  • Emco Group
  • Roper Rhodes Ltd
  • FAB Glass.
Customization Available Upon Request

Key Segments Covered in the Bathroom Cabinets Market Industry Survey

Bathroom Cabinets Market by Type:

  • With Mirror Bathroom Cabinets
  • Without Mirror Bathroom Cabinets

Bathroom Cabinets Market by Material:

  • Bathroom Cabinets in Wood
  • Bathroom Cabinets in Metal
  • Other Bathroom Cabinets

Bathroom Cabinets Market by Product:

  • Single Door Bathroom Cabinets
  • Multi Door Bathroom Cabinets

Bathroom Cabinets Market by Application:

  • Residential Bathroom Cabinets
  • Commercial Bathroom Cabinets

Bathroom Cabinets Market by Region:

  • North America Bathroom Cabinets Market
  • Latin America Bathroom Cabinets Market
  • Europe Bathroom Cabinets Market
  • Asia Pacific Bathroom Cabinets Market
  • MEA Bathroom Cabinets Market

Frequently Asked Questions

What is the expected valuation of the bathroom cabinets market?

The global bathroom cabinets market is likely to reach a valuation of US$ 64.12 Billion by the end of 2023.

Who are the key players in the bathroom cabinets market?

Geberit AG, Roca Sanitario, S.A, Nilkamal Limited, Duravit AG, Laufen Bathrooms AG, W.Scneider+Co AG, HiB, Emco Group, Roper Rhodes Ltd, FAB Glass.

What are the future prospects for bathroom cabinet market sales?

Sales of the bathroom cabinets market are likely to expand at 8% CAGR through 2033.

Which are the top 5 countries driving demand for the bathroom cabinets market?

The USA, United Kingdom, Germany, China, and India are predicted to drive most of the bathroom cabinets market demand.

What will be the global bathroom cabinets market revenue total by 2033?

By the end of 2033, the global market for bathroom cabinets market is predicted to reach a valuation of US$ 138.42 Billion

Table of Content

1. Executive Summary | Bathroom Cabinets Market

    1.1. Global Market Outlook

    1.2. Demand-side Trends

    1.3. Supply-side Trends

    1.4. Technology Roadmap Analysis

    1.5. Analysis and Recommendations

2. Market Overview

    2.1. Market Coverage / Taxonomy

    2.2. Market Definition / Scope / Limitations

3. Market Background

    3.1. Market Dynamics

        3.1.1. Drivers

        3.1.2. Restraints

        3.1.3. Opportunity

        3.1.4. Trends

    3.2. Scenario Forecast

        3.2.1. Demand in Optimistic Scenario

        3.2.2. Demand in Likely Scenario

        3.2.3. Demand in Conservative Scenario

    3.3. Opportunity Map Analysis

    3.4. Product Life Cycle Analysis

    3.5. Supply Chain Analysis

        3.5.1. Supply Side Participants and their Roles

            3.5.1.1. Producers

            3.5.1.2. Mid-Level Participants (Traders/ Agents/ Brokers)

            3.5.1.3. Wholesalers and Distributors

        3.5.2. Value Added and Value Created at Node in the Supply Chain

        3.5.3. List of Raw Material Suppliers

        3.5.4. List of Existing and Potential Buyers

    3.6. Investment Feasibility Matrix

    3.7. Value Chain Analysis

        3.7.1. Profit Margin Analysis

        3.7.2. Wholesalers and Distributors

        3.7.3. Retailers

    3.8. PESTLE and Porter’s Analysis

    3.9. Regulatory Landscape

        3.9.1. By Key Regions

        3.9.2. By Key Countries

    3.10. Regional Parent Market Outlook

    3.11. Production and Consumption Statistics

    3.12. Import and Export Statistics

4. Global Market Analysis 2018 to 2022 and Forecast, 2023 to 2033

    4.1. Historical Market Size Value (US$ Million) & Volume (Units) Analysis, 2018 to 2022

    4.2. Current and Future Market Size Value (US$ Million) & Volume (Units) Projections, 2023 to 2033

        4.2.1. Y-o-Y Growth Trend Analysis

        4.2.2. Absolute $ Opportunity Analysis

5. Global Market Analysis 2018 to 2022 and Forecast 2023 to 2033, By Type

    5.1. Introduction / Key Findings

    5.2. Historical Market Size Value (US$ Million) & Volume (Units) Analysis By Type, 2018 to 2022

    5.3. Current and Future Market Size Value (US$ Million) & Volume (Units) Analysis and Forecast By Type, 2023 to 2033

        5.3.1. With Mirror

        5.3.2. Without Mirror

    5.4. Y-o-Y Growth Trend Analysis By Type, 2018 to 2022

    5.5. Absolute $ Opportunity Analysis By Type, 2023 to 2033

6. Global Market Analysis 2018 to 2022 and Forecast 2023 to 2033, By Material

    6.1. Introduction / Key Findings

    6.2. Historical Market Size Value (US$ Million) & Volume (Units) Analysis By Material, 2018 to 2022

    6.3. Current and Future Market Size Value (US$ Million) & Volume (Units) Analysis and Forecast By Material, 2023 to 2033

        6.3.1. in Wood

        6.3.2. in Metal

        6.3.3. Others

    6.4. Y-o-Y Growth Trend Analysis By Material, 2018 to 2022

    6.5. Absolute $ Opportunity Analysis By Material, 2023 to 2033

7. Global Market Analysis 2018 to 2022 and Forecast 2023 to 2033, By Product

    7.1. Introduction / Key Findings

    7.2. Historical Market Size Value (US$ Million) & Volume (Units) Analysis By Product, 2018 to 2022

    7.3. Current and Future Market Size Value (US$ Million) & Volume (Units) Analysis and Forecast By Product, 2023 to 2033

        7.3.1. Single Door

        7.3.2. Multi Door

    7.4. Y-o-Y Growth Trend Analysis By Product, 2018 to 2022

    7.5. Absolute $ Opportunity Analysis By Product, 2023 to 2033

8. Global Market Analysis 2018 to 2022 and Forecast 2023 to 2033, By Application

    8.1. Introduction / Key Findings

    8.2. Historical Market Size Value (US$ Million) & Volume (Units) Analysis By Application, 2018 to 2022

    8.3. Current and Future Market Size Value (US$ Million) & Volume (Units) Analysis and Forecast By Application, 2023 to 2033

        8.3.1. Residential

        8.3.2. Commercial

    8.4. Y-o-Y Growth Trend Analysis By Application, 2018 to 2022

    8.5. Absolute $ Opportunity Analysis By Application, 2023 to 2033

9. Global Market Analysis 2018 to 2022 and Forecast 2023 to 2033, By Region

    9.1. Introduction

    9.2. Historical Market Size Value (US$ Million) & Volume (Units) Analysis By Region, 2018 to 2022

    9.3. Current Market Size Value (US$ Million) & Volume (Units) Analysis and Forecast By Region, 2023 to 2033

        9.3.1. North America Market

        9.3.2. Latin America Market

        9.3.3. Europe Market

        9.3.4. Asia Pacific Market

        9.3.5. Middle East and Africa(MEA) Market

    9.4. Market Attractiveness Analysis By Region

10. North America Market Analysis 2018 to 2022 and Forecast 2023 to 2033, By Country

    10.1. Historical Market Size Value (US$ Million) & Volume (Units) Trend Analysis By Market Taxonomy, 2018 to 2022

    10.2. Market Size Value (US$ Million) & Volume (Units) Forecast By Market Taxonomy, 2023 to 2033

        10.2.1. By Country

            10.2.1.1. USA

            10.2.1.2. Canada

        10.2.2. By Type

        10.2.3. By Material

        10.2.4. By Product

        10.2.5. By Application

    10.3. Market Attractiveness Analysis

        10.3.1. By Country

        10.3.2. By Type

        10.3.3. By Material

        10.3.4. By Product

        10.3.5. By Application

    10.4. Key Takeaways

11. Latin America Market Analysis 2018 to 2022 and Forecast 2023 to 2033, By Country

    11.1. Historical Market Size Value (US$ Million) & Volume (Units) Trend Analysis By Market Taxonomy, 2018 to 2022

    11.2. Market Size Value (US$ Million) & Volume (Units) Forecast By Market Taxonomy, 2023 to 2033

        11.2.1. By Country

            11.2.1.1. Brazil

            11.2.1.2. Mexico

            11.2.1.3. Rest of Latin America

        11.2.2. By Type

        11.2.3. By Material

        11.2.4. By Product

        11.2.5. By Application

    11.3. Market Attractiveness Analysis

        11.3.1. By Country

        11.3.2. By Type

        11.3.3. By Material

        11.3.4. By Product

        11.3.5. By Application

    11.4. Key Takeaways

12. Europe Market Analysis 2018 to 2022 and Forecast 2023 to 2033, By Country

    12.1. Historical Market Size Value (US$ Million) & Volume (Units) Trend Analysis By Market Taxonomy, 2018 to 2022

    12.2. Market Size Value (US$ Million) & Volume (Units) Forecast By Market Taxonomy, 2023 to 2033

        12.2.1. By Country

            12.2.1.1. Germany

            12.2.1.2. United Kingdom

            12.2.1.3. France

            12.2.1.4. Spain

            12.2.1.5. Italy

            12.2.1.6. Rest of Europe

        12.2.2. By Type

        12.2.3. By Material

        12.2.4. By Product

        12.2.5. By Application

    12.3. Market Attractiveness Analysis

        12.3.1. By Country

        12.3.2. By Type

        12.3.3. By Material

        12.3.4. By Product

        12.3.5. By Application

    12.4. Key Takeaways

13. Asia Pacific Market Analysis 2018 to 2022 and Forecast 2023 to 2033, By Country

    13.1. Historical Market Size Value (US$ Million) & Volume (Units) Trend Analysis By Market Taxonomy, 2018 to 2022

    13.2. Market Size Value (US$ Million) & Volume (Units) Forecast By Market Taxonomy, 2023 to 2033

        13.2.1. By Country

            13.2.1.1. China

            13.2.1.2. Japan

            13.2.1.3. South Korea

            13.2.1.4. Singapore

            13.2.1.5. Thailand

            13.2.1.6. Indonesia

            13.2.1.7. Australia

            13.2.1.8. New Zealand

            13.2.1.9. Rest of Asia Pacific

        13.2.2. By Type

        13.2.3. By Material

        13.2.4. By Product

        13.2.5. By Application

    13.3. Market Attractiveness Analysis

        13.3.1. By Country

        13.3.2. By Type

        13.3.3. By Material

        13.3.4. By Product

        13.3.5. By Application

    13.4. Key Takeaways

14. MEA Market Analysis 2018 to 2022 and Forecast 2023 to 2033, By Country

    14.1. Historical Market Size Value (US$ Million) & Volume (Units) Trend Analysis By Market Taxonomy, 2018 to 2022

    14.2. Market Size Value (US$ Million) & Volume (Units) Forecast By Market Taxonomy, 2023 to 2033

        14.2.1. By Country

            14.2.1.1. GCC Countries

            14.2.1.2. South Africa

            14.2.1.3. Israel

            14.2.1.4. Rest of Middle East and Africa(MEA)

        14.2.2. By Type

        14.2.3. By Material

        14.2.4. By Product

        14.2.5. By Application

    14.3. Market Attractiveness Analysis

        14.3.1. By Country

        14.3.2. By Type

        14.3.3. By Material

        14.3.4. By Product

        14.3.5. By Application

    14.4. Key Takeaways

15. Key Countries Market Analysis

    15.1. USA

        15.1.1. Pricing Analysis

        15.1.2. Market Share Analysis, 2022

            15.1.2.1. By Type

            15.1.2.2. By Material

            15.1.2.3. By Product

            15.1.2.4. By Application

    15.2. Canada

        15.2.1. Pricing Analysis

        15.2.2. Market Share Analysis, 2022

            15.2.2.1. By Type

            15.2.2.2. By Material

            15.2.2.3. By Product

            15.2.2.4. By Application

    15.3. Brazil

        15.3.1. Pricing Analysis

        15.3.2. Market Share Analysis, 2022

            15.3.2.1. By Type

            15.3.2.2. By Material

            15.3.2.3. By Product

            15.3.2.4. By Application

    15.4. Mexico

        15.4.1. Pricing Analysis

        15.4.2. Market Share Analysis, 2022

            15.4.2.1. By Type

            15.4.2.2. By Material

            15.4.2.3. By Product

            15.4.2.4. By Application

    15.5. Germany

        15.5.1. Pricing Analysis

        15.5.2. Market Share Analysis, 2022

            15.5.2.1. By Type

            15.5.2.2. By Material

            15.5.2.3. By Product

            15.5.2.4. By Application

    15.6. United Kingdom

        15.6.1. Pricing Analysis

        15.6.2. Market Share Analysis, 2022

            15.6.2.1. By Type

            15.6.2.2. By Material

            15.6.2.3. By Product

            15.6.2.4. By Application

    15.7. France

        15.7.1. Pricing Analysis

        15.7.2. Market Share Analysis, 2022

            15.7.2.1. By Type

            15.7.2.2. By Material

            15.7.2.3. By Product

            15.7.2.4. By Application

    15.8. Spain

        15.8.1. Pricing Analysis

        15.8.2. Market Share Analysis, 2022

            15.8.2.1. By Type

            15.8.2.2. By Material

            15.8.2.3. By Product

            15.8.2.4. By Application

    15.9. Italy

        15.9.1. Pricing Analysis

        15.9.2. Market Share Analysis, 2022

            15.9.2.1. By Type

            15.9.2.2. By Material

            15.9.2.3. By Product

            15.9.2.4. By Application

    15.10. China

        15.10.1. Pricing Analysis

        15.10.2. Market Share Analysis, 2022

            15.10.2.1. By Type

            15.10.2.2. By Material

            15.10.2.3. By Product

            15.10.2.4. By Application

    15.11. Japan

        15.11.1. Pricing Analysis

        15.11.2. Market Share Analysis, 2022

            15.11.2.1. By Type

            15.11.2.2. By Material

            15.11.2.3. By Product

            15.11.2.4. By Application

    15.12. South Korea

        15.12.1. Pricing Analysis

        15.12.2. Market Share Analysis, 2022

            15.12.2.1. By Type

            15.12.2.2. By Material

            15.12.2.3. By Product

            15.12.2.4. By Application

    15.13. Singapore

        15.13.1. Pricing Analysis

        15.13.2. Market Share Analysis, 2022

            15.13.2.1. By Type

            15.13.2.2. By Material

            15.13.2.3. By Product

            15.13.2.4. By Application

    15.14. Thailand

        15.14.1. Pricing Analysis

        15.14.2. Market Share Analysis, 2022

            15.14.2.1. By Type

            15.14.2.2. By Material

            15.14.2.3. By Product

            15.14.2.4. By Application

    15.15. Indonesia

        15.15.1. Pricing Analysis

        15.15.2. Market Share Analysis, 2022

            15.15.2.1. By Type

            15.15.2.2. By Material

            15.15.2.3. By Product

            15.15.2.4. By Application

    15.16. Australia

        15.16.1. Pricing Analysis

        15.16.2. Market Share Analysis, 2022

            15.16.2.1. By Type

            15.16.2.2. By Material

            15.16.2.3. By Product

            15.16.2.4. By Application

    15.17. New Zealand

        15.17.1. Pricing Analysis

        15.17.2. Market Share Analysis, 2022

            15.17.2.1. By Type

            15.17.2.2. By Material

            15.17.2.3. By Product

            15.17.2.4. By Application

    15.18. GCC Countries

        15.18.1. Pricing Analysis

        15.18.2. Market Share Analysis, 2022

            15.18.2.1. By Type

            15.18.2.2. By Material

            15.18.2.3. By Product

            15.18.2.4. By Application

    15.19. South Africa

        15.19.1. Pricing Analysis

        15.19.2. Market Share Analysis, 2022

            15.19.2.1. By Type

            15.19.2.2. By Material

            15.19.2.3. By Product

            15.19.2.4. By Application

    15.20. Israel

        15.20.1. Pricing Analysis

        15.20.2. Market Share Analysis, 2022

            15.20.2.1. By Type

            15.20.2.2. By Material

            15.20.2.3. By Product

            15.20.2.4. By Application

16. Market Structure Analysis

    16.1. Competition Dashboard

    16.2. Competition Benchmarking

    16.3. Market Share Analysis of Top Players

        16.3.1. By Regional

        16.3.2. By Type

        16.3.3. By Material

        16.3.4. By Product

        16.3.5. By Application

17. Competition Analysis

    17.1. Competition Deep Dive

        17.1.1. Geberit AG

            17.1.1.1. Overview

            17.1.1.2. Product Portfolio

            17.1.1.3. Profitability by Market Segments

            17.1.1.4. Sales Footprint

            17.1.1.5. Strategy Overview

                17.1.1.5.1. Marketing Strategy

                17.1.1.5.2. Product Strategy

                17.1.1.5.3. Channel Strategy

        17.1.2. Roca Sanitario, S.A

            17.1.2.1. Overview

            17.1.2.2. Product Portfolio

            17.1.2.3. Profitability by Market Segments

            17.1.2.4. Sales Footprint

            17.1.2.5. Strategy Overview

                17.1.2.5.1. Marketing Strategy

                17.1.2.5.2. Product Strategy

                17.1.2.5.3. Channel Strategy

        17.1.3. Nilkamal Limited

            17.1.3.1. Overview

            17.1.3.2. Product Portfolio

            17.1.3.3. Profitability by Market Segments

            17.1.3.4. Sales Footprint

            17.1.3.5. Strategy Overview

                17.1.3.5.1. Marketing Strategy

                17.1.3.5.2. Product Strategy

                17.1.3.5.3. Channel Strategy

        17.1.4. Duravit AG

            17.1.4.1. Overview

            17.1.4.2. Product Portfolio

            17.1.4.3. Profitability by Market Segments

            17.1.4.4. Sales Footprint

            17.1.4.5. Strategy Overview

                17.1.4.5.1. Marketing Strategy

                17.1.4.5.2. Product Strategy

                17.1.4.5.3. Channel Strategy

        17.1.5. Laufen Bathrooms AG

            17.1.5.1. Overview

            17.1.5.2. Product Portfolio

            17.1.5.3. Profitability by Market Segments

            17.1.5.4. Sales Footprint

            17.1.5.5. Strategy Overview

                17.1.5.5.1. Marketing Strategy

                17.1.5.5.2. Product Strategy

                17.1.5.5.3. Channel Strategy

        17.1.6. W. Schneider+Co AG

            17.1.6.1. Overview

            17.1.6.2. Product Portfolio

            17.1.6.3. Profitability by Market Segments

            17.1.6.4. Sales Footprint

            17.1.6.5. Strategy Overview

                17.1.6.5.1. Marketing Strategy

                17.1.6.5.2. Product Strategy

                17.1.6.5.3. Channel Strategy

        17.1.7. HiB

            17.1.7.1. Overview

            17.1.7.2. Product Portfolio

            17.1.7.3. Profitability by Market Segments

            17.1.7.4. Sales Footprint

            17.1.7.5. Strategy Overview

                17.1.7.5.1. Marketing Strategy

                17.1.7.5.2. Product Strategy

                17.1.7.5.3. Channel Strategy

        17.1.8. Emco Group

            17.1.8.1. Overview

            17.1.8.2. Product Portfolio

            17.1.8.3. Profitability by Market Segments

            17.1.8.4. Sales Footprint

            17.1.8.5. Strategy Overview

                17.1.8.5.1. Marketing Strategy

                17.1.8.5.2. Product Strategy

                17.1.8.5.3. Channel Strategy

        17.1.9. Roper Rhodes Ltd

            17.1.9.1. Overview

            17.1.9.2. Product Portfolio

            17.1.9.3. Profitability by Market Segments

            17.1.9.4. Sales Footprint

            17.1.9.5. Strategy Overview

                17.1.9.5.1. Marketing Strategy

                17.1.9.5.2. Product Strategy

                17.1.9.5.3. Channel Strategy

        17.1.10. FAB Glass

            17.1.10.1. Overview

            17.1.10.2. Product Portfolio

            17.1.10.3. Profitability by Market Segments

            17.1.10.4. Sales Footprint

            17.1.10.5. Strategy Overview

                17.1.10.5.1. Marketing Strategy

                17.1.10.5.2. Product Strategy

                17.1.10.5.3. Channel Strategy

        17.1.11. VitrA Bathrooms

            17.1.11.1. Overview

            17.1.11.2. Product Portfolio

            17.1.11.3. Profitability by Market Segments

            17.1.11.4. Sales Footprint

            17.1.11.5. Strategy Overview

                17.1.11.5.1. Marketing Strategy

                17.1.11.5.2. Product Strategy

                17.1.11.5.3. Channel Strategy

        17.1.12. The Cabinet World

            17.1.12.1. Overview

            17.1.12.2. Product Portfolio

            17.1.12.3. Profitability by Market Segments

            17.1.12.4. Sales Footprint

            17.1.12.5. Strategy Overview

                17.1.12.5.1. Marketing Strategy

                17.1.12.5.2. Product Strategy

                17.1.12.5.3. Channel Strategy

        17.1.13. Cabinet Core

            17.1.13.1. Overview

            17.1.13.2. Product Portfolio

            17.1.13.3. Profitability by Market Segments

            17.1.13.4. Sales Footprint

            17.1.13.5. Strategy Overview

                17.1.13.5.1. Marketing Strategy

                17.1.13.5.2. Product Strategy

                17.1.13.5.3. Channel Strategy

        17.1.14. Sihe.com

            17.1.14.1. Overview

            17.1.14.2. Product Portfolio

            17.1.14.3. Profitability by Market Segments

            17.1.14.4. Sales Footprint

            17.1.14.5. Strategy Overview

                17.1.14.5.1. Marketing Strategy

                17.1.14.5.2. Product Strategy

                17.1.14.5.3. Channel Strategy

18. Assumptions & Acronyms Used

19. Research Methodology

List of Tables

Table 1: Global Market Value (US$ Million) Forecast by Region, 2018 to 2033

Table 2: Global Market Volume (Units) Forecast by Region, 2018 to 2033

Table 3: Global Market Value (US$ Million) Forecast by Type, 2018 to 2033

Table 4: Global Market Volume (Units) Forecast by Type, 2018 to 2033

Table 5: Global Market Value (US$ Million) Forecast by Material, 2018 to 2033

Table 6: Global Market Volume (Units) Forecast by Material, 2018 to 2033

Table 7: Global Market Value (US$ Million) Forecast by Product, 2018 to 2033

Table 8: Global Market Volume (Units) Forecast by Product, 2018 to 2033

Table 9: Global Market Value (US$ Million) Forecast by Application, 2018 to 2033

Table 10: Global Market Volume (Units) Forecast by Application, 2018 to 2033

Table 11: North America Market Value (US$ Million) Forecast by Country, 2018 to 2033

Table 12: North America Market Volume (Units) Forecast by Country, 2018 to 2033

Table 13: North America Market Value (US$ Million) Forecast by Type, 2018 to 2033

Table 14: North America Market Volume (Units) Forecast by Type, 2018 to 2033

Table 15: North America Market Value (US$ Million) Forecast by Material, 2018 to 2033

Table 16: North America Market Volume (Units) Forecast by Material, 2018 to 2033

Table 17: North America Market Value (US$ Million) Forecast by Product, 2018 to 2033

Table 18: North America Market Volume (Units) Forecast by Product, 2018 to 2033

Table 19: North America Market Value (US$ Million) Forecast by Application, 2018 to 2033

Table 20: North America Market Volume (Units) Forecast by Application, 2018 to 2033

Table 21: Latin America Market Value (US$ Million) Forecast by Country, 2018 to 2033

Table 22: Latin America Market Volume (Units) Forecast by Country, 2018 to 2033

Table 23: Latin America Market Value (US$ Million) Forecast by Type, 2018 to 2033

Table 24: Latin America Market Volume (Units) Forecast by Type, 2018 to 2033

Table 25: Latin America Market Value (US$ Million) Forecast by Material, 2018 to 2033

Table 26: Latin America Market Volume (Units) Forecast by Material, 2018 to 2033

Table 27: Latin America Market Value (US$ Million) Forecast by Product, 2018 to 2033

Table 28: Latin America Market Volume (Units) Forecast by Product, 2018 to 2033

Table 29: Latin America Market Value (US$ Million) Forecast by Application, 2018 to 2033

Table 30: Latin America Market Volume (Units) Forecast by Application, 2018 to 2033

Table 31: Europe Market Value (US$ Million) Forecast by Country, 2018 to 2033

Table 32: Europe Market Volume (Units) Forecast by Country, 2018 to 2033

Table 33: Europe Market Value (US$ Million) Forecast by Type, 2018 to 2033

Table 34: Europe Market Volume (Units) Forecast by Type, 2018 to 2033

Table 35: Europe Market Value (US$ Million) Forecast by Material, 2018 to 2033

Table 36: Europe Market Volume (Units) Forecast by Material, 2018 to 2033

Table 37: Europe Market Value (US$ Million) Forecast by Product, 2018 to 2033

Table 38: Europe Market Volume (Units) Forecast by Product, 2018 to 2033

Table 39: Europe Market Value (US$ Million) Forecast by Application, 2018 to 2033

Table 40: Europe Market Volume (Units) Forecast by Application, 2018 to 2033

Table 41: Asia Pacific Market Value (US$ Million) Forecast by Country, 2018 to 2033

Table 42: Asia Pacific Market Volume (Units) Forecast by Country, 2018 to 2033

Table 43: Asia Pacific Market Value (US$ Million) Forecast by Type, 2018 to 2033

Table 44: Asia Pacific Market Volume (Units) Forecast by Type, 2018 to 2033

Table 45: Asia Pacific Market Value (US$ Million) Forecast by Material, 2018 to 2033

Table 46: Asia Pacific Market Volume (Units) Forecast by Material, 2018 to 2033

Table 47: Asia Pacific Market Value (US$ Million) Forecast by Product, 2018 to 2033

Table 48: Asia Pacific Market Volume (Units) Forecast by Product, 2018 to 2033

Table 49: Asia Pacific Market Value (US$ Million) Forecast by Application, 2018 to 2033

Table 50: Asia Pacific Market Volume (Units) Forecast by Application, 2018 to 2033

Table 51: MEA Market Value (US$ Million) Forecast by Country, 2018 to 2033

Table 52: MEA Market Volume (Units) Forecast by Country, 2018 to 2033

Table 53: MEA Market Value (US$ Million) Forecast by Type, 2018 to 2033

Table 54: MEA Market Volume (Units) Forecast by Type, 2018 to 2033

Table 55: MEA Market Value (US$ Million) Forecast by Material, 2018 to 2033

Table 56: MEA Market Volume (Units) Forecast by Material, 2018 to 2033

Table 57: MEA Market Value (US$ Million) Forecast by Product, 2018 to 2033

Table 58: MEA Market Volume (Units) Forecast by Product, 2018 to 2033

Table 59: MEA Market Value (US$ Million) Forecast by Application, 2018 to 2033

Table 60: MEA Market Volume (Units) Forecast by Application, 2018 to 2033

List of Charts

Figure 1: Global Market Value (US$ Million) by Type, 2023 to 2033

Figure 2: Global Market Value (US$ Million) by Material, 2023 to 2033

Figure 3: Global Market Value (US$ Million) by Product, 2023 to 2033

Figure 4: Global Market Value (US$ Million) by Application, 2023 to 2033

Figure 5: Global Market Value (US$ Million) by Region, 2023 to 2033

Figure 6: Global Market Value (US$ Million) Analysis by Region, 2018 to 2033

Figure 7: Global Market Volume (Units) Analysis by Region, 2018 to 2033

Figure 8: Global Market Value Share (%) and BPS Analysis by Region, 2023 to 2033

Figure 9: Global Market Y-o-Y Growth (%) Projections by Region, 2023 to 2033

Figure 10: Global Market Value (US$ Million) Analysis by Type, 2018 to 2033

Figure 11: Global Market Volume (Units) Analysis by Type, 2018 to 2033

Figure 12: Global Market Value Share (%) and BPS Analysis by Type, 2023 to 2033

Figure 13: Global Market Y-o-Y Growth (%) Projections by Type, 2023 to 2033

Figure 14: Global Market Value (US$ Million) Analysis by Material, 2018 to 2033

Figure 15: Global Market Volume (Units) Analysis by Material, 2018 to 2033

Figure 16: Global Market Value Share (%) and BPS Analysis by Material, 2023 to 2033

Figure 17: Global Market Y-o-Y Growth (%) Projections by Material, 2023 to 2033

Figure 18: Global Market Value (US$ Million) Analysis by Product, 2018 to 2033

Figure 19: Global Market Volume (Units) Analysis by Product, 2018 to 2033

Figure 20: Global Market Value Share (%) and BPS Analysis by Product, 2023 to 2033

Figure 21: Global Market Y-o-Y Growth (%) Projections by Product, 2023 to 2033

Figure 22: Global Market Value (US$ Million) Analysis by Application, 2018 to 2033

Figure 23: Global Market Volume (Units) Analysis by Application, 2018 to 2033

Figure 24: Global Market Value Share (%) and BPS Analysis by Application, 2023 to 2033

Figure 25: Global Market Y-o-Y Growth (%) Projections by Application, 2023 to 2033

Figure 26: Global Market Attractiveness by Type, 2023 to 2033

Figure 27: Global Market Attractiveness by Material, 2023 to 2033

Figure 28: Global Market Attractiveness by Product, 2023 to 2033

Figure 29: Global Market Attractiveness by Application, 2023 to 2033

Figure 30: Global Market Attractiveness by Region, 2023 to 2033

Figure 31: North America Market Value (US$ Million) by Type, 2023 to 2033

Figure 32: North America Market Value (US$ Million) by Material, 2023 to 2033

Figure 33: North America Market Value (US$ Million) by Product, 2023 to 2033

Figure 34: North America Market Value (US$ Million) by Application, 2023 to 2033

Figure 35: North America Market Value (US$ Million) by Country, 2023 to 2033

Figure 36: North America Market Value (US$ Million) Analysis by Country, 2018 to 2033

Figure 37: North America Market Volume (Units) Analysis by Country, 2018 to 2033

Figure 38: North America Market Value Share (%) and BPS Analysis by Country, 2023 to 2033

Figure 39: North America Market Y-o-Y Growth (%) Projections by Country, 2023 to 2033

Figure 40: North America Market Value (US$ Million) Analysis by Type, 2018 to 2033

Figure 41: North America Market Volume (Units) Analysis by Type, 2018 to 2033

Figure 42: North America Market Value Share (%) and BPS Analysis by Type, 2023 to 2033

Figure 43: North America Market Y-o-Y Growth (%) Projections by Type, 2023 to 2033

Figure 44: North America Market Value (US$ Million) Analysis by Material, 2018 to 2033

Figure 45: North America Market Volume (Units) Analysis by Material, 2018 to 2033

Figure 46: North America Market Value Share (%) and BPS Analysis by Material, 2023 to 2033

Figure 47: North America Market Y-o-Y Growth (%) Projections by Material, 2023 to 2033

Figure 48: North America Market Value (US$ Million) Analysis by Product, 2018 to 2033

Figure 49: North America Market Volume (Units) Analysis by Product, 2018 to 2033

Figure 50: North America Market Value Share (%) and BPS Analysis by Product, 2023 to 2033

Figure 51: North America Market Y-o-Y Growth (%) Projections by Product, 2023 to 2033

Figure 52: North America Market Value (US$ Million) Analysis by Application, 2018 to 2033

Figure 53: North America Market Volume (Units) Analysis by Application, 2018 to 2033

Figure 54: North America Market Value Share (%) and BPS Analysis by Application, 2023 to 2033

Figure 55: North America Market Y-o-Y Growth (%) Projections by Application, 2023 to 2033

Figure 56: North America Market Attractiveness by Type, 2023 to 2033

Figure 57: North America Market Attractiveness by Material, 2023 to 2033

Figure 58: North America Market Attractiveness by Product, 2023 to 2033

Figure 59: North America Market Attractiveness by Application, 2023 to 2033

Figure 60: North America Market Attractiveness by Country, 2023 to 2033

Figure 61: Latin America Market Value (US$ Million) by Type, 2023 to 2033

Figure 62: Latin America Market Value (US$ Million) by Material, 2023 to 2033

Figure 63: Latin America Market Value (US$ Million) by Product, 2023 to 2033

Figure 64: Latin America Market Value (US$ Million) by Application, 2023 to 2033

Figure 65: Latin America Market Value (US$ Million) by Country, 2023 to 2033

Figure 66: Latin America Market Value (US$ Million) Analysis by Country, 2018 to 2033

Figure 67: Latin America Market Volume (Units) Analysis by Country, 2018 to 2033

Figure 68: Latin America Market Value Share (%) and BPS Analysis by Country, 2023 to 2033

Figure 69: Latin America Market Y-o-Y Growth (%) Projections by Country, 2023 to 2033

Figure 70: Latin America Market Value (US$ Million) Analysis by Type, 2018 to 2033

Figure 71: Latin America Market Volume (Units) Analysis by Type, 2018 to 2033

Figure 72: Latin America Market Value Share (%) and BPS Analysis by Type, 2023 to 2033

Figure 73: Latin America Market Y-o-Y Growth (%) Projections by Type, 2023 to 2033

Figure 74: Latin America Market Value (US$ Million) Analysis by Material, 2018 to 2033

Figure 75: Latin America Market Volume (Units) Analysis by Material, 2018 to 2033

Figure 76: Latin America Market Value Share (%) and BPS Analysis by Material, 2023 to 2033

Figure 77: Latin America Market Y-o-Y Growth (%) Projections by Material, 2023 to 2033

Figure 78: Latin America Market Value (US$ Million) Analysis by Product, 2018 to 2033

Figure 79: Latin America Market Volume (Units) Analysis by Product, 2018 to 2033

Figure 80: Latin America Market Value Share (%) and BPS Analysis by Product, 2023 to 2033

Figure 81: Latin America Market Y-o-Y Growth (%) Projections by Product, 2023 to 2033

Figure 82: Latin America Market Value (US$ Million) Analysis by Application, 2018 to 2033

Figure 83: Latin America Market Volume (Units) Analysis by Application, 2018 to 2033

Figure 84: Latin America Market Value Share (%) and BPS Analysis by Application, 2023 to 2033

Figure 85: Latin America Market Y-o-Y Growth (%) Projections by Application, 2023 to 2033

Figure 86: Latin America Market Attractiveness by Type, 2023 to 2033

Figure 87: Latin America Market Attractiveness by Material, 2023 to 2033

Figure 88: Latin America Market Attractiveness by Product, 2023 to 2033

Figure 89: Latin America Market Attractiveness by Application, 2023 to 2033

Figure 90: Latin America Market Attractiveness by Country, 2023 to 2033

Figure 91: Europe Market Value (US$ Million) by Type, 2023 to 2033

Figure 92: Europe Market Value (US$ Million) by Material, 2023 to 2033

Figure 93: Europe Market Value (US$ Million) by Product, 2023 to 2033

Figure 94: Europe Market Value (US$ Million) by Application, 2023 to 2033

Figure 95: Europe Market Value (US$ Million) by Country, 2023 to 2033

Figure 96: Europe Market Value (US$ Million) Analysis by Country, 2018 to 2033

Figure 97: Europe Market Volume (Units) Analysis by Country, 2018 to 2033

Figure 98: Europe Market Value Share (%) and BPS Analysis by Country, 2023 to 2033

Figure 99: Europe Market Y-o-Y Growth (%) Projections by Country, 2023 to 2033

Figure 100: Europe Market Value (US$ Million) Analysis by Type, 2018 to 2033

Figure 101: Europe Market Volume (Units) Analysis by Type, 2018 to 2033

Figure 102: Europe Market Value Share (%) and BPS Analysis by Type, 2023 to 2033

Figure 103: Europe Market Y-o-Y Growth (%) Projections by Type, 2023 to 2033

Figure 104: Europe Market Value (US$ Million) Analysis by Material, 2018 to 2033

Figure 105: Europe Market Volume (Units) Analysis by Material, 2018 to 2033

Figure 106: Europe Market Value Share (%) and BPS Analysis by Material, 2023 to 2033

Figure 107: Europe Market Y-o-Y Growth (%) Projections by Material, 2023 to 2033

Figure 108: Europe Market Value (US$ Million) Analysis by Product, 2018 to 2033

Figure 109: Europe Market Volume (Units) Analysis by Product, 2018 to 2033

Figure 110: Europe Market Value Share (%) and BPS Analysis by Product, 2023 to 2033

Figure 111: Europe Market Y-o-Y Growth (%) Projections by Product, 2023 to 2033

Figure 112: Europe Market Value (US$ Million) Analysis by Application, 2018 to 2033

Figure 113: Europe Market Volume (Units) Analysis by Application, 2018 to 2033

Figure 114: Europe Market Value Share (%) and BPS Analysis by Application, 2023 to 2033

Figure 115: Europe Market Y-o-Y Growth (%) Projections by Application, 2023 to 2033

Figure 116: Europe Market Attractiveness by Type, 2023 to 2033

Figure 117: Europe Market Attractiveness by Material, 2023 to 2033

Figure 118: Europe Market Attractiveness by Product, 2023 to 2033

Figure 119: Europe Market Attractiveness by Application, 2023 to 2033

Figure 120: Europe Market Attractiveness by Country, 2023 to 2033

Figure 121: Asia Pacific Market Value (US$ Million) by Type, 2023 to 2033

Figure 122: Asia Pacific Market Value (US$ Million) by Material, 2023 to 2033

Figure 123: Asia Pacific Market Value (US$ Million) by Product, 2023 to 2033

Figure 124: Asia Pacific Market Value (US$ Million) by Application, 2023 to 2033

Figure 125: Asia Pacific Market Value (US$ Million) by Country, 2023 to 2033

Figure 126: Asia Pacific Market Value (US$ Million) Analysis by Country, 2018 to 2033

Figure 127: Asia Pacific Market Volume (Units) Analysis by Country, 2018 to 2033

Figure 128: Asia Pacific Market Value Share (%) and BPS Analysis by Country, 2023 to 2033

Figure 129: Asia Pacific Market Y-o-Y Growth (%) Projections by Country, 2023 to 2033

Figure 130: Asia Pacific Market Value (US$ Million) Analysis by Type, 2018 to 2033

Figure 131: Asia Pacific Market Volume (Units) Analysis by Type, 2018 to 2033

Figure 132: Asia Pacific Market Value Share (%) and BPS Analysis by Type, 2023 to 2033

Figure 133: Asia Pacific Market Y-o-Y Growth (%) Projections by Type, 2023 to 2033

Figure 134: Asia Pacific Market Value (US$ Million) Analysis by Material, 2018 to 2033

Figure 135: Asia Pacific Market Volume (Units) Analysis by Material, 2018 to 2033

Figure 136: Asia Pacific Market Value Share (%) and BPS Analysis by Material, 2023 to 2033

Figure 137: Asia Pacific Market Y-o-Y Growth (%) Projections by Material, 2023 to 2033

Figure 138: Asia Pacific Market Value (US$ Million) Analysis by Product, 2018 to 2033

Figure 139: Asia Pacific Market Volume (Units) Analysis by Product, 2018 to 2033

Figure 140: Asia Pacific Market Value Share (%) and BPS Analysis by Product, 2023 to 2033

Figure 141: Asia Pacific Market Y-o-Y Growth (%) Projections by Product, 2023 to 2033

Figure 142: Asia Pacific Market Value (US$ Million) Analysis by Application, 2018 to 2033

Figure 143: Asia Pacific Market Volume (Units) Analysis by Application, 2018 to 2033

Figure 144: Asia Pacific Market Value Share (%) and BPS Analysis by Application, 2023 to 2033

Figure 145: Asia Pacific Market Y-o-Y Growth (%) Projections by Application, 2023 to 2033

Figure 146: Asia Pacific Market Attractiveness by Type, 2023 to 2033

Figure 147: Asia Pacific Market Attractiveness by Material, 2023 to 2033

Figure 148: Asia Pacific Market Attractiveness by Product, 2023 to 2033

Figure 149: Asia Pacific Market Attractiveness by Application, 2023 to 2033

Figure 150: Asia Pacific Market Attractiveness by Country, 2023 to 2033

Figure 151: MEA Market Value (US$ Million) by Type, 2023 to 2033

Figure 152: MEA Market Value (US$ Million) by Material, 2023 to 2033

Figure 153: MEA Market Value (US$ Million) by Product, 2023 to 2033

Figure 154: MEA Market Value (US$ Million) by Application, 2023 to 2033

Figure 155: MEA Market Value (US$ Million) by Country, 2023 to 2033

Figure 156: MEA Market Value (US$ Million) Analysis by Country, 2018 to 2033

Figure 157: MEA Market Volume (Units) Analysis by Country, 2018 to 2033

Figure 158: MEA Market Value Share (%) and BPS Analysis by Country, 2023 to 2033

Figure 159: MEA Market Y-o-Y Growth (%) Projections by Country, 2023 to 2033

Figure 160: MEA Market Value (US$ Million) Analysis by Type, 2018 to 2033

Figure 161: MEA Market Volume (Units) Analysis by Type, 2018 to 2033

Figure 162: MEA Market Value Share (%) and BPS Analysis by Type, 2023 to 2033

Figure 163: MEA Market Y-o-Y Growth (%) Projections by Type, 2023 to 2033

Figure 164: MEA Market Value (US$ Million) Analysis by Material, 2018 to 2033

Figure 165: MEA Market Volume (Units) Analysis by Material, 2018 to 2033

Figure 166: MEA Market Value Share (%) and BPS Analysis by Material, 2023 to 2033

Figure 167: MEA Market Y-o-Y Growth (%) Projections by Material, 2023 to 2033

Figure 168: MEA Market Value (US$ Million) Analysis by Product, 2018 to 2033

Figure 169: MEA Market Volume (Units) Analysis by Product, 2018 to 2033

Figure 170: MEA Market Value Share (%) and BPS Analysis by Product, 2023 to 2033

Figure 171: MEA Market Y-o-Y Growth (%) Projections by Product, 2023 to 2033

Figure 172: MEA Market Value (US$ Million) Analysis by Application, 2018 to 2033

Figure 173: MEA Market Volume (Units) Analysis by Application, 2018 to 2033

Figure 174: MEA Market Value Share (%) and BPS Analysis by Application, 2023 to 2033

Figure 175: MEA Market Y-o-Y Growth (%) Projections by Application, 2023 to 2033

Figure 176: MEA Market Attractiveness by Type, 2023 to 2033

Figure 177: MEA Market Attractiveness by Material, 2023 to 2033

Figure 178: MEA Market Attractiveness by Product, 2023 to 2033

Figure 179: MEA Market Attractiveness by Application, 2023 to 2033

Figure 180: MEA Market Attractiveness by Country, 2023 to 2033

Recommendations

Consumer Product

Bathroom Worktops Market

Published : April 2023

Consumer Product

Bathroom Mirror Wiper Market

Published : October 2021

Explore Consumer Product Insights

View Reports