Bay Leaf Market Size and Share Forecast Outlook 2025 to 2035

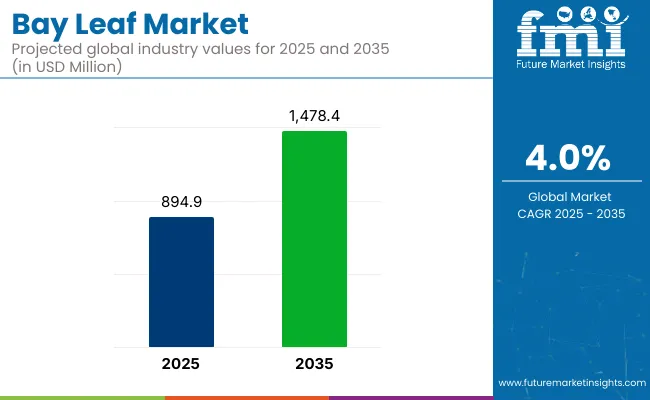
The bay leaf market is projected to reach a valuation of USD 894.9 million in 2025, advancing toward an estimated USD 1,478.4 million by 2035. This represents a steady compound annual growth rate of 4.0% over the forecast period.
Quick Stats of Bay Leaf Market

  • Market Value (2025): USD 894.9 million
  • Forecast Value (2035): USD 1,478.4 million
  • Forecast CAGR (2025 to 2035): 4.0%
  • Leading Segment in 2025: Food (76.4% share)
  • Key Growth Region: Asia Pacific (India is the fastest growing market with 5.2% CAGR)
  • Key Players: Gourmet Foods Inc., Spice World USA, Alpina Organic Company, Badia Spices, McCormick & Company, Inc., Anatoli Spices, Frontier Natural Products Co-op, Sultar Ltd, Mars Incorporated, Zizira.

Bay Leaf Market

Metric Value
Industry Size (2025E) USD 894.9 million
Industry Value (2035F) USD 1,478.4 million
CAGR (2025 to 2035) 4.0%

The market has expanded from a value of USD 827.3 million in 2023, supported by consistent global demand for aromatic herbs used in cooking and traditional wellness practices. As of 2023, a consolidated 63% of global consumption was concentrated in the United States, Germany, Japan, and Australia, reflecting strong uptake in OECD economies with mature culinary and natural remedy traditions.

With rising attention to natural food ingredients and traceable sourcing, commercial bay leaf plantations are expanding in suitable agro-climatic zones across North Africa, Southern Europe, and South Asia to secure supply continuity.

The industry accounts for an estimated 3.1% share within the broader herbs and spices category, which remains its primary parent segment. Within the seasonings and condiments market, its contribution is smaller at approximately 1.8%, due to the dominance of salt, pepper, and blended seasonings.

In the food and beverage ingredients domain, bay leaf accounts for nearly 0.7%, largely driven by its niche role in culinary and processed food formulations. In the botanical extracts market, bay leaf contributes about 1.2%, supported by essential oil applications. Its share in the nutraceutical ingredients segment stands near 0.5%, where use is limited to traditional digestive remedies.

Driving the market forward is the growing premiumization of spices and herbs, coupled with shifting consumer awareness toward regionally sourced and chemical-free plant ingredients. In developed markets, demand has been supported by ethnic cuisine proliferation and a resurgence of homemade cooking, where bay leaves are essential in traditional recipes from Mediterranean, Indian, and Latin American cultures.

In parallel, developing regions are witnessing a formalization of spice trade channels, where improved drying, processing, and certification practices are boosting export readiness. Bay leaf’s multifunctional profile, aromatic, therapeutic, and preservative, continues to expand its footprint beyond seasoning aisles into nutraceuticals, cosmeceuticals, and aromatherapy-based personal care products.

Analysis of Bay Leaf Market by Top Investment Segments 

Bay Laurel remains the most widely used bay leaf type due to its processing efficiency, aromatic profile, and adaptability in global cuisines. Food applications continue to drive demand, reinforced by the herb’s integration into processed meals and spice blends. The food and beverage industry leads usage, while healthcare and consumer goods applications expand gradually through herbal remedies and aromatherapy products.

Bay Laurel Segment Dominates the Bay Leaf Product Type Landscape

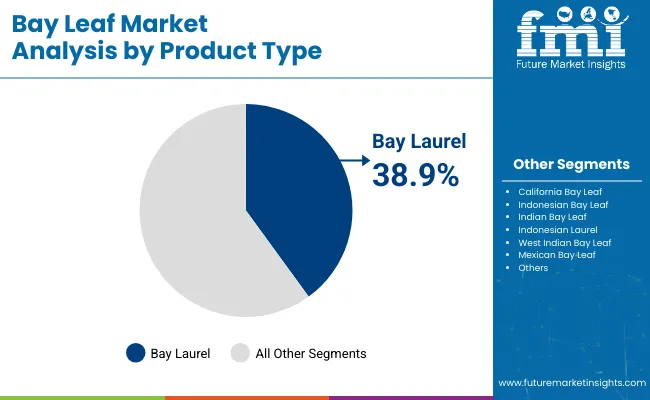
Bay Laurel is expected to maintain its leading position in the market in 2025, accounting for an estimated 38.9% market share. This slight gain reflects continued demand in both consumer and industrial culinary applications, supported by stable harvests from Mediterranean-producing countries.
  • Essential oil concentration and consistent flavor profile make it a preferred ingredient in soups, sauces, and ready-to-eat meal preparations.
  • The variety’s compatibility with modern processing methods and long shelf life further enhances its value in export-driven markets.
  • While Indian and California product will see modest growth in domestic segments, their global presence will remain comparatively smaller due to restricted cultivation zones and variation in flavor intensity, limiting broader adoption across standardized food formulations.

Bay Leaf Market By Product Type

Food Applications Lead Due to Culinary Integration and Processing Versatility

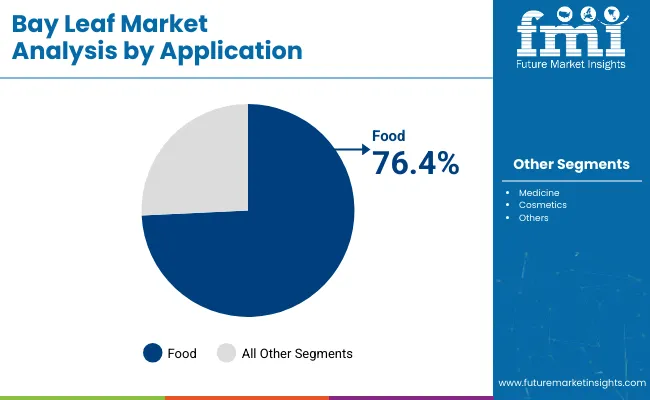
Food applications are projected to register the dominant share of the market in 2025, accounting for 76.4% of global revenue. This continued lead is driven by strong demand across culinary traditions in Europe, Asia, and Latin America, where bay leaves are integrated into soups, sauces, stews, and spice blends.
  • Processed food manufacturers also favor bay leaves for their preservative properties and natural flavor enhancement.
  • The expansion of packaged ethnic meals and home-cooking trends in OECD countries further reinforces its food sector relevance.
  • Medical and cosmetic uses will contribute a combined 23.6%, led by herbal remedy formulations, essential oils, and niche skincare products, though these remain secondary to food-based consumption due to regulatory restrictions and limited clinical standardization.

Bay Leaf Market By Application

Food and Beverage Sector Dominates with Processing Demand Growth

The food and beverage industry is estimated to account for 72.8% of usage in 2025, making it the dominant segment by usage industry. Its widespread integration into flavoring agents, spice mixes, and ready-to-eat meal formulations supports consistent demand across both retail and foodservice channels.

  • Regional cuisine trends, particularly in BRICS and ASEAN nations, continue to fuel consumption in packaged foods and culinary preparations. Healthcare applications are expected to contribute around 17.5%, driven by increased interest in plant-based remedies and inclusion in herbal pharmacopeia.
  • Consumer goods, primarily in aromatherapy, home care, and personal care product lines, will represent the remaining 9.7%, where oil and extract are used for fragrance and therapeutic positioning.
  • Regulatory clarity and rising consumer familiarity with natural ingredient claims are expected to support gradual expansion in these non-food segments.

Top Bay Leaf Market Dynamics

Bay leaf trade is being reshaped by sourcing disruptions and rising compliance demands, prompting diversification into new growing regions. Its use as a functional ingredient is expanding, with clean-label positioning and traceable sourcing gaining traction in retail and nutraceutical channels.

Export Trade Shifts and Sourcing Pressures

Export-oriented product supply chains have undergone structural shifts as traditional sourcing zones like Turkey and India face climatic volatility and phytosanitary scrutiny. In response, secondary producers in North Africa and Southeast Europe are expanding controlled cultivation.

Supply reliability is being prioritized by global distributors, particularly in the USA and EU, where demand depends on year-round consistency and certification. These changes are prompting price adjustments and longer lead times across import-heavy markets, particularly for Bay Laurel and Indian, influencing procurement cycles for bulk buyers and food processors.

  • Rising phytosanitary enforcement alters cross-border movement
  • New producing regions emerging for risk diversification
  • Longer procurement cycles driven by seasonal variability

Functional Ingredient Use and Retail Labeling Impact

Bay leaf’s repositioning as a functional botanical is shaping new product development in the nutraceutical and premium grocery segments. Demand is shifting beyond traditional seasoning, with essential oil derivatives and powdered extracts entering herbal teas, detox formulas, and clean-label soups. This diversification aligns with retailer interest in promoting natural origin and therapeutic positioning.

Labeling strategies now emphasize wild-harvested, pesticide-free, and traceable product ingredients, which influence consumer perception and shelf space allocation. Premiumization and differentiation through ingredient sourcing are becoming critical, especially in OECD and BRICS retail channels.
  • Functional claims reshape positioning in wellness product categories
  • Clean-label emphasis boosts traceability and ingredient sourcing
  • Retailer pressure increases for botanical origin transparency

Top Countries Cultivating, Processing, and Exporting Bay Leaf Products

Country Wise Analysis Of Bay Leaf Market

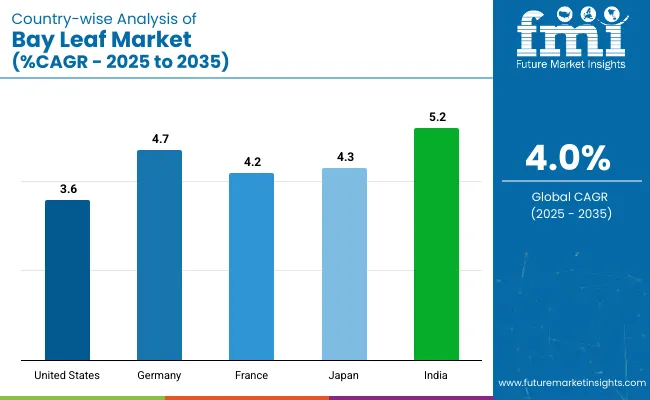
The report covers a detailed analysis of 40+ countries and the top five countries have been shared as a reference.

Countries CAGR (2025 to 2035)
United States 3.6%
Germany 4.7%
France 4.2%
Japan 4.3%
India 5.2%

Global demand for products is projected to expand at a 4.0% CAGR from 2025 to 2035. India, a BRICS economy, exceeds the baseline with 5.7% growth, driven by robust domestic consumption, regional culinary integration, and expansion in value-added exports like powdered blends and oil extracts. Commercial cultivation is rising in Himachal Pradesh and parts of Uttarakhand, with contract farming supporting consistency in leaf grade and moisture control.

Turkey, bridging OECD and emerging trade corridors, grows at 4.3%, supplying nearly 35% of dried laurel exports to Europe. Its lead position reflects established drying infrastructure, EU-compliant residue standards, and strong port logistics near Izmir and Mersin. Vietnam and Indonesia, part of ASEAN, maintain 3.9% and 3.7% CAGR, just under the global average.

Both are scaling up supply through agroforestry integration and targeting Middle Eastern spice exporters. The United States shows slower expansion at 2.8%, constrained by limited domestic cultivation and reliance on imports for ethnic food categories.

Bay Leaf Market Demand Expansion Trends in the United States

The USA bay leaf market is estimated to grow at 3.6% CAGR during the forecast period.Demand in the United States continues to be influenced by ethnic cuisine penetration, particularly Mediterranean, Indian, and Latin American recipes that rely on bay leaf flavor profiles. The proliferation of packaged meal kits and seasoning blends in retail aisles has elevated demand consistency throughout the year.

Wellness-driven consumers are incorporating product into infusions and at-home herbal remedies. Foodservice operators are also sourcing higher-grade bay laurel leaves for use in sauces, stocks, and slow-cooked preparations. Increased regulatory oversight on dried spice imports has prompted importers to prioritize origin-traced, residue-free leaf batches, boosting sourcing from certified exporters.

  • Meal kit and spice blend manufacturers drive repeat usage
  • Growing interest in DIY herbal teas and infusions
  • Importers prioritize certified and low-residue leaf sourcing

Bay Leaf Market Development Landscape and Drivers in Germany

The Germany bay leaf market is projected to expand at a 4.7% CAGR through 2035.Germany’s consistent demand for culinary herbs stems from its structured processed food industry and increasing consumer reliance on flavor-rich, preservative-free ingredients. Bay laurel is favored in traditional stews, meat broths, and pickling recipes across German households and institutional kitchens.

The health food sector is also adopting product as a digestive-support botanical in herbal mixtures and natural remedies. Regulatory clarity under EU food safety norms has led to strong importer partnerships with Mediterranean and Balkan growers, ensuring quality and traceability. Germany’s organic food market also provides new opportunities for wild-harvested or pesticide-free bay leaves certified under EU organic guidelines.

  • Traditional culinary uses maintain relevance in domestic cooking
  • Botanical applications increase in functional herbal products
  • Organic retail growth boosts demand for certified bay leaves

Consumption Forecast of Bay Leaf Market Across Japan’s Culinary Sector

The Japan bay leaf market is forecast to grow at 4.3% CAGR between 2025 and 2035.In Japan, steady expansion of the bay leaf market is being driven by demand across premium ready-meals, gourmet sauces, and culinary seasoning sachets. Japanese food processors value bay leaf’s aroma-retention properties during thermal processing, making it a staple in shelf-stable products.

Home cooking trends among older consumers and increased interest in Mediterranean diets have also contributed to retail uptake. A separate demand stream comes from wellness brands blending product into kampo-style formulations. Japanese importers focus on low-moisture, high-oil content bay laurel from European sources, meeting domestic quality thresholds set by health and food safety agencies.

  • High-aroma retention makes it ideal for premium processing
  • Mediterranean diet adoption encourages consumer-level usage
  • Imports focused on quality-certified and moisture-controlled variants

In-Depth Overview of Bay Leaf Market Performance in India

The India bay leaf market is anticipated to grow at 5.2% CAGR over the forecast period.India represents both a high-demand and high-supply market for bay leaves, particularly the Indian bay leaf (Tej Patta) variety. Domestic demand continues to grow due to its essential role in regional cooking traditions across North India. Its usage spans biryanis, lentil dishes, and spice blends.

India’s rising processed food exports also contribute to institutional demand for dried bay leaves with long shelf life. On the production side, states like Uttarakhand and Himachal Pradesh are scaling semi-organic product cultivation, driven by rising prices and export potential. Demand from wellness companies using Indian product extract in Ayurvedic digestive and immunity products also adds to consumption.

  • Integral to domestic culinary practices across diverse cuisines
  • Growing exports of spice mixes increase industrial procurement
  • Ayurvedic brands drive functional uses in digestive formulations

Prospective Assessment of Bay Leaf Utilization Patterns in France

The France bay leaf market is forecast to grow at 4.2% CAGR during the forecast period.France maintains a steady consumption of bay leaves across both culinary and herbal segments, anchored in its gastronomic tradition of using aromatic herbs in stews, pâtés, and broths.

Bay laurel is favored in “bouquet garni” herb bundles, a staple in French kitchens and foodservice operations. Artisanal food producers and gourmet retailers emphasize the use of Mediterranean-sourced bay leaves for their aromatic depth and traditional authenticity.

Beyond cooking, demand is expanding in the herbal infusion and wellness segments, where bay leavesare promoted for digestive support and mild detox properties. French importers prioritize high oil content and whole-leaf integrity, sourcing primarily from Southern Europe and North Africa to meet domestic quality expectations and regulatory compliance.

  • Traditional recipes like bouquet garni ensure consistent demand
  • Artisan brands promote heritage herbs in premium food offerings
  • Herbal infusions expand bay leaf’s reach into wellness retail segments

Leading Bay Leaf Suppliers

Grote Company, Hobart, and Bizerba dominate the industrial segment with high-capacity automated slicers and portioning systems, often equipped with IoT-enabled diagnostics to reduce downtime. For mid-tier users like bakeries, delis, and QSRs, brands such as Berkel, Vollrath, and KWS offer compact, ergonomic countertop units tailored for daily use.

Nemco, Estella, and Beswood cater to cloud kitchens and regional foodservice operators with cost-effective stainless-steel machines known for durability and ease of use. Doyon and Vevor are expanding in the prep segment with versatile mixers and dough-handling equipment designed for batter customization.

Edlund, Garde, and LEM Products support small-scale butchers and artisanal kitchens through manual slicers and utility tools. Omcan and other import-driven companies supply a broad range of SKUs via e-commerce, helping meet equipment needs in remote or under-served regions.

Recent Bay Leaf Industry News

In June 2025, Frontier Natural Products Co-op launched a new line of Regenerative Organic Certified® spices, which includes bay leaves. This initiative is part of their broader strategy to promote regenerative organic agriculture and support smallholder farmers in Central America, Asia, and Africa.

Report Coverage and Scope Summary

Report Attributes Details
Market Size (2025) USD 894.9 million
Projected Market Size (2035) USD 1,478.4 million
CAGR (2025 to 2035) 4.0%
Base Year for Estimation 2024
Historical Period 2020 to 2024
Projections Period 2025 to 2035
Quantitative Units USD million for value and volume in metric tons
Product Type Analyzed (Segment 1) California Bay Leaf, Bay Laurel, Indonesian Bay Leaf, Indian Bay Leaf, Indonesian Laurel, West Indian Bay Leaf, Mexican Bay Leaf.
Application Analyzed (Segment 2) Food, Medicine, and Cosmetics.
Usage Industry Analyzed (Segment 3) Healthcare, Food and Beverage, and Consumer Goods.
Regions Covered North America, Europe, Asia Pacific, Middle East & Africa, Latin America
Countries Covered United States, Canada, Germany, United Kingdom, France, Italy, Spain, China, Japan, South Korea, India, Australia, Brazil, Mexico, Argentina, Saudi Arabia, UAE, South Africa
Key Players Gourmet Foods Inc., Spice World USA, Alpina Organic Company, Badia Spices, McCormick & Company, Inc., Anatoli Spices, Frontier Natural Products Co-op, Sultar Ltd, Mars Incorporated, Zizira, Tea Haven, Darsil, Just a Little Spice, Pacific Spice Company, Inc., Laurus, Hoby Agriculture and Forest Product Co. Ltd, G2m, Mountain Rose Herbs, ALDERA.
Additional Attributes Dollar sales, share, volume growth, sourcing trends, regional demand shifts, export-import flows, consumer usage patterns, pricing benchmarks, competitor positioning, and regulatory outlook.

Key Segments

By Product Type:

  • California Bay Leaf
  • Bay Laurel
  • Indonesian Bay Leaf
  • Indian Bay Leaf
  • Indonesian Laurel
  • West Indian Bay Leaf
  • Mexican Bay Leaf

By Application:

  • Food
  • Medicine
  • Cosmetics

By Usage Industry:

  • Healthcare
  • Food and Beverage
  • Consumer Goods

By Region:

  • North America
  • Latin America
  • Europe
  • Asia Pacific
  • MEA

Table of Content

  1. Executive Summary
    • Global Market Outlook
    • Demand-side Trends
    • Supply-side Trends
    • Technology Roadmap Analysis
    • Analysis and Recommendations
  2. Market Overview
    • Market Coverage/Taxonomy
    • Market Definition/Scope/Limitations
  3. Market Background
    • Market Dynamics
      • Drivers
      • Restraints
      • Opportunity
      • Trends
    • Scenario Forecast
      • Demand in Optimistic Scenario
      • Demand in Likely Scenario
      • Demand in Conservative Scenario
    • Opportunity Map Analysis
    • Product Life Cycle Analysis
    • Supply Chain Analysis
      • Supply Side Participants and their Roles
        • Producers
        • Mid-Level Participants (Traders/ Agents/ Brokers)
        • Wholesalers and Distributors
      • Value Added and Value Created at Node in the Supply Chain
      • List of Raw Material Suppliers
      • List of Existing and Potential Buyer’s
    • Investment Feasibility Matrix
    • Value Chain Analysis
      • Profit Margin Analysis
      • Wholesalers and Distributors
      • Retailers
    • PESTLE and Porter’s Analysis
    • Regulatory Landscape
      • By Key Regions
      • By Key Countries
    • Regional Parent Market Outlook
    • Production and Consumption Statistics
    • Import and Export Statistics
  4. Global Market Analysis 2020 to 2024 and Forecast, 2025 to 2035
    • Historical Market Size Value (USD Million) & Volume in (Metric tons) Analysis, 2020 to 2024
    • Current and Future Market Size Value (USD Million) & Volume in (Metric tons) Projections, 2025 to 2035
      • Y-o-Y Growth Trend Analysis
      • Absolute $ Opportunity Analysis
  5. Global Market Pricing Analysis 2020 to 2024 and Forecast 2025 to 2035
  6. Global Market Analysis 2020 to 2024 and Forecast 2025 to 2035, By Product Type
    • Introduction/Key Findings
    • Historical Market Size Value (USD Million) & Volume in (Metric tons) Analysis By Product Type, 2020 to 2024
    • Current and Future Market Size Value (USD Million) & Volume in (Metric tons) Analysis and Forecast By Product Type, 2025 to 2035
      • California Bay Leaf
      • Bay Laurel
      • Indonesian Bay Leaf
      • Indian Bay Leaf
      • Indonesian Laurel
      • West Indian Bay Leaf
      • Mexican Bay Leaf
    • Y-o-Y Growth Trend Analysis By Product Type, 2020 to 2024
    • Absolute $ Opportunity Analysis By Product Type, 2025 to 2035
  7. Global Market Analysis 2020 to 2024 and Forecast 2025 to 2035, By Application
    • Introduction/Key Findings
    • Historical Market Size Value (USD Million) & Volume in (Metric tons) Analysis By Application, 2020 to 2024
    • Current and Future Market Size Value (USD Million) & Volume in (Metric tons) Analysis and Forecast By Application, 2025 to 2035
      • Food
      • Medicine
      • Cosmetics
    • Y-o-Y Growth Trend Analysis By Application, 2020 to 2024
    • Absolute $ Opportunity Analysis By Application, 2025 to 2035
  8. Global Market Analysis 2020 to 2024 and Forecast 2025 to 2035, By Usage Industry
    • Introduction/Key Findings
    • Historical Market Size Value (USD Million) & Volume in (Metric tons) Analysis By Usage Industry, 2020 to 2024
    • Current and Future Market Size Value (USD Million) & Volume in (Metric tons) Analysis and Forecast By Usage Industry, 2025 to 2035
      • Healthcare
      • Food and Beverage
      • Consumer Goods
    • Y-o-Y Growth Trend Analysis By Usage Industry, 2020 to 2024
    • Absolute $ Opportunity Analysis By Usage Industry, 2025 to 2035
  9. Global Market Analysis 2020 to 2024 and Forecast 2025 to 2035, By Region
    • Introduction
    • Historical Market Size Value (USD Million) & Volume in (Metric tons) Analysis By Region, 2020 to 2024
    • Current Market Size Value (USD Million) & Volume in (Metric tons) Analysis and Forecast By Region, 2025 to 2035
      • North America
      • Latin America
      • Western Europe
      • Eastern Europe
      • East Asia
      • South Asia & Pacific
      • Middle East and Africa
    • Market Attractiveness Analysis By Region
  10. North America Market Analysis 2020 to 2024 and Forecast 2025 to 2035, By Country
    • Historical Market Size Value (USD Million) & Volume in (Metric tons) Trend Analysis By Market Taxonomy, 2020 to 2024
    • Market Size Value (USD Million) & Volume in (Metric tons) Forecast By Market Taxonomy, 2025 to 2035
      • By Country
        • USA
        • Canada
        • Mexico
      • By Product Type
      • By Application
      • By Usage Industry
    • Market Attractiveness Analysis
      • By Country
      • By Product Type
      • By Application
      • By Usage Industry
    • Key Takeaways
  11. Latin America Market Analysis 2020 to 2024 and Forecast 2025 to 2035, By Country
    • Historical Market Size Value (USD Million) & Volume in (Metric tons) Trend Analysis By Market Taxonomy, 2020 to 2024
    • Market Size Value (USD Million) & Volume in (Metric tons) Forecast By Market Taxonomy, 2025 to 2035
      • By Country
        • Brazil
        • Argentina
        • Rest of LATAM
      • By Product Type
      • By Application
      • By Usage Industry
    • Market Attractiveness Analysis
      • By Country
      • By Product Type
      • By Application
      • By Usage Industry
    • Key Takeaways
  12. Western Europe Market Analysis 2020 to 2024 and Forecast 2025 to 2035, By Country
    • Historical Market Size Value (USD Million) & Volume in (Metric tons) Trend Analysis By Market Taxonomy, 2020 to 2024
    • Market Size Value (USD Million) & Volume in (Metric tons) Forecast By Market Taxonomy, 2025 to 2035
      • By Country
        • Germany
        • Italy
        • France
        • UK
        • Spain
        • BENELUX
        • Nordic
        • Rest of W.Europe
      • By Product Type
      • By Application
      • By Usage Industry
    • Market Attractiveness Analysis
      • By Country
      • By Product Type
      • By Application
      • By Usage Industry
    • Key Takeaways
  13. Eastern Europe Market Analysis 2020 to 2024 and Forecast 2025 to 2035, By Country
    • Historical Market Size Value (USD Million) & Volume in (Metric tons) Trend Analysis By Market Taxonomy, 2020 to 2024
    • Market Size Value (USD Million) & Volume in (Metric tons) Forecast By Market Taxonomy, 2025 to 2035
      • By Country
        • Russia
        • Hungary
        • Poland
        • Balkan & Baltics
        • Rest of E. Europe
      • By Product Type
      • By Application
      • By Usage Industry
    • Market Attractiveness Analysis
      • By Country
      • By Product Type
      • By Application
      • By Usage Industry
    • Key Takeaways
  14. East Asia Market Analysis 2020 to 2024 and Forecast 2025 to 2035, By Country
    • Historical Market Size Value (USD Million) & Volume in (Metric tons) Trend Analysis By Market Taxonomy, 2020 to 2024
    • Market Size Value (USD Million) & Volume in (Metric tons) Forecast By Market Taxonomy, 2025 to 2035
      • By Country
        • China
        • Japan
        • South Korea
      • By Product Type
      • By Application
      • By Usage Industry
    • Market Attractiveness Analysis
      • By Country
      • By Product Type
      • By Application
      • By Usage Industry
    • Key Takeaways
  15. South Asia & Pacific Market Analysis 2020 to 2024 and Forecast 2025 to 2035, By Country
    • Historical Market Size Value (USD Million) & Volume in (Metric tons) Trend Analysis By Market Taxonomy, 2020 to 2024
    • Market Size Value (USD Million) & Volume in (Metric tons) Forecast By Market Taxonomy, 2025 to 2035
      • By Country
        • India
        • Australia & New Zealand
        • ASEAN
        • Rest of SAP
      • By Product Type
      • By Application
      • By Usage Industry
    • Market Attractiveness Analysis
      • By Country
      • By Product Type
      • By Application
      • By Usage Industry
    • Key Takeaways
  16. Middle East and Africa Market Analysis 2020 to 2024 and Forecast 2025 to 2035, By Country
    • Historical Market Size Value (USD Million) & Volume in (Metric tons) Trend Analysis By Market Taxonomy, 2020 to 2024
    • Market Size Value (USD Million) & Volume in (Metric tons) Forecast By Market Taxonomy, 2025 to 2035
      • By Country
        • GCC Countries
        • Northern Africa
        • South Africa
        • Turkiye
        • Rest of MEA
      • By Product Type
      • By Application
      • By Usage Industry
    • Market Attractiveness Analysis
      • By Country
      • By Product Type
      • By Application
      • By Usage Industry
    • Key Takeaways
  17. Key Countries Market Analysis
    • USA
      • Pricing Analysis
      • Market Share Analysis, 2024
        • By Product Type
        • By Application
        • By Usage Industry
    • Canada
      • Pricing Analysis
      • Market Share Analysis, 2024
        • By Product Type
        • By Application
        • By Usage Industry
    • Brazil
      • Pricing Analysis
      • Market Share Analysis, 2024
        • By Product Type
        • By Application
        • By Usage Industry
    • Mexico
      • Pricing Analysis
      • Market Share Analysis, 2024
        • By Product Type
        • By Application
        • By Usage Industry
    • Argentina
      • Pricing Analysis
      • Market Share Analysis, 2024
        • By Product Type
        • By Application
        • By Usage Industry
  18. Market Structure Analysis
    • Competition Dashboard
    • Competition Benchmarking
    • Market Share Analysis of Top Players
      • By Regional
      • By Product Type
      • By Application
      • By Usage Industry
  19. Competition Analysis
    • Competition Deep Dive
      • Gourmet Foods Inc.
        • Overview
        • Product Portfolio
        • Profitability by Market Segments (Product/Age /Sales Channel/Region)
        • Sales Footprint
        • Strategy Overview
          • Marketing Strategy
          • Product Strategy
          • Channel Strategy
      • Spice World USA
        • Overview
        • Product Portfolio
        • Profitability by Market Segments (Product/Age /Sales Channel/Region)
        • Sales Footprint
        • Strategy Overview
          • Marketing Strategy
          • Product Strategy
          • Channel Strategy
      • Alpina Organic Company
        • Overview
        • Product Portfolio
        • Profitability by Market Segments (Product/Age /Sales Channel/Region)
        • Sales Footprint
        • Strategy Overview
          • Marketing Strategy
          • Product Strategy
          • Channel Strategy
      • Badia Spices
        • Overview
        • Product Portfolio
        • Profitability by Market Segments (Product/Age /Sales Channel/Region)
        • Sales Footprint
        • Strategy Overview
          • Marketing Strategy
          • Product Strategy
          • Channel Strategy
      • McCormick & Company, Inc.
        • Overview
        • Product Portfolio
        • Profitability by Market Segments (Product/Age /Sales Channel/Region)
        • Sales Footprint
        • Strategy Overview
          • Marketing Strategy
          • Product Strategy
          • Channel Strategy
      • Anatoli Spices
        • Overview
        • Product Portfolio
        • Profitability by Market Segments (Product/Age /Sales Channel/Region)
        • Sales Footprint
        • Strategy Overview
          • Marketing Strategy
          • Product Strategy
          • Channel Strategy
      • Frontier Natural Products Co-op
        • Overview
        • Product Portfolio
        • Profitability by Market Segments (Product/Age /Sales Channel/Region)
        • Sales Footprint
        • Strategy Overview
          • Marketing Strategy
          • Product Strategy
          • Channel Strategy
      • Sultar Ltd
        • Overview
        • Product Portfolio
        • Profitability by Market Segments (Product/Age /Sales Channel/Region)
        • Sales Footprint
        • Strategy Overview
          • Marketing Strategy
          • Product Strategy
          • Channel Strategy
      • Mars Incorporated
        • Overview
        • Product Portfolio
        • Profitability by Market Segments (Product/Age /Sales Channel/Region)
        • Sales Footprint
        • Strategy Overview
          • Marketing Strategy
          • Product Strategy
          • Channel Strategy
      • Zizira
        • Overview
        • Product Portfolio
        • Profitability by Market Segments (Product/Age /Sales Channel/Region)
        • Sales Footprint
        • Strategy Overview
          • Marketing Strategy
          • Product Strategy
          • Channel Strategy
      • Tea Haven
        • Overview
        • Product Portfolio
        • Profitability by Market Segments (Product/Age /Sales Channel/Region)
        • Sales Footprint
        • Strategy Overview
          • Marketing Strategy
          • Product Strategy
          • Channel Strategy
      • Darsil
        • Overview
        • Product Portfolio
        • Profitability by Market Segments (Product/Age /Sales Channel/Region)
        • Sales Footprint
        • Strategy Overview
          • Marketing Strategy
          • Product Strategy
          • Channel Strategy
      • Just a Little Spice
        • Overview
        • Product Portfolio
        • Profitability by Market Segments (Product/Age /Sales Channel/Region)
        • Sales Footprint
        • Strategy Overview
          • Marketing Strategy
          • Product Strategy
          • Channel Strategy
      • Pacific Spice Company, Inc.
        • Overview
        • Product Portfolio
        • Profitability by Market Segments (Product/Age /Sales Channel/Region)
        • Sales Footprint
        • Strategy Overview
          • Marketing Strategy
          • Product Strategy
          • Channel Strategy
      • Laurus
        • Overview
        • Product Portfolio
        • Profitability by Market Segments (Product/Age /Sales Channel/Region)
        • Sales Footprint
        • Strategy Overview
          • Marketing Strategy
          • Product Strategy
          • Channel Strategy
      • Hoby Agriculture and Forest Product Co. Ltd
        • Overview
        • Product Portfolio
        • Profitability by Market Segments (Product/Age /Sales Channel/Region)
        • Sales Footprint
        • Strategy Overview
          • Marketing Strategy
          • Product Strategy
          • Channel Strategy
      • G2m
        • Overview
        • Product Portfolio
        • Profitability by Market Segments (Product/Age /Sales Channel/Region)
        • Sales Footprint
        • Strategy Overview
          • Marketing Strategy
          • Product Strategy
          • Channel Strategy
      • Mountain Rose Herbs
        • Overview
        • Product Portfolio
        • Profitability by Market Segments (Product/Age /Sales Channel/Region)
        • Sales Footprint
        • Strategy Overview
          • Marketing Strategy
          • Product Strategy
          • Channel Strategy
      • ALDERA
        • Overview
        • Product Portfolio
        • Profitability by Market Segments (Product/Age /Sales Channel/Region)
        • Sales Footprint
        • Strategy Overview
          • Marketing Strategy
          • Product Strategy
          • Channel Strategy
  20. Assumptions & Acronyms Used
  21. Research Methodology

List of Tables

  • Table 1: Global Market Value (USD Million) Forecast by Region, 2020-2035
  • Table 2: Global Market Volume in (Metric tons) Forecast by Region, 2020-2035
  • Table 3: Global Market Value (USD Million) Forecast by Product Type, 2020-2035
  • Table 4: Global Market Volume in (Metric tons) Forecast by Product Type, 2020-2035
  • Table 5: Global Market Value (USD Million) Forecast by Application, 2020-2035
  • Table 6: Global Market Volume in (Metric tons) Forecast by Application, 2020-2035
  • Table 7: Global Market Value (USD Million) Forecast by Usage Industry, 2020-2035
  • Table 8: Global Market Volume in (Metric tons) Forecast by Usage Industry, 2020-2035
  • Table 9: North America Market Value (USD Million) Forecast by Country, 2020-2035
  • Table 10: North America Market Volume in (Metric tons) Forecast by Country, 2020-2035
  • Table 11: North America Market Value (USD Million) Forecast by Product Type, 2020-2035
  • Table 12: North America Market Volume in (Metric tons) Forecast by Product Type, 2020-2035
  • Table 13: North America Market Value (USD Million) Forecast by Application, 2020-2035
  • Table 14: North America Market Volume in (Metric tons) Forecast by Application, 2020-2035
  • Table 15: North America Market Value (USD Million) Forecast by Usage Industry, 2020-2035
  • Table 16: North America Market Volume in (Metric tons) Forecast by Usage Industry, 2020-2035
  • Table 17: Latin America Market Value (USD Million) Forecast by Country, 2020-2035
  • Table 18: Latin America Market Volume in (Metric tons) Forecast by Country, 2020-2035
  • Table 19: Latin America Market Value (USD Million) Forecast by Product Type, 2020-2035
  • Table 20: Latin America Market Volume in (Metric tons) Forecast by Product Type, 2020-2035
  • Table 21: Latin America Market Value (USD Million) Forecast by Application, 2020-2035
  • Table 22: Latin America Market Volume in (Metric tons) Forecast by Application, 2020-2035
  • Table 23: Latin America Market Value (USD Million) Forecast by Usage Industry, 2020-2035
  • Table 24: Latin America Market Volume in (Metric tons) Forecast by Usage Industry, 2020-2035
  • Table 25: Western Europe Market Value (USD Million) Forecast by Country, 2020-2035
  • Table 26: Western Europe Market Volume in (Metric tons) Forecast by Country, 2020-2035
  • Table 27: Western Europe Market Value (USD Million) Forecast by Product Type, 2020-2035
  • Table 28: Western Europe Market Volume in (Metric tons) Forecast by Product Type, 2020-2035
  • Table 29: Western Europe Market Value (USD Million) Forecast by Application, 2020-2035
  • Table 30: Western Europe Market Volume in (Metric tons) Forecast by Application, 2020-2035
  • Table 31: Western Europe Market Value (USD Million) Forecast by Usage Industry, 2020-2035
  • Table 32: Western Europe Market Volume in (Metric tons) Forecast by Usage Industry, 2020-2035
  • Table 33: Eastern Europe Market Value (USD Million) Forecast by Country, 2020-2035
  • Table 34: Eastern Europe Market Volume in (Metric tons) Forecast by Country, 2020-2035
  • Table 35: Eastern Europe Market Value (USD Million) Forecast by Product Type, 2020-2035
  • Table 36: Eastern Europe Market Volume in (Metric tons) Forecast by Product Type, 2020-2035
  • Table 37: Eastern Europe Market Value (USD Million) Forecast by Application, 2020-2035
  • Table 38: Eastern Europe Market Volume in (Metric tons) Forecast by Application, 2020-2035
  • Table 39: Eastern Europe Market Value (USD Million) Forecast by Usage Industry, 2020-2035
  • Table 40: Eastern Europe Market Volume in (Metric tons) Forecast by Usage Industry, 2020-2035
  • Table 41: East Asia Market Value (USD Million) Forecast by Country, 2020-2035
  • Table 42: East Asia Market Volume in (Metric tons) Forecast by Country, 2020-2035
  • Table 43: East Asia Market Value (USD Million) Forecast by Product Type, 2020-2035
  • Table 44: East Asia Market Volume in (Metric tons) Forecast by Product Type, 2020-2035
  • Table 45: East Asia Market Value (USD Million) Forecast by Application, 2020-2035
  • Table 46: East Asia Market Volume in (Metric tons) Forecast by Application, 2020-2035
  • Table 47: East Asia Market Value (USD Million) Forecast by Usage Industry, 2020-2035
  • Table 48: East Asia Market Volume in (Metric tons) Forecast by Usage Industry, 2020-2035
  • Table 49: South Asia & Pacific Market Value (USD Million) Forecast by Country, 2020-2035
  • Table 50: South Asia & Pacific Market Volume in (Metric tons) Forecast by Country, 2020-2035
  • Table 51: South Asia & Pacific Market Value (USD Million) Forecast by Product Type, 2020-2035
  • Table 52: South Asia & Pacific Market Volume in (Metric tons) Forecast by Product Type, 2020-2035
  • Table 53: South Asia & Pacific Market Value (USD Million) Forecast by Application, 2020-2035
  • Table 54: South Asia & Pacific Market Volume in (Metric tons) Forecast by Application, 2020-2035
  • Table 55: South Asia & Pacific Market Value (USD Million) Forecast by Usage Industry, 2020-2035
  • Table 56: South Asia & Pacific Market Volume in (Metric tons) Forecast by Usage Industry, 2020-2035
  • Table 57: Middle East and Africa Market Value (USD Million) Forecast by Country, 2020-2035
  • Table 58: Middle East and Africa Market Volume in (Metric tons) Forecast by Country, 2020-2035
  • Table 59: Middle East and Africa Market Value (USD Million) Forecast by Product Type, 2020-2035
  • Table 60: Middle East and Africa Market Volume in (Metric tons) Forecast by Product Type, 2020-2035
  • Table 61: Middle East and Africa Market Value (USD Million) Forecast by Application, 2020-2035
  • Table 62: Middle East and Africa Market Volume in (Metric tons) Forecast by Application, 2020-2035
  • Table 63: Middle East and Africa Market Value (USD Million) Forecast by Usage Industry, 2020-2035
  • Table 64: Middle East and Africa Market Volume in (Metric tons) Forecast by Usage Industry, 2020-2035

List of Figures

  • Figure 1: Global Market Volume in (Metric tons) Forecast 2020-2035
  • Figure 2: Global Market Pricing Analysis
  • Figure 3: Global Market Value (USD Million) Forecast 2020-2035
  • Figure 4: Global Market Value Share and BPS Analysis by Product Type, 2025 and 2035
  • Figure 5: Global Market Y-o-Y Growth Comparison by Product Type, 2025-2035
  • Figure 6: Global Market Attractiveness Analysis by Product Type
  • Figure 7: Global Market Value Share and BPS Analysis by Application, 2025 and 2035
  • Figure 8: Global Market Y-o-Y Growth Comparison by Application, 2025-2035
  • Figure 9: Global Market Attractiveness Analysis by Application
  • Figure 10: Global Market Value Share and BPS Analysis by Usage Industry, 2025 and 2035
  • Figure 11: Global Market Y-o-Y Growth Comparison by Usage Industry, 2025-2035
  • Figure 12: Global Market Attractiveness Analysis by Usage Industry
  • Figure 13: Global Market Value (USD Million) Share and BPS Analysis by Region, 2025 and 2035
  • Figure 14: Global Market Y-o-Y Growth Comparison by Region, 2025-2035
  • Figure 15: Global Market Attractiveness Analysis by Region
  • Figure 16: North America Market Incremental $ Opportunity, 2025-2035
  • Figure 17: Latin America Market Incremental $ Opportunity, 2025-2035
  • Figure 18: Western Europe Market Incremental $ Opportunity, 2025-2035
  • Figure 19: Eastern Europe Market Incremental $ Opportunity, 2025-2035
  • Figure 20: East Asia Market Incremental $ Opportunity, 2025-2035
  • Figure 21: South Asia & Pacific Market Incremental $ Opportunity, 2025-2035
  • Figure 22: Middle East and Africa Market Incremental $ Opportunity, 2025-2035
  • Figure 23: North America Market Value Share and BPS Analysis by Country, 2025 and 2035
  • Figure 24: North America Market Value Share and BPS Analysis by Product Type, 2025 and 2035
  • Figure 25: North America Market Y-o-Y Growth Comparison by Product Type, 2025-2035
  • Figure 26: North America Market Attractiveness Analysis by Product Type
  • Figure 27: North America Market Value Share and BPS Analysis by Application, 2025 and 2035
  • Figure 28: North America Market Y-o-Y Growth Comparison by Application, 2025-2035
  • Figure 29: North America Market Attractiveness Analysis by Application
  • Figure 30: North America Market Value Share and BPS Analysis by Usage Industry, 2025 and 2035
  • Figure 31: North America Market Y-o-Y Growth Comparison by Usage Industry, 2025-2035
  • Figure 32: North America Market Attractiveness Analysis by Usage Industry
  • Figure 33: Latin America Market Value Share and BPS Analysis by Country, 2025 and 2035
  • Figure 34: Latin America Market Value Share and BPS Analysis by Product Type, 2025 and 2035
  • Figure 35: Latin America Market Y-o-Y Growth Comparison by Product Type, 2025-2035
  • Figure 36: Latin America Market Attractiveness Analysis by Product Type
  • Figure 37: Latin America Market Value Share and BPS Analysis by Application, 2025 and 2035
  • Figure 38: Latin America Market Y-o-Y Growth Comparison by Application, 2025-2035
  • Figure 39: Latin America Market Attractiveness Analysis by Application
  • Figure 40: Latin America Market Value Share and BPS Analysis by Usage Industry, 2025 and 2035
  • Figure 41: Latin America Market Y-o-Y Growth Comparison by Usage Industry, 2025-2035
  • Figure 42: Latin America Market Attractiveness Analysis by Usage Industry
  • Figure 43: Western Europe Market Value Share and BPS Analysis by Country, 2025 and 2035
  • Figure 44: Western Europe Market Value Share and BPS Analysis by Product Type, 2025 and 2035
  • Figure 45: Western Europe Market Y-o-Y Growth Comparison by Product Type, 2025-2035
  • Figure 46: Western Europe Market Attractiveness Analysis by Product Type
  • Figure 47: Western Europe Market Value Share and BPS Analysis by Application, 2025 and 2035
  • Figure 48: Western Europe Market Y-o-Y Growth Comparison by Application, 2025-2035
  • Figure 49: Western Europe Market Attractiveness Analysis by Application
  • Figure 50: Western Europe Market Value Share and BPS Analysis by Usage Industry, 2025 and 2035
  • Figure 51: Western Europe Market Y-o-Y Growth Comparison by Usage Industry, 2025-2035
  • Figure 52: Western Europe Market Attractiveness Analysis by Usage Industry
  • Figure 53: Eastern Europe Market Value Share and BPS Analysis by Country, 2025 and 2035
  • Figure 54: Eastern Europe Market Value Share and BPS Analysis by Product Type, 2025 and 2035
  • Figure 55: Eastern Europe Market Y-o-Y Growth Comparison by Product Type, 2025-2035
  • Figure 56: Eastern Europe Market Attractiveness Analysis by Product Type
  • Figure 57: Eastern Europe Market Value Share and BPS Analysis by Application, 2025 and 2035
  • Figure 58: Eastern Europe Market Y-o-Y Growth Comparison by Application, 2025-2035
  • Figure 59: Eastern Europe Market Attractiveness Analysis by Application
  • Figure 60: Eastern Europe Market Value Share and BPS Analysis by Usage Industry, 2025 and 2035
  • Figure 61: Eastern Europe Market Y-o-Y Growth Comparison by Usage Industry, 2025-2035
  • Figure 62: Eastern Europe Market Attractiveness Analysis by Usage Industry
  • Figure 63: East Asia Market Value Share and BPS Analysis by Country, 2025 and 2035
  • Figure 64: East Asia Market Value Share and BPS Analysis by Product Type, 2025 and 2035
  • Figure 65: East Asia Market Y-o-Y Growth Comparison by Product Type, 2025-2035
  • Figure 66: East Asia Market Attractiveness Analysis by Product Type
  • Figure 67: East Asia Market Value Share and BPS Analysis by Application, 2025 and 2035
  • Figure 68: East Asia Market Y-o-Y Growth Comparison by Application, 2025-2035
  • Figure 69: East Asia Market Attractiveness Analysis by Application
  • Figure 70: East Asia Market Value Share and BPS Analysis by Usage Industry, 2025 and 2035
  • Figure 71: East Asia Market Y-o-Y Growth Comparison by Usage Industry, 2025-2035
  • Figure 72: East Asia Market Attractiveness Analysis by Usage Industry
  • Figure 73: South Asia & Pacific Market Value Share and BPS Analysis by Country, 2025 and 2035
  • Figure 74: South Asia & Pacific Market Value Share and BPS Analysis by Product Type, 2025 and 2035
  • Figure 75: South Asia & Pacific Market Y-o-Y Growth Comparison by Product Type, 2025-2035
  • Figure 76: South Asia & Pacific Market Attractiveness Analysis by Product Type
  • Figure 77: South Asia & Pacific Market Value Share and BPS Analysis by Application, 2025 and 2035
  • Figure 78: South Asia & Pacific Market Y-o-Y Growth Comparison by Application, 2025-2035
  • Figure 79: South Asia & Pacific Market Attractiveness Analysis by Application
  • Figure 80: South Asia & Pacific Market Value Share and BPS Analysis by Usage Industry, 2025 and 2035
  • Figure 81: South Asia & Pacific Market Y-o-Y Growth Comparison by Usage Industry, 2025-2035
  • Figure 82: South Asia & Pacific Market Attractiveness Analysis by Usage Industry
  • Figure 83: Middle East and Africa Market Value Share and BPS Analysis by Country, 2025 and 2035
  • Figure 84: Middle East and Africa Market Value Share and BPS Analysis by Product Type, 2025 and 2035
  • Figure 85: Middle East and Africa Market Y-o-Y Growth Comparison by Product Type, 2025-2035
  • Figure 86: Middle East and Africa Market Attractiveness Analysis by Product Type
  • Figure 87: Middle East and Africa Market Value Share and BPS Analysis by Application, 2025 and 2035
  • Figure 88: Middle East and Africa Market Y-o-Y Growth Comparison by Application, 2025-2035
  • Figure 89: Middle East and Africa Market Attractiveness Analysis by Application
  • Figure 90: Middle East and Africa Market Value Share and BPS Analysis by Usage Industry, 2025 and 2035
  • Figure 91: Middle East and Africa Market Y-o-Y Growth Comparison by Usage Industry, 2025-2035
  • Figure 92: Middle East and Africa Market Attractiveness Analysis by Usage Industry
  • Figure 93: Global Market - Tier Structure Analysis
  • Figure 94: Global Market - Company Share Analysis

Frequently Asked Questions

What is the estimated market size of the bay leaf market in 2025?

The industry is valued at USD 894.9 million in 2025.

What is the projected industry size of the bay leaf market by 2035?

It is forecasted to reach USD 1,478.4 million by 2035.

What is the expected CAGR for the bay leaf market between 2025 and 2035?

The industry is anticipated to grow at a CAGR of 4.0% during this period.

Which segment is expected to lead the bay leaf market in 2035?

Food Application are projected to lead the market with a 76.4% share in 2035.

Which region is expected to witness the highest growth in the bay leaf market?

Asia Pacific, particularly India, is expected to be the key growth region with a projected growth rate of 5.2%.

Explore Similar Insights

Future Market Insights

Bay Leaf Market