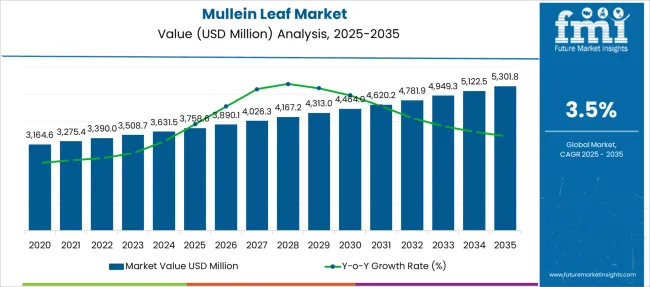
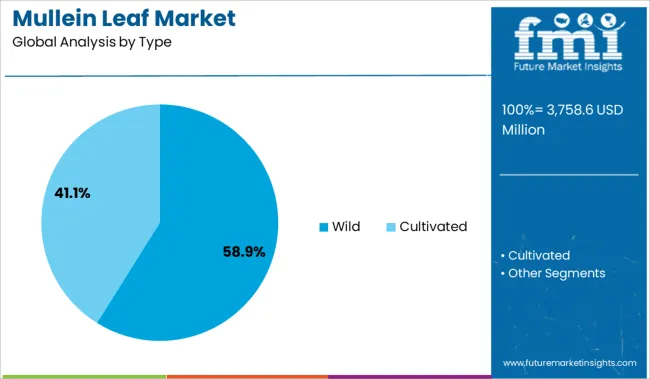
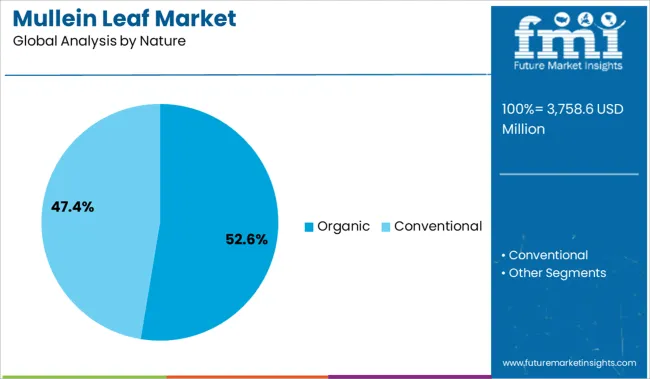
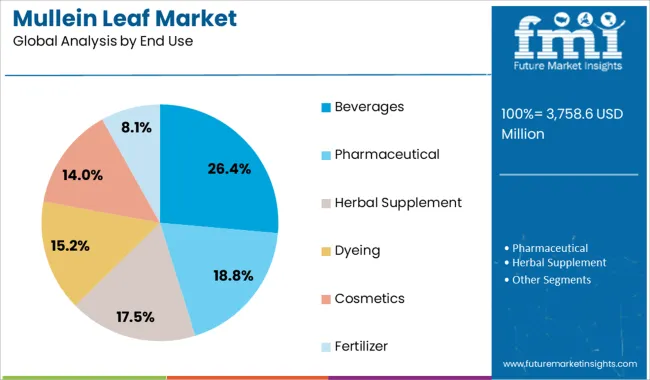
Global mullein leaf market demand is anticipated to be valued at USD 3,390 Million in 2022, forecast to grow at a CAGR of 3.5% to be valued at USD 4,781.6 Million from 2022 to 2032. Growth is attributed to increased demand for herbal products, especially across the pharmaceutical industries.
Report Attribute | Details |
---|---|
Estimated Base Year Value (2021) | USD 3,285.5 Million |
Expected Market Value (2022) | USD 3,390 Million |
Anticipated Forecast Value (2032) | USD 4,781.6 Million |
Projected Growth Rate (2022 to 2032) | 3.5% CAGR |
Mullein leaf is mainly used in medicine. Many people use mullein leaf for treating breathing conditions such as cough or asthma, pneumonia, colds, and sore throat. Though there is no scientific evidence of this. In the manufacturing of alcoholic beverages, mullein leaf can be used as a flavoring ingredient.
North America is considered to be a highly lucrative market for the mullein leaf market and its different products, driven primarily by its utilization across the pharmaceutical, and food & beverage industries.
Simultaneously, some side effects such as contact dermatitis, and skin itching concerning the use of the mullein leaf market are acting as significant growth barriers. If mullein leaf is not consumed at appropriate levels have reported effects. Certain stringent regulation by the government is the hindering factor for the market. Hence, manufacturers are striving to develop more user-friendly alternatives. This is expected to restrain market growth to a significant extent.
Increased population, disposable income, growing health awareness of the consumers, and ongoing wellness trends are some of the driving factors affecting the growth of the mullein leaf market.
The global mullein leaf market is contributed by the increasing demand for healthy beverages and flavor variants. Also, the increasing demand for herbal products in developed nations is expected to create lucrative opportunities for the players in the market. Mullein oil extracted from the plant is used to treat conditions such as earaches, eczema, and other skin conditions.
Rising awareness regarding the uses and health benefits of mullein leaf of increased demand in the market in the forecasting period. The pharmaceutical industry is expected to accrue significant benefits to the global mullein leaf market. The mullein leaf market is expected to witness significant growth in the near future. This is attributed to the increasing availability of these products across the wholesaler, online market, supermarket, and specialty stores.
Although the mullein leaf market has numerous end-uses, there are numerous obstacles that likely pose a challenge to market growth. As mullein plant is considered a noxious weed by some of the states of the USA such as Colorado and Hawaii as these areas are not native regions for the plant. Stringent government rules and regulations regarding the cultivation of the mullein plant hinder the growth of the market. Also, the lack of awareness of products of mullein leaf hampers the growth of the market during the forecasting period.
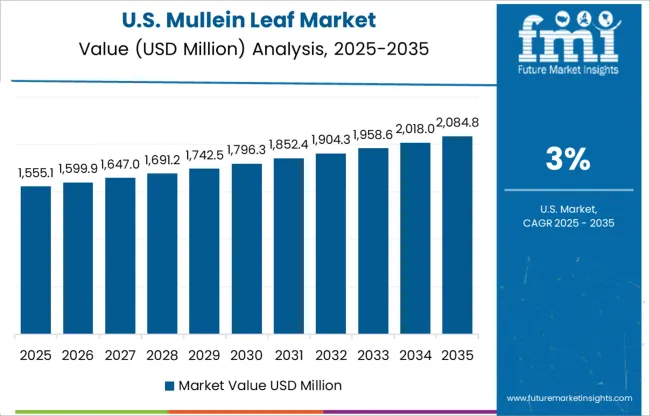
North America was the largest market for mullein leaf and the trend is expected to continue into the forecast period owing to awareness about the benefits of mullein leaf in this region.
Growing demand for the food and beverage industry is indirectly expected to augment the mullein leaf market. The region is forecast to surge at 3.3% CAGR from 2022 to 2032. The abundant availability of mullein leaf plants in the region is among some of the most prominent growth drivers for the North American region. Because of this, numerous manufacturers are establishing a base across the region.
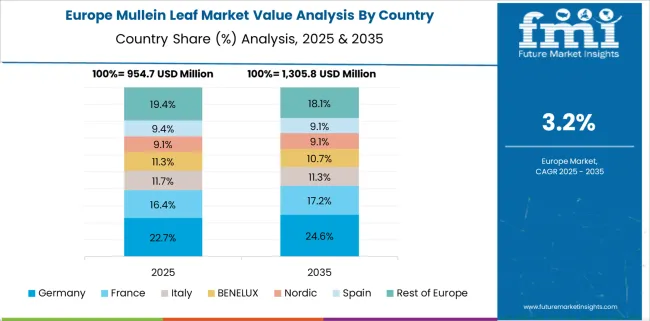
According to Future Market Insights, Europe is expected to provide immense growth opportunities for mullein leaf, with the United Kingdom expected to steer the bulk of all regional growth. Extensive applications in the pharmaceutical industry are keeping sales of mullein leaf afloat across the United Kingdom.
Many countries of the region are generating high demand for mullein leaf, as all these regions are native regions for mullein leaf as the plant is not noxious in the region. Moreover, the cosmetic industry in these countries is also experiencing a major upsurge, which will generate favorable conditions for market growth.
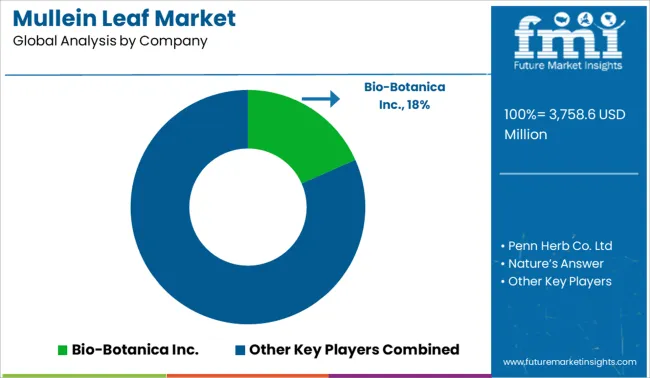
Some of the key participants present in the global mullein leaf market include Bio-Botanica Inc., Penn Herb Co. Ltd., Nature’s Answer, Starwest Botanicals Inc., Baar Products, Inc., Mountain Rose Herbs, Alvita, Solaray, Lucky Mojo Curio co., Payne Mountain Farms, and Swanson Vitamins among others.
Attributed to the presence of such a high number of participants, the market is highly competitive. While global players such as Bio-Botanica Inc., Penn Herb Co. Ltd., and Nature’s Answer account for considerable market size, several regional-level players are also operating across key growth regions, particularly in the Asia Pacific.
Report Attribute | Details |
---|---|
Growth Rate | CAGR of 3.5% from 2022 to 2032 |
Market Value in 2022 | USD 3,390 Million |
Market Value in 2032 | USD 4,781.6 Million |
Base Year for Estimation | 2021 |
Historical Data | 2017 to 2021 |
Forecast Period | 2022 to 2032 |
Quantitative Units | Revenue in USD Billion, Volume in Kilotons, and CAGR from 2022 to 2032 |
Report Coverage | Revenue Forecast, Volume Forecast, Company Ranking, Competitive Landscape, Growth Factors, Trends, and Pricing Analysis |
Segments Covered | Type, Nature, End-use, Packaging, Distribution Channel, Region |
Regions Covered | North America; Latin America; Europe; Asia Pacific; Middle East and Africa |
Key Countries Profiled | USA, Canada, Brazil, Argentina, Chile, Mexico, Peru, Germany, Italy, France, United Kingdom, Spain, Russia, BENELUX, China, Japan, South Korea, GCC Countries, South Africa, Turkey |
Key Companies Profiled | Bio-Botanica Inc.; Penn Herb Co. Ltd; Nature’s Answer; Starwest Botanicals Inc.; Baar Products; Mountain Rose Herbs; Alvita; Solaray; Lucky Mojo Curio Co.; Payne Mountain Farms; Swanson Vitamins |
Customization | Available Upon Request |
Table 1: Global Market Value (US$ Million) Forecast by Region, 2017 to 2032
Table 2: Global Market Volume (Tons) Forecast by Region, 2017 to 2032
Table 3: Global Market Value (US$ Million) Forecast by Type, 2017 to 2032
Table 4: Global Market Volume (Tons) Forecast by Type, 2017 to 2032
Table 5: Global Market Value (US$ Million) Forecast by Nature, 2017 to 2032
Table 6: Global Market Volume (Tons) Forecast by Nature, 2017 to 2032
Table 7: Global Market Value (US$ Million) Forecast by End Use, 2017 to 2032
Table 8: Global Market Volume (Tons) Forecast by End Use, 2017 to 2032
Table 9: Global Market Value (US$ Million) Forecast by Packaging, 2017 to 2032
Table 10: Global Market Volume (Tons) Forecast by Packaging, 2017 to 2032
Table 11: Global Market Value (US$ Million) Forecast by Distribution Channel, 2017 to 2032
Table 12: Global Market Volume (Tons) Forecast by Distribution Channel, 2017 to 2032
Table 13: North America Market Value (US$ Million) Forecast by Country, 2017 to 2032
Table 14: North America Market Volume (Tons) Forecast by Country, 2017 to 2032
Table 15: North America Market Value (US$ Million) Forecast by Type, 2017 to 2032
Table 16: North America Market Volume (Tons) Forecast by Type, 2017 to 2032
Table 17: North America Market Value (US$ Million) Forecast by Nature, 2017 to 2032
Table 18: North America Market Volume (Tons) Forecast by Nature, 2017 to 2032
Table 19: North America Market Value (US$ Million) Forecast by End Use, 2017 to 2032
Table 20: North America Market Volume (Tons) Forecast by End Use, 2017 to 2032
Table 21: North America Market Value (US$ Million) Forecast by Packaging, 2017 to 2032
Table 22: North America Market Volume (Tons) Forecast by Packaging, 2017 to 2032
Table 23: North America Market Value (US$ Million) Forecast by Distribution Channel, 2017 to 2032
Table 24: North America Market Volume (Tons) Forecast by Distribution Channel, 2017 to 2032
Table 25: Latin America Market Value (US$ Million) Forecast by Country, 2017 to 2032
Table 26: Latin America Market Volume (Tons) Forecast by Country, 2017 to 2032
Table 27: Latin America Market Value (US$ Million) Forecast by Type, 2017 to 2032
Table 28: Latin America Market Volume (Tons) Forecast by Type, 2017 to 2032
Table 29: Latin America Market Value (US$ Million) Forecast by Nature, 2017 to 2032
Table 30: Latin America Market Volume (Tons) Forecast by Nature, 2017 to 2032
Table 31: Latin America Market Value (US$ Million) Forecast by End Use, 2017 to 2032
Table 32: Latin America Market Volume (Tons) Forecast by End Use, 2017 to 2032
Table 33: Latin America Market Value (US$ Million) Forecast by Packaging, 2017 to 2032
Table 34: Latin America Market Volume (Tons) Forecast by Packaging, 2017 to 2032
Table 35: Latin America Market Value (US$ Million) Forecast by Distribution Channel, 2017 to 2032
Table 36: Latin America Market Volume (Tons) Forecast by Distribution Channel, 2017 to 2032
Table 37: Europe Market Value (US$ Million) Forecast by Country, 2017 to 2032
Table 38: Europe Market Volume (Tons) Forecast by Country, 2017 to 2032
Table 39: Europe Market Value (US$ Million) Forecast by Type, 2017 to 2032
Table 40: Europe Market Volume (Tons) Forecast by Type, 2017 to 2032
Table 41: Europe Market Value (US$ Million) Forecast by Nature, 2017 to 2032
Table 42: Europe Market Volume (Tons) Forecast by Nature, 2017 to 2032
Table 43: Europe Market Value (US$ Million) Forecast by End Use, 2017 to 2032
Table 44: Europe Market Volume (Tons) Forecast by End Use, 2017 to 2032
Table 45: Europe Market Value (US$ Million) Forecast by Packaging, 2017 to 2032
Table 46: Europe Market Volume (Tons) Forecast by Packaging, 2017 to 2032
Table 47: Europe Market Value (US$ Million) Forecast by Distribution Channel, 2017 to 2032
Table 48: Europe Market Volume (Tons) Forecast by Distribution Channel, 2017 to 2032
Table 49: Asia Pacific Market Value (US$ Million) Forecast by Country, 2017 to 2032
Table 50: Asia Pacific Market Volume (Tons) Forecast by Country, 2017 to 2032
Table 51: Asia Pacific Market Value (US$ Million) Forecast by Type, 2017 to 2032
Table 52: Asia Pacific Market Volume (Tons) Forecast by Type, 2017 to 2032
Table 53: Asia Pacific Market Value (US$ Million) Forecast by Nature, 2017 to 2032
Table 54: Asia Pacific Market Volume (Tons) Forecast by Nature, 2017 to 2032
Table 55: Asia Pacific Market Value (US$ Million) Forecast by End Use, 2017 to 2032
Table 56: Asia Pacific Market Volume (Tons) Forecast by End Use, 2017 to 2032
Table 57: Asia Pacific Market Value (US$ Million) Forecast by Packaging, 2017 to 2032
Table 58: Asia Pacific Market Volume (Tons) Forecast by Packaging, 2017 to 2032
Table 59: Asia Pacific Market Value (US$ Million) Forecast by Distribution Channel, 2017 to 2032
Table 60: Asia Pacific Market Volume (Tons) Forecast by Distribution Channel, 2017 to 2032
Table 61: Middle East and Africa Market Value (US$ Million) Forecast by Country, 2017 to 2032
Table 62: Middle East and Africa Market Volume (Tons) Forecast by Country, 2017 to 2032
Table 63: Middle East and Africa Market Value (US$ Million) Forecast by Type, 2017 to 2032
Table 64: Middle East and Africa Market Volume (Tons) Forecast by Type, 2017 to 2032
Table 65: Middle East and Africa Market Value (US$ Million) Forecast by Nature, 2017 to 2032
Table 66: Middle East and Africa Market Volume (Tons) Forecast by Nature, 2017 to 2032
Table 67: Middle East and Africa Market Value (US$ Million) Forecast by End Use, 2017 to 2032
Table 68: Middle East and Africa Market Volume (Tons) Forecast by End Use, 2017 to 2032
Table 69: Middle East and Africa Market Value (US$ Million) Forecast by Packaging, 2017 to 2032
Table 70: Middle East and Africa Market Volume (Tons) Forecast by Packaging, 2017 to 2032
Table 71: Middle East and Africa Market Value (US$ Million) Forecast by Distribution Channel, 2017 to 2032
Table 72: Middle East and Africa Market Volume (Tons) Forecast by Distribution Channel, 2017 to 2032
Figure 1: Global Market Value (US$ Million) by Type, 2022 to 2032
Figure 2: Global Market Value (US$ Million) by Nature, 2022 to 2032
Figure 3: Global Market Value (US$ Million) by End Use, 2022 to 2032
Figure 4: Global Market Value (US$ Million) by Packaging, 2022 to 2032
Figure 5: Global Market Value (US$ Million) by Distribution Channel, 2022 to 2032
Figure 6: Global Market Value (US$ Million) by Region, 2022 to 2032
Figure 7: Global Market Value (US$ Million) Analysis by Region, 2017 to 2032
Figure 8: Global Market Volume (Tons) Analysis by Region, 2017 to 2032
Figure 9: Global Market Value Share (%) and BPS Analysis by Region, 2022 to 2032
Figure 10: Global Market Y-o-Y Growth (%) Projections by Region, 2022 to 2032
Figure 11: Global Market Value (US$ Million) Analysis by Type, 2017 to 2032
Figure 12: Global Market Volume (Tons) Analysis by Type, 2017 to 2032
Figure 13: Global Market Value Share (%) and BPS Analysis by Type, 2022 to 2032
Figure 14: Global Market Y-o-Y Growth (%) Projections by Type, 2022 to 2032
Figure 15: Global Market Value (US$ Million) Analysis by Nature, 2017 to 2032
Figure 16: Global Market Volume (Tons) Analysis by Nature, 2017 to 2032
Figure 17: Global Market Value Share (%) and BPS Analysis by Nature, 2022 to 2032
Figure 18: Global Market Y-o-Y Growth (%) Projections by Nature, 2022 to 2032
Figure 19: Global Market Value (US$ Million) Analysis by End Use, 2017 to 2032
Figure 20: Global Market Volume (Tons) Analysis by End Use, 2017 to 2032
Figure 21: Global Market Value Share (%) and BPS Analysis by End Use, 2022 to 2032
Figure 22: Global Market Y-o-Y Growth (%) Projections by End Use, 2022 to 2032
Figure 23: Global Market Value (US$ Million) Analysis by Packaging, 2017 to 2032
Figure 24: Global Market Volume (Tons) Analysis by Packaging, 2017 to 2032
Figure 25: Global Market Value Share (%) and BPS Analysis by Packaging, 2022 to 2032
Figure 26: Global Market Y-o-Y Growth (%) Projections by Packaging, 2022 to 2032
Figure 27: Global Market Value (US$ Million) Analysis by Distribution Channel, 2017 to 2032
Figure 28: Global Market Volume (Tons) Analysis by Distribution Channel, 2017 to 2032
Figure 29: Global Market Value Share (%) and BPS Analysis by Distribution Channel, 2022 to 2032
Figure 30: Global Market Y-o-Y Growth (%) Projections by Distribution Channel, 2022 to 2032
Figure 31: Global Market Attractiveness by Type, 2022 to 2032
Figure 32: Global Market Attractiveness by Nature, 2022 to 2032
Figure 33: Global Market Attractiveness by End Use, 2022 to 2032
Figure 34: Global Market Attractiveness by Packaging, 2022 to 2032
Figure 35: Global Market Attractiveness by Distribution Channel, 2022 to 2032
Figure 36: Global Market Attractiveness by Region, 2022 to 2032
Figure 37: North America Market Value (US$ Million) by Type, 2022 to 2032
Figure 38: North America Market Value (US$ Million) by Nature, 2022 to 2032
Figure 39: North America Market Value (US$ Million) by End Use, 2022 to 2032
Figure 40: North America Market Value (US$ Million) by Packaging, 2022 to 2032
Figure 41: North America Market Value (US$ Million) by Distribution Channel, 2022 to 2032
Figure 42: North America Market Value (US$ Million) by Country, 2022 to 2032
Figure 43: North America Market Value (US$ Million) Analysis by Country, 2017 to 2032
Figure 44: North America Market Volume (Tons) Analysis by Country, 2017 to 2032
Figure 45: North America Market Value Share (%) and BPS Analysis by Country, 2022 to 2032
Figure 46: North America Market Y-o-Y Growth (%) Projections by Country, 2022 to 2032
Figure 47: North America Market Value (US$ Million) Analysis by Type, 2017 to 2032
Figure 48: North America Market Volume (Tons) Analysis by Type, 2017 to 2032
Figure 49: North America Market Value Share (%) and BPS Analysis by Type, 2022 to 2032
Figure 50: North America Market Y-o-Y Growth (%) Projections by Type, 2022 to 2032
Figure 51: North America Market Value (US$ Million) Analysis by Nature, 2017 to 2032
Figure 52: North America Market Volume (Tons) Analysis by Nature, 2017 to 2032
Figure 53: North America Market Value Share (%) and BPS Analysis by Nature, 2022 to 2032
Figure 54: North America Market Y-o-Y Growth (%) Projections by Nature, 2022 to 2032
Figure 55: North America Market Value (US$ Million) Analysis by End Use, 2017 to 2032
Figure 56: North America Market Volume (Tons) Analysis by End Use, 2017 to 2032
Figure 57: North America Market Value Share (%) and BPS Analysis by End Use, 2022 to 2032
Figure 58: North America Market Y-o-Y Growth (%) Projections by End Use, 2022 to 2032
Figure 59: North America Market Value (US$ Million) Analysis by Packaging, 2017 to 2032
Figure 60: North America Market Volume (Tons) Analysis by Packaging, 2017 to 2032
Figure 61: North America Market Value Share (%) and BPS Analysis by Packaging, 2022 to 2032
Figure 62: North America Market Y-o-Y Growth (%) Projections by Packaging, 2022 to 2032
Figure 63: North America Market Value (US$ Million) Analysis by Distribution Channel, 2017 to 2032
Figure 64: North America Market Volume (Tons) Analysis by Distribution Channel, 2017 to 2032
Figure 65: North America Market Value Share (%) and BPS Analysis by Distribution Channel, 2022 to 2032
Figure 66: North America Market Y-o-Y Growth (%) Projections by Distribution Channel, 2022 to 2032
Figure 67: North America Market Attractiveness by Type, 2022 to 2032
Figure 68: North America Market Attractiveness by Nature, 2022 to 2032
Figure 69: North America Market Attractiveness by End Use, 2022 to 2032
Figure 70: North America Market Attractiveness by Packaging, 2022 to 2032
Figure 71: North America Market Attractiveness by Distribution Channel, 2022 to 2032
Figure 72: North America Market Attractiveness by Country, 2022 to 2032
Figure 73: Latin America Market Value (US$ Million) by Type, 2022 to 2032
Figure 74: Latin America Market Value (US$ Million) by Nature, 2022 to 2032
Figure 75: Latin America Market Value (US$ Million) by End Use, 2022 to 2032
Figure 76: Latin America Market Value (US$ Million) by Packaging, 2022 to 2032
Figure 77: Latin America Market Value (US$ Million) by Distribution Channel, 2022 to 2032
Figure 78: Latin America Market Value (US$ Million) by Country, 2022 to 2032
Figure 79: Latin America Market Value (US$ Million) Analysis by Country, 2017 to 2032
Figure 80: Latin America Market Volume (Tons) Analysis by Country, 2017 to 2032
Figure 81: Latin America Market Value Share (%) and BPS Analysis by Country, 2022 to 2032
Figure 82: Latin America Market Y-o-Y Growth (%) Projections by Country, 2022 to 2032
Figure 83: Latin America Market Value (US$ Million) Analysis by Type, 2017 to 2032
Figure 84: Latin America Market Volume (Tons) Analysis by Type, 2017 to 2032
Figure 85: Latin America Market Value Share (%) and BPS Analysis by Type, 2022 to 2032
Figure 86: Latin America Market Y-o-Y Growth (%) Projections by Type, 2022 to 2032
Figure 87: Latin America Market Value (US$ Million) Analysis by Nature, 2017 to 2032
Figure 88: Latin America Market Volume (Tons) Analysis by Nature, 2017 to 2032
Figure 89: Latin America Market Value Share (%) and BPS Analysis by Nature, 2022 to 2032
Figure 90: Latin America Market Y-o-Y Growth (%) Projections by Nature, 2022 to 2032
Figure 91: Latin America Market Value (US$ Million) Analysis by End Use, 2017 to 2032
Figure 92: Latin America Market Volume (Tons) Analysis by End Use, 2017 to 2032
Figure 93: Latin America Market Value Share (%) and BPS Analysis by End Use, 2022 to 2032
Figure 94: Latin America Market Y-o-Y Growth (%) Projections by End Use, 2022 to 2032
Figure 95: Latin America Market Value (US$ Million) Analysis by Packaging, 2017 to 2032
Figure 96: Latin America Market Volume (Tons) Analysis by Packaging, 2017 to 2032
Figure 97: Latin America Market Value Share (%) and BPS Analysis by Packaging, 2022 to 2032
Figure 98: Latin America Market Y-o-Y Growth (%) Projections by Packaging, 2022 to 2032
Figure 99: Latin America Market Value (US$ Million) Analysis by Distribution Channel, 2017 to 2032
Figure 100: Latin America Market Volume (Tons) Analysis by Distribution Channel, 2017 to 2032
Figure 101: Latin America Market Value Share (%) and BPS Analysis by Distribution Channel, 2022 to 2032
Figure 102: Latin America Market Y-o-Y Growth (%) Projections by Distribution Channel, 2022 to 2032
Figure 103: Latin America Market Attractiveness by Type, 2022 to 2032
Figure 104: Latin America Market Attractiveness by Nature, 2022 to 2032
Figure 105: Latin America Market Attractiveness by End Use, 2022 to 2032
Figure 106: Latin America Market Attractiveness by Packaging, 2022 to 2032
Figure 107: Latin America Market Attractiveness by Distribution Channel, 2022 to 2032
Figure 108: Latin America Market Attractiveness by Country, 2022 to 2032
Figure 109: Europe Market Value (US$ Million) by Type, 2022 to 2032
Figure 110: Europe Market Value (US$ Million) by Nature, 2022 to 2032
Figure 111: Europe Market Value (US$ Million) by End Use, 2022 to 2032
Figure 112: Europe Market Value (US$ Million) by Packaging, 2022 to 2032
Figure 113: Europe Market Value (US$ Million) by Distribution Channel, 2022 to 2032
Figure 114: Europe Market Value (US$ Million) by Country, 2022 to 2032
Figure 115: Europe Market Value (US$ Million) Analysis by Country, 2017 to 2032
Figure 116: Europe Market Volume (Tons) Analysis by Country, 2017 to 2032
Figure 117: Europe Market Value Share (%) and BPS Analysis by Country, 2022 to 2032
Figure 118: Europe Market Y-o-Y Growth (%) Projections by Country, 2022 to 2032
Figure 119: Europe Market Value (US$ Million) Analysis by Type, 2017 to 2032
Figure 120: Europe Market Volume (Tons) Analysis by Type, 2017 to 2032
Figure 121: Europe Market Value Share (%) and BPS Analysis by Type, 2022 to 2032
Figure 122: Europe Market Y-o-Y Growth (%) Projections by Type, 2022 to 2032
Figure 123: Europe Market Value (US$ Million) Analysis by Nature, 2017 to 2032
Figure 124: Europe Market Volume (Tons) Analysis by Nature, 2017 to 2032
Figure 125: Europe Market Value Share (%) and BPS Analysis by Nature, 2022 to 2032
Figure 126: Europe Market Y-o-Y Growth (%) Projections by Nature, 2022 to 2032
Figure 127: Europe Market Value (US$ Million) Analysis by End Use, 2017 to 2032
Figure 128: Europe Market Volume (Tons) Analysis by End Use, 2017 to 2032
Figure 129: Europe Market Value Share (%) and BPS Analysis by End Use, 2022 to 2032
Figure 130: Europe Market Y-o-Y Growth (%) Projections by End Use, 2022 to 2032
Figure 131: Europe Market Value (US$ Million) Analysis by Packaging, 2017 to 2032
Figure 132: Europe Market Volume (Tons) Analysis by Packaging, 2017 to 2032
Figure 133: Europe Market Value Share (%) and BPS Analysis by Packaging, 2022 to 2032
Figure 134: Europe Market Y-o-Y Growth (%) Projections by Packaging, 2022 to 2032
Figure 135: Europe Market Value (US$ Million) Analysis by Distribution Channel, 2017 to 2032
Figure 136: Europe Market Volume (Tons) Analysis by Distribution Channel, 2017 to 2032
Figure 137: Europe Market Value Share (%) and BPS Analysis by Distribution Channel, 2022 to 2032
Figure 138: Europe Market Y-o-Y Growth (%) Projections by Distribution Channel, 2022 to 2032
Figure 139: Europe Market Attractiveness by Type, 2022 to 2032
Figure 140: Europe Market Attractiveness by Nature, 2022 to 2032
Figure 141: Europe Market Attractiveness by End Use, 2022 to 2032
Figure 142: Europe Market Attractiveness by Packaging, 2022 to 2032
Figure 143: Europe Market Attractiveness by Distribution Channel, 2022 to 2032
Figure 144: Europe Market Attractiveness by Country, 2022 to 2032
Figure 145: Asia Pacific Market Value (US$ Million) by Type, 2022 to 2032
Figure 146: Asia Pacific Market Value (US$ Million) by Nature, 2022 to 2032
Figure 147: Asia Pacific Market Value (US$ Million) by End Use, 2022 to 2032
Figure 148: Asia Pacific Market Value (US$ Million) by Packaging, 2022 to 2032
Figure 149: Asia Pacific Market Value (US$ Million) by Distribution Channel, 2022 to 2032
Figure 150: Asia Pacific Market Value (US$ Million) by Country, 2022 to 2032
Figure 151: Asia Pacific Market Value (US$ Million) Analysis by Country, 2017 to 2032
Figure 152: Asia Pacific Market Volume (Tons) Analysis by Country, 2017 to 2032
Figure 153: Asia Pacific Market Value Share (%) and BPS Analysis by Country, 2022 to 2032
Figure 154: Asia Pacific Market Y-o-Y Growth (%) Projections by Country, 2022 to 2032
Figure 155: Asia Pacific Market Value (US$ Million) Analysis by Type, 2017 to 2032
Figure 156: Asia Pacific Market Volume (Tons) Analysis by Type, 2017 to 2032
Figure 157: Asia Pacific Market Value Share (%) and BPS Analysis by Type, 2022 to 2032
Figure 158: Asia Pacific Market Y-o-Y Growth (%) Projections by Type, 2022 to 2032
Figure 159: Asia Pacific Market Value (US$ Million) Analysis by Nature, 2017 to 2032
Figure 160: Asia Pacific Market Volume (Tons) Analysis by Nature, 2017 to 2032
Figure 161: Asia Pacific Market Value Share (%) and BPS Analysis by Nature, 2022 to 2032
Figure 162: Asia Pacific Market Y-o-Y Growth (%) Projections by Nature, 2022 to 2032
Figure 163: Asia Pacific Market Value (US$ Million) Analysis by End Use, 2017 to 2032
Figure 164: Asia Pacific Market Volume (Tons) Analysis by End Use, 2017 to 2032
Figure 165: Asia Pacific Market Value Share (%) and BPS Analysis by End Use, 2022 to 2032
Figure 166: Asia Pacific Market Y-o-Y Growth (%) Projections by End Use, 2022 to 2032
Figure 167: Asia Pacific Market Value (US$ Million) Analysis by Packaging, 2017 to 2032
Figure 168: Asia Pacific Market Volume (Tons) Analysis by Packaging, 2017 to 2032
Figure 169: Asia Pacific Market Value Share (%) and BPS Analysis by Packaging, 2022 to 2032
Figure 170: Asia Pacific Market Y-o-Y Growth (%) Projections by Packaging, 2022 to 2032
Figure 171: Asia Pacific Market Value (US$ Million) Analysis by Distribution Channel, 2017 to 2032
Figure 172: Asia Pacific Market Volume (Tons) Analysis by Distribution Channel, 2017 to 2032
Figure 173: Asia Pacific Market Value Share (%) and BPS Analysis by Distribution Channel, 2022 to 2032
Figure 174: Asia Pacific Market Y-o-Y Growth (%) Projections by Distribution Channel, 2022 to 2032
Figure 175: Asia Pacific Market Attractiveness by Type, 2022 to 2032
Figure 176: Asia Pacific Market Attractiveness by Nature, 2022 to 2032
Figure 177: Asia Pacific Market Attractiveness by End Use, 2022 to 2032
Figure 178: Asia Pacific Market Attractiveness by Packaging, 2022 to 2032
Figure 179: Asia Pacific Market Attractiveness by Distribution Channel, 2022 to 2032
Figure 180: Asia Pacific Market Attractiveness by Country, 2022 to 2032
Figure 181: Middle East and Africa Market Value (US$ Million) by Type, 2022 to 2032
Figure 182: Middle East and Africa Market Value (US$ Million) by Nature, 2022 to 2032
Figure 183: Middle East and Africa Market Value (US$ Million) by End Use, 2022 to 2032
Figure 184: Middle East and Africa Market Value (US$ Million) by Packaging, 2022 to 2032
Figure 185: Middle East and Africa Market Value (US$ Million) by Distribution Channel, 2022 to 2032
Figure 186: Middle East and Africa Market Value (US$ Million) by Country, 2022 to 2032
Figure 187: Middle East and Africa Market Value (US$ Million) Analysis by Country, 2017 to 2032
Figure 188: Middle East and Africa Market Volume (Tons) Analysis by Country, 2017 to 2032
Figure 189: Middle East and Africa Market Value Share (%) and BPS Analysis by Country, 2022 to 2032
Figure 190: Middle East and Africa Market Y-o-Y Growth (%) Projections by Country, 2022 to 2032
Figure 191: Middle East and Africa Market Value (US$ Million) Analysis by Type, 2017 to 2032
Figure 192: Middle East and Africa Market Volume (Tons) Analysis by Type, 2017 to 2032
Figure 193: Middle East and Africa Market Value Share (%) and BPS Analysis by Type, 2022 to 2032
Figure 194: Middle East and Africa Market Y-o-Y Growth (%) Projections by Type, 2022 to 2032
Figure 195: Middle East and Africa Market Value (US$ Million) Analysis by Nature, 2017 to 2032
Figure 196: Middle East and Africa Market Volume (Tons) Analysis by Nature, 2017 to 2032
Figure 197: Middle East and Africa Market Value Share (%) and BPS Analysis by Nature, 2022 to 2032
Figure 198: Middle East and Africa Market Y-o-Y Growth (%) Projections by Nature, 2022 to 2032
Figure 199: Middle East and Africa Market Value (US$ Million) Analysis by End Use, 2017 to 2032
Figure 200: Middle East and Africa Market Volume (Tons) Analysis by End Use, 2017 to 2032
Figure 201: Middle East and Africa Market Value Share (%) and BPS Analysis by End Use, 2022 to 2032
Figure 202: Middle East and Africa Market Y-o-Y Growth (%) Projections by End Use, 2022 to 2032
Figure 203: Middle East and Africa Market Value (US$ Million) Analysis by Packaging, 2017 to 2032
Figure 204: Middle East and Africa Market Volume (Tons) Analysis by Packaging, 2017 to 2032
Figure 205: Middle East and Africa Market Value Share (%) and BPS Analysis by Packaging, 2022 to 2032
Figure 206: Middle East and Africa Market Y-o-Y Growth (%) Projections by Packaging, 2022 to 2032
Figure 207: Middle East and Africa Market Value (US$ Million) Analysis by Distribution Channel, 2017 to 2032
Figure 208: Middle East and Africa Market Volume (Tons) Analysis by Distribution Channel, 2017 to 2032
Figure 209: Middle East and Africa Market Value Share (%) and BPS Analysis by Distribution Channel, 2022 to 2032
Figure 210: Middle East and Africa Market Y-o-Y Growth (%) Projections by Distribution Channel, 2022 to 2032
Figure 211: Middle East and Africa Market Attractiveness by Type, 2022 to 2032
Figure 212: Middle East and Africa Market Attractiveness by Nature, 2022 to 2032
Figure 213: Middle East and Africa Market Attractiveness by End Use, 2022 to 2032
Figure 214: Middle East and Africa Market Attractiveness by Packaging, 2022 to 2032
Figure 215: Middle East and Africa Market Attractiveness by Distribution Channel, 2022 to 2032
Figure 216: Middle East and Africa Market Attractiveness by Country, 2022 to 2032
FMI projects the global mullein leaf market to expand at a 3.5% value CAGR by 2032
North America is expected to be the most opportunistic mullein leaf market, expanding at a 3.3% CAGR
Bio-Botanica Inc., Penn Herb Co. Ltd., and Nature’s Answer are some prominent chloromethane manufacturers
Explore Similar Insights
Thank you!
You will receive an email from our Business Development Manager. Please be sure to check your SPAM/JUNK folder too.