

- Industry Size (2022)
- USD 15.49 Bn
- Forecast (2032)
- USD 32.51 Bn
- CAGR (2022 to 2032)
- 7.7%
Camellia Sinensis Leaf Extract Market Snapshot (2022-2032)
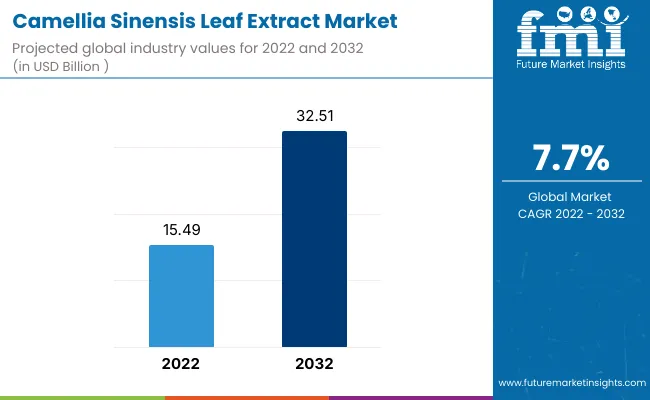
[250 Pages Report] The camellia sinensis leaf extract market is likely to register a CAGR of 7.7% during the forecast period, and is anticipated to reach a camellia sinensis leaf extract market share of US$ 32.51 billion by 2032 from US$ 15.49 billion in 2022.
| Report Attributes | Details |
| Camellia Sinensis Leaf Extract Market (2021) | US$ 14.30 Billion |
| Camellia Sinensis Leaf Extract Market (2022) | US$ 15.49 Billion |
| Camellia Sinensis Leaf Extract Market (2032) | US$ 32.51 Billion |
| Camellia Sinensis Leaf Extract Market CAGR (2022-2032) | 7.7% |
The rising demand for Camellia Sinensis leaf extracts can be attributed to their wide usage in health remedies to treat heart disease, high blood pressure, triglycerides, restore antioxidants, and prevent plaque.
The sales of Camellia Sinensis leaf extracts are also likely to boost owing to its usage in skincare products where it acts as an anti-ageing remedy for the skin, and its usage antibacterial and hydrate the skin.
Camellia Sinensis leaf extracts are also utilized in making green tea, black tea & white tea which are acne-prone to the skin. This factor increases the sales of Camellia Sinensis leaf extracts in the forecast period from 2022 to 2032.
Camellia Sinensis leaf extracts oil is known for boosting the immune system and reduce weight, stress and anxiety, soaring the demand for Camellia Sinensis leaf extracts all around the globe.
How is the Demand for Organic Skincare Pushing the Camellia Sinensis Leaf Extract Market Growth?
The beauty & personal care market is growing at a rapid pace due to rising demand for Camellia Sinensis leaf extract around the world.
Though consumers nowadays are more concerned about their looks, they are aware of the side effects of using chemical or non-natural cosmetic products and the same is expected to spike the demand for Camellia Sinensis leaf extract.
Therefore, the demand for Camellia Sinensis leaf extract along with the sales of Camellia Sinensis leaf extract are anticipated to augment as focus shifts from chemical products to organic and natural products.
Aside from cosmetics, Camellia sinensis leaf extract's antioxidant property aids in cancer prevention thereby increasing the sales of Camellia Sinensis leaf extract.
The expanding Camellia Sinensis leaf extract market share is due to its wide usage by pharmaceutical companies as well.
The sales of Camellia Sinensis leaf extract market are expected to grow over the forecast period as it is considerably gaining traction in the recent years owing to its benefits.
Which Factors May Hinder the Camellia Sinensis Leaf Extract Market Growth?
The lack of production in various regions may hinder the Camellia Sinensis leaf extract market share as it takes nearly 3 years to mature the plant.
Moreover, as it is a natural ingredient that is used in several factors, it becomes expensive for consumers with lower disposable income, in turn, dwindling the sales of Camellia Sinensis leaf extract.
Apart from it, the demand for Camellia Sinensis leaf extract may go down due to its mild side effects such as allergy, skin reaction, nausea, liver toxicity and digestive symptoms.
These factors can hinder the demand for Camellia Sinensis leaf extract as well as sales of Camellia Sinensis leaf extract during the forecast period from 2022 to 2032.
How is the Need for Herbal Products Driving the Asia Pacific Camellia Sinensis Leaf Extract Market?
The Asia Pacific is believed to have a significant growth rate for Camellia Sinensis leaf extract market share due to its higher population, and growing economic condition leading to a higher sales of Camellia Sinensis leaf extract.
Countries such as China, Japan, India and South Korea are anticipated to boost the Camellia Sinensis leaf extract market share in the forecast period (2022 to 2032).
Growing consumer awareness of health & fitness generates high demand for Camellia Sinensis leaf extract market around the region.
Thus, using natural ingredients which are considered healthy generates a substantial demand from the consumer which, in turn soars the overall sales of Camellia Sinensis leaf extract.
Are Skincare Start-up Companies Propelling the North America Camellia Sinensis Leaf Extract Market?
North American region is likely to invest in start-up companies to generate more production and revenue through which, the demand for Camellia Sinensis leaf extract rises, as per the Camellia Sinensis Leaf Extract market survey.
The demand for Camellia Sinensis leaf extract in North America can also be credited to the increasing tea production and uses in other beauty products such as skin and hair care.
This is also considered as a leading factor which generates the sales of Camellia Sinensis Leaf Extract in the region during the forecast period.
Market Competition
Some of the major players in the Camellia Sinensis leaf extract market are Taiyo GmbH, Shanghai Freemen, LLC, Kemin Industries, Inc., AVT Tea Services, and Naturalin Bio-Resources Co., Ltd, Nexira SAS, ETchem, Shudhanta Herbal Products, Berkem USA, Carrubba Incorporated and others.
These companies are growing with innovative product formulations and launches and the same is also expected to bring about various emerging trends in Camellia Sinensis leaf extract market.
Recent developments in the market are as follows
- Keurig Dr Pepper, Inc. released 100% recycled plastic bottles for its ready-to-drink green-type tea brands, Snapple and Core.
- OZiva, India's premier clean-label nutrition brand, has introduced Matcha Plus, a nutritious combination of organic Japanese matcha, liquorice, activated charcoal, and ginger root.
Scope Of Report
|
Report Attribute |
Details |
|
Growth Rate |
CAGR of 7.7% from 2022 to 2030 |
|
Base year for estimation |
2021 |
|
Historical data |
2015 - 2020 |
|
Forecast period |
2022 - 2032 |
|
Quantitative units |
Revenue in USD billion, volume in kilotons, and CAGR from 2022 to 2032 |
|
Report coverage |
Revenue forecast, volume forecast, company ranking, competitive landscape, growth factors, and trends, Pricing Analysis |
|
Segments covered |
Product type, end use, material type, region. |
|
Regional scope |
North America; Western Europe, Eastern Europe, Middle East, Africa, ASEAN, South Asia, Rest of Asia, Australia and New Zealand. |
|
Country scope |
U.S.; Canada; Mexico; Germany; U.K.; France; Italy; Spain; Russia; Belgium; Poland; Czech Republic; China; India; Japan; Australia; Brazil; Argentina; Colombia; Saudi Arabia; UAE; Iran; South Africa. |
|
Key companies profiled |
Taiyo GmbH, Shanghai Freemen, LLC, Kemin Industries, Inc., AVT Tea Services, Naturalin Bio-Resources Co., Ltd., Nexira SAS, ETchem, Shudhanta Herbal Products, Berkem USA, Carrubba Incorporated and others. |
|
Customization scope |
Free report customization (equivalent to up to 8 analysts working days) with purchase. Addition or alteration to country, regional & segment scope. |
|
Pricing and purchase options |
Avail customized purchase options to meet your exact research needs. |
Key Segments Profiled in the Camellia Sinensis Leaf Extract Industry Survey
By Form:
- Powder
- Liquid
By Nature:
- Organic
- Natural
By Price:
- High Range
- Mid-Range
- Low Range
By Application:
- Skincare Products
- Hair Care Products
- Medicine
By End Use Industries:
- Cosmetics
- Medicine
- Others
By Region:
- North America
- Latin America
- Western Europe
- Eastern Europe
- APEJ
- Japan
- Middle East and Africa
Frequently Asked Questions
What is the Growth Outlook for the Camellia Sinensis Leaf Extract Market?
The camellia sinensis leaf extract market is predicted to move forward at a CAGR of 7.7% from 2022 to 2032.
Which Region Leads the Camellia Sinensis Leaf Extract Market?
North America region is expected to lead the camellia sinensis leaf extract market during the forecast period.
How much Growth Potential does the Camellia Sinensis Leaf Extract Market Hold?
The camellia sinensis leaf extract market is likely to hold a valuation of US$ 32.51 Billion by 2032.
Which is the Key Driver in the Camellia Sinensis Leaf Extract Market?
Cosmetic Industry is expected to be the key driver in the camellia sinensis leaf extract market.
Preview the report firsthand - request a free sample
Get SampleGet the brochure for pricing and purchase details.
Get PDFTable of Content
1. Executive Summary
1.1. Global Market Outlook
1.2. Demand-side Trends
1.3. Supply-side Trends
1.4. Technology Roadmap Analysis
1.5. Analysis and Recommendations
2. Market Overview
2.1. Market Coverage / Taxonomy
2.2. Market Definition / Scope / Limitations
3. Market Background
3.1. Market Dynamics
3.1.1. Drivers
3.1.2. Restraints
3.1.3. Opportunity
3.1.4. Trends
3.2. Scenario Forecast
3.2.1. Demand in Optimistic Scenario
3.2.2. Demand in Likely Scenario
3.2.3. Demand in Conservative Scenario
3.3. Opportunity Map Analysis
3.4. Product Life Cycle Analysis
3.5. Supply Chain Analysis
3.5.1. Supply Side Participants and their Roles
3.5.1.1. Producers
3.5.1.2. Mid-Level Participants (Traders/ Agents/ Brokers)
3.5.1.3. Wholesalers and Distributors
3.5.2. Value Added and Value Created at Node in the Supply Chain
3.5.3. List of Raw Material Suppliers
3.5.4. List of Existing and Potential Buyer’s
3.6. Investment Feasibility Matrix
3.7. Value Chain Analysis
3.7.1. Profit Margin Analysis
3.7.2. Wholesalers and Distributors
3.7.3. Retailers
3.8. PESTLE and Porter’s Analysis
3.9. Regulatory Landscape
3.9.1. By Key Regions
3.9.2. By Key Countries
3.10. Regional Parent Market Outlook
3.11. Production and Consumption Statistics
3.12. Import and Export Statistics
4. Global Camellia Sinensis Leaf Extract Market Analysis 2017-2021 and Forecast, 2022-2032
4.1. Historical Market Size Value (US$ Mn) & Volume (Tons) Analysis, 2017-2021
4.2. Current and Future Market Size Value (US$ Mn) & Volume (Tons) Projections, 2022-2032
4.2.1. Y-o-Y Growth Trend Analysis
4.2.2. Absolute $ Opportunity Analysis
5. Global Camellia Sinensis Leaf Extract Market Analysis 2017-2021 and Forecast 2022-2032, By Type
5.1. Introduction / Key Findings
5.2. Historical Market Size Value (US$ Mn) & Volume (Tons) Analysis By Type, 2017-2021
5.3. Current and Future Market Size Value (US$ Mn) & Volume (Tons) Analysis and Forecast By Type, 2022-2032
5.3.1. Powder
5.3.2. Liquid
5.4. Y-o-Y Growth Trend Analysis By Type, 2017-2021
5.5. Absolute $ Opportunity Analysis By Type, 2022-2032
6. Global Camellia Sinensis Leaf Extract Market Analysis 2017-2021 and Forecast 2022-2032, By Application
6.1. Introduction / Key Findings
6.2. Historical Market Size Value (US$ Mn) & Volume (Tons) Analysis By Application, 2017-2021
6.3. Current and Future Market Size Value (US$ Mn) & Volume (Tons) Analysis and Forecast By Application, 2022-2032
6.3.1. Personal Care Industry
6.3.2. Pharmaceutical Industry
6.3.3. Others
6.4. Y-o-Y Growth Trend Analysis By Application, 2017-2021
6.5. Absolute $ Opportunity Analysis By Application, 2022-2032
7. Global Camellia Sinensis Leaf Extract Market Analysis 2017-2021 and Forecast 2022-2032, By Region
7.1. Introduction
7.2. Historical Market Size Value (US$ Mn) & Volume (Tons) Analysis By Region, 2017-2021
7.3. Current Market Size Value (US$ Mn) & Volume (Tons) Analysis and Forecast By Region, 2022-2032
7.3.1. North America
7.3.2. Latin America
7.3.3. Europe
7.3.4. Asia Pacific
7.3.5. Middle East and Africa
7.4. Market Attractiveness Analysis By Region
8. North America Camellia Sinensis Leaf Extract Market Analysis 2017-2021 and Forecast 2022-2032, By Country
8.1. Historical Market Size Value (US$ Mn) & Volume (Tons) Trend Analysis By Market Taxonomy, 2017-2021
8.2. Market Size Value (US$ Mn) & Volume (Tons) Forecast By Market Taxonomy, 2022-2032
8.2.1. By Country
8.2.1.1. U.S.
8.2.1.2. Canada
8.2.2. By Type
8.2.3. By Application
8.3. Market Attractiveness Analysis
8.3.1. By Country
8.3.2. By Type
8.3.3. By Application
8.4. Key Takeaways
9. Latin America Camellia Sinensis Leaf Extract Market Analysis 2017-2021 and Forecast 2022-2032, By Country
9.1. Historical Market Size Value (US$ Mn) & Volume (Tons) Trend Analysis By Market Taxonomy, 2017-2021
9.2. Market Size Value (US$ Mn) & Volume (Tons) Forecast By Market Taxonomy, 2022-2032
9.2.1. By Country
9.2.1.1. Brazil
9.2.1.2. Mexico
9.2.1.3. Argentina
9.2.1.4. Chile
9.2.1.5. Peru
9.2.1.6. Rest of Latin America
9.2.2. By Type
9.2.3. By Application
9.3. Market Attractiveness Analysis
9.3.1. By Country
9.3.2. By Type
9.3.3. By Application
9.4. Key Takeaways
10. Europe Camellia Sinensis Leaf Extract Market Analysis 2017-2021 and Forecast 2022-2032, By Country
10.1. Historical Market Size Value (US$ Mn) & Volume (Tons) Trend Analysis By Market Taxonomy, 2017-2021
10.2. Market Size Value (US$ Mn) & Volume (Tons) Forecast By Market Taxonomy, 2022-2032
10.2.1. By Country
10.2.1.1. Germany
10.2.1.2. Italy
10.2.1.3. France
10.2.1.4. U.K.
10.2.1.5. Spain
10.2.1.6. Russia
10.2.1.7. BENELUX
10.2.1.8. Rest of Europe
10.2.2. By Type
10.2.3. By Application
10.3. Market Attractiveness Analysis
10.3.1. By Country
10.3.2. By Type
10.3.3. By Application
10.4. Key Takeaways
11. Asia Pacific Camellia Sinensis Leaf Extract Market Analysis 2017-2021 and Forecast 2022-2032, By Country
11.1. Historical Market Size Value (US$ Mn) & Volume (Tons) Trend Analysis By Market Taxonomy, 2017-2021
11.2. Market Size Value (US$ Mn) & Volume (Tons) Forecast By Market Taxonomy, 2022-2032
11.2.1. By Country
11.2.1.1. China
11.2.1.2. Japan
11.2.1.3. South Korea
11.2.1.4. Rest of Asia Pacific
11.2.2. By Type
11.2.3. By Application
11.3. Market Attractiveness Analysis
11.3.1. By Country
11.3.2. By Type
11.3.3. By Application
11.4. Key Takeaways
12. Middle East and Africa Camellia Sinensis Leaf Extract Market Analysis 2017-2021 and Forecast 2022-2032, By Country
12.1. Historical Market Size Value (US$ Mn) & Volume (Tons) Trend Analysis By Market Taxonomy, 2017-2021
12.2. Market Size Value (US$ Mn) & Volume (Tons) Forecast By Market Taxonomy, 2022-2032
12.2.1. By Country
12.2.1.1. GCC Countries
12.2.1.2. South Africa
12.2.1.3. Turkey
12.2.1.4. Rest of Middle East and Africa
12.2.2. By Type
12.2.3. By Application
12.3. Market Attractiveness Analysis
12.3.1. By Country
12.3.2. By Type
12.3.3. By Application
12.4. Key Takeaways
13. Key Countries Camellia Sinensis Leaf Extract Market Analysis
13.1. U.S.
13.1.1. Pricing Analysis
13.1.2. Market Share Analysis, 2021
13.1.2.1. By Type
13.1.2.2. By Application
13.2. Canada
13.2.1. Pricing Analysis
13.2.2. Market Share Analysis, 2021
13.2.2.1. By Type
13.2.2.2. By Application
13.3. Brazil
13.3.1. Pricing Analysis
13.3.2. Market Share Analysis, 2021
13.3.2.1. By Type
13.3.2.2. By Application
13.4. Mexico
13.4.1. Pricing Analysis
13.4.2. Market Share Analysis, 2021
13.4.2.1. By Type
13.4.2.2. By Application
13.5. Argentina
13.5.1. Pricing Analysis
13.5.2. Market Share Analysis, 2021
13.5.2.1. By Type
13.5.2.2. By Application
13.6. Chile
13.6.1. Pricing Analysis
13.6.2. Market Share Analysis, 2021
13.6.2.1. By Type
13.6.2.2. By Application
13.7. Peru
13.7.1. Pricing Analysis
13.7.2. Market Share Analysis, 2021
13.7.2.1. By Type
13.7.2.2. By Application
13.8. Germany
13.8.1. Pricing Analysis
13.8.2. Market Share Analysis, 2021
13.8.2.1. By Type
13.8.2.2. By Application
13.9. Italy
13.9.1. Pricing Analysis
13.9.2. Market Share Analysis, 2021
13.9.2.1. By Type
13.9.2.2. By Application
13.10. France
13.10.1. Pricing Analysis
13.10.2. Market Share Analysis, 2021
13.10.2.1. By Type
13.10.2.2. By Application
13.11. U.K.
13.11.1. Pricing Analysis
13.11.2. Market Share Analysis, 2021
13.11.2.1. By Type
13.11.2.2. By Application
13.12. Spain
13.12.1. Pricing Analysis
13.12.2. Market Share Analysis, 2021
13.12.2.1. By Type
13.12.2.2. By Application
13.13. Russia
13.13.1. Pricing Analysis
13.13.2. Market Share Analysis, 2021
13.13.2.1. By Type
13.13.2.2. By Application
13.14. BENELUX
13.14.1. Pricing Analysis
13.14.2. Market Share Analysis, 2021
13.14.2.1. By Type
13.14.2.2. By Application
13.15. China
13.15.1. Pricing Analysis
13.15.2. Market Share Analysis, 2021
13.15.2.1. By Type
13.15.2.2. By Application
13.16. Japan
13.16.1. Pricing Analysis
13.16.2. Market Share Analysis, 2021
13.16.2.1. By Type
13.16.2.2. By Application
13.17. South Korea
13.17.1. Pricing Analysis
13.17.2. Market Share Analysis, 2021
13.17.2.1. By Type
13.17.2.2. By Application
13.18. GCC Countries
13.18.1. Pricing Analysis
13.18.2. Market Share Analysis, 2021
13.18.2.1. By Type
13.18.2.2. By Application
13.19. South Africa
13.19.1. Pricing Analysis
13.19.2. Market Share Analysis, 2021
13.19.2.1. By Type
13.19.2.2. By Application
13.20. Turkey
13.20.1. Pricing Analysis
13.20.2. Market Share Analysis, 2021
13.20.2.1. By Type
13.20.2.2. By Application
14. Market Structure Analysis
14.1. Competition Dashboard
14.2. Competition Benchmarking
14.3. Market Share Analysis of Top Players
14.3.1. By Regional
14.3.2. By Type
14.3.3. By Application
15. Competition Analysis
15.1. Competition Deep Dive
15.1.1. Kemin Industries
15.1.1.1. Overview
15.1.1.2. Product Portfolio
15.1.1.3. Profitability by Market Segments
15.1.1.4. Sales Footprint
15.1.1.5. Strategy Overview
15.1.1.5.1. Marketing Strategy
15.1.1.5.2. Product Strategy
15.1.1.5.3. Channel Strategy
15.1.2. Naturalin Bio-Resources
15.1.2.1. Overview
15.1.2.2. Product Portfolio
15.1.2.3. Profitability by Market Segments
15.1.2.4. Sales Footprint
15.1.2.5. Strategy Overview
15.1.2.5.1. Marketing Strategy
15.1.2.5.2. Product Strategy
15.1.2.5.3. Channel Strategy
15.1.3. Nexira
15.1.3.1. Overview
15.1.3.2. Product Portfolio
15.1.3.3. Profitability by Market Segments
15.1.3.4. Sales Footprint
15.1.3.5. Strategy Overview
15.1.3.5.1. Marketing Strategy
15.1.3.5.2. Product Strategy
15.1.3.5.3. Channel Strategy
15.1.4. ETchem
15.1.4.1. Overview
15.1.4.2. Product Portfolio
15.1.4.3. Profitability by Market Segments
15.1.4.4. Sales Footprint
15.1.4.5. Strategy Overview
15.1.4.5.1. Marketing Strategy
15.1.4.5.2. Product Strategy
15.1.4.5.3. Channel Strategy
15.1.5. Berkem
15.1.5.1. Overview
15.1.5.2. Product Portfolio
15.1.5.3. Profitability by Market Segments
15.1.5.4. Sales Footprint
15.1.5.5. Strategy Overview
15.1.5.5.1. Marketing Strategy
15.1.5.5.2. Product Strategy
15.1.5.5.3. Channel Strategy
15.1.6. Carrubba
15.1.6.1. Overview
15.1.6.2. Product Portfolio
15.1.6.3. Profitability by Market Segments
15.1.6.4. Sales Footprint
15.1.6.5. Strategy Overview
15.1.6.5.1. Marketing Strategy
15.1.6.5.2. Product Strategy
15.1.6.5.3. Channel Strategy
16. Assumptions & Acronyms Used
17. Research Methodology


