Reports

- Global Locations -

Headquarters

Future Market Insights, Inc.

Christiana Corporate, 200
Continental Drive, Suite 401,
Newark, Delaware - 19713,
United States

T: +1-845-579-5705

Americas

Future Market Insights, Inc.

616 Corporate Way, Suite 2-9018,
Valley Cottage, NY 10989, United States

T: +1-347-918-3531

MEA

Future Market Insights

1602-6 Jumeirah Bay X2 Tower, Plot No: JLT-PH2-X2A,
Jumeirah Lakes Towers, Dubai,
United Arab Emirates

Europe

Future Market Insights

3rd Floor, 207 Regent Street,
W1B 3HH London
United Kingdom

T: + 44 (0) 20 8123 9659
D: +44 (0) 20 3287 4268

Asia Pacific

Future Market Insights

IndiaLand Global Tech Park, Unit UG-1, Behind Grand HighStreet, Phase 1, Hinjawadi, MH, Pune – 411057, India

Global Calcite Market Snapshot (2023 to 2033)

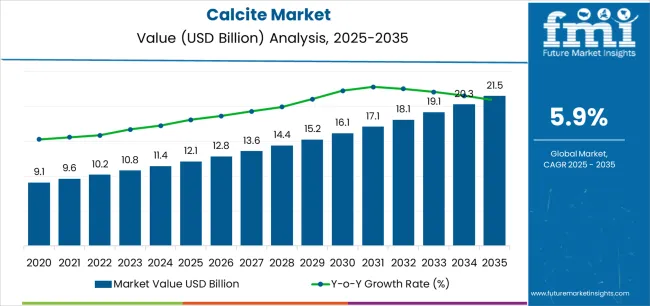
In 2022, the global calcite market was estimated to have acquired US$ 10.76 billion. The calcite market's development is projected to be primarily driven by the rising demand for plastic and paper packaging.This has resulted to an expected sum of US$ 20.22 billion by 2033, garnering a CAGR of 5.9% during the forecast period, 2023 to 2033.

Calcite is one of the most frequently utilized minerals in the whole mineral industry given its special qualities. It is widely used as a raw material in the building and agriculture industries. The calcite market has expanded as a result of a consistent rise in calcite demand, particularly from the cement and agricultural sectors.

Due to its application in the production of goods including cables, PVC pipes, plastic moldings, and plastic films, "ground calcium carbonate (GCC)" is the type sector with the quickest growth. During the projected period of 2023 to 2033, the expanding population and increasing urbanization will offer the major prospects for current and emerging commercial as well as industrial uses of calcite.

The calcite market has been witnessing significant growth over the last few years. This growth trend is projected to continue over the next decade due to increasing use of calcium carbonate across various applications. Calcite ore exhibits usefulness across diverse applications in agricultural, construction, and other industries. The increasing population and rapid urbanization will offer significant opportunities for ongoing and upcoming Industrial and commercial applications of calcite in the coming years.

Attribute Details
Estimated Market Value (2022) US$ 10.76 billion
Expected Market Value (2023) US$ 11.4 billion
Projected Forecast Value (2033) US$ 20.22 billion
Anticipated Growth Rate (2023 to 2033) 5.9%

Don't pay for what you don't need

Customize your report by selecting specific countries or regions and save 30%!

Global Calcite Market Historical Analysis (2018 To 2022) Vs. Forecast Outlook (2023 To 2033)

According to the study, the global calcite market has seen a steady growth in the agricultural sector. This trend is observed in countries across North American and Western Europe. Rising construction activities in both regions will aid sales growth of fine GCC, which is increasingly used in the paint and coatings and polymers and plastics industry.

Reducing the particles size and achieve more cost efficient solution has always been one of the prime concerns of researchers. Choosing a correct Calcite type for specific application has been difficult for end-use industries, hence, manufacturers have been focusing on improving overall quality to cater to specific industry requirements.

The market is likely to gain significant impetus from the launch of new calcite with advanced properties in the near future. Changes such as reduction in particle size could support overall expansion of the market. This will not only help end users to tackle price concerns but will enable them achieve more product efficiency.

Some of the leading manufacturers already have launched on site Calcite processing plants and several others are likely to follow the suit to keep pace with dynamic environment and therefore stand at the top of the line.

According to FMI, calcite sales have grown at a 4.8% CAGR between 2018 and 2022. Calcite application has been consistently increasing in agricultural, construction and industrial sectors. The acid paper production has been reduced and thus calcite has proven to be an effective alternative to the titanium dioxide. Rising demand for fertilizers coupled with the increase in the production of agrochemicals in the APEJ will result in the increase in demand for calcite over the forecast period.

What is Primarily Driving the Market for Calcite?

Increasing Demand from the Construction Sector to Aid Growth

The growth in the construction industry is expected to have high impact on the demand for calcite in the building materials market. The demand for building materials is increasing due to the ongoing constructions activities in both commercial and residential sectors. The cement production has been increasing significantly in recent years owing to the high investment in infrastructure development activities.

This has emerged as a chief factor fuelling the demand for calcite in countries such as China, UAE, Saudi Arabia, India, and others. Thus, the increasing use of building materials and cement in these countries will significantly affect calcite market growth.

Market Players Focusing on Research and Developments is Driving the Growth

Some of the leading manufacturers of calcite are investing more on research and development (R&D) activities to producer finer quality. Competitive price offering, ensuring finer quality, and use of advanced technologies are some of the outcomes of R&D activities undertaken by companies. In modern construction activities, calcite is used in the form of marble and limestone.

Market players have been increasingly focusing on research and development activities to gain edge over competition witnessed. For instance, Omya AG not much time ago introduced a new product line under the brand name Aquarate to gain traction.

Nikhil Kaitwade
Nikhil Kaitwade

Principal Consultant

Talk to Analyst

Find your sweet spots for generating winning opportunities in this market.

Category-wise Insights

Which Type of Calcite are Selling More?

The Ground Calcium Carbonate is likely to Gain a Significant Share

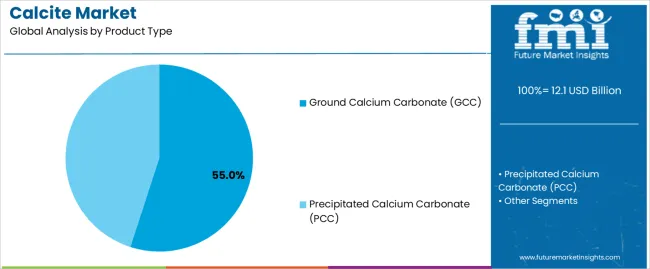
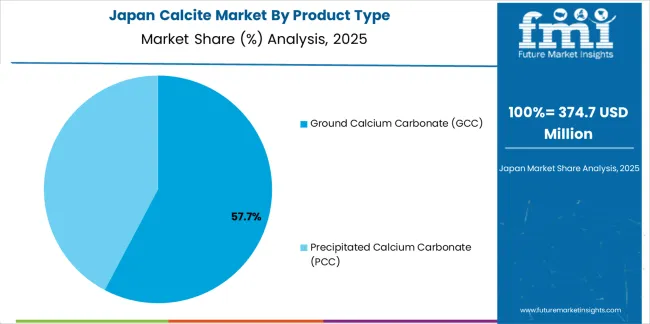
Ground calcium carbonate (GCC) segment by far, is expected to dominate the market in terms of type and have gained a 65% market share in 2022. This is mainly attributable to the growing demand for filler materials in the polymer and plastics industry.

These materials are usually used in the manufacturing of products such as cables, PVC pipes, plastic moldings, and plastic films. The PCC segment is anticipated to grow due to increasing demand in the paper and pulp industry. These unique properties will help the segment to gain considerable momentum with key players constantly designing, developing, and launching new products.

Which is the Preferred Size for Calcite?

Fine Size Particles is Anticipated to Gain a Dominant Share

Calcite manufacturers are emphasizing on reduction of particle sizes in order to save the costs and achieve more product efficiency. This can be attributed to the high growth of fine size segment.

The fine size segment dominates the volume share in the end-use applications with a CAGR of 5.5% from 2023 to 2033 while, the growth of coarse size segment is owing to the demand from the cement and agricultural industry.

What is the Preferred Application Type Calcite in Terms of Nature?

The Industrial Sector to Push the Sales of Calcite from 2023 to 2033

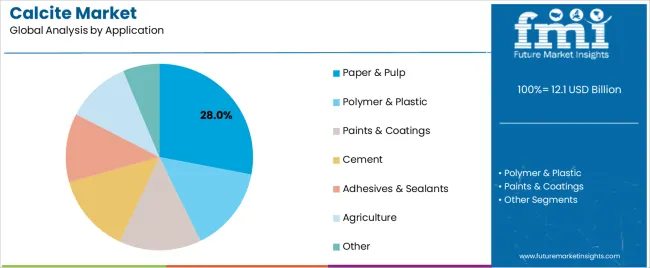
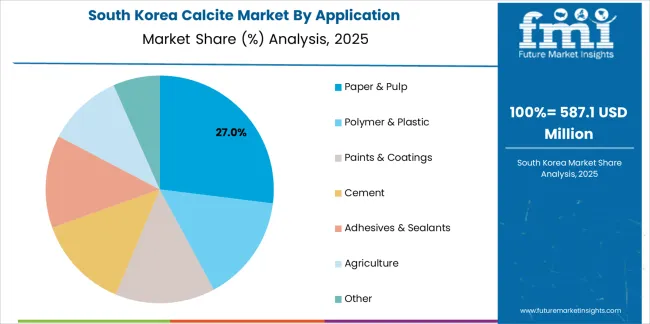
The industrial sector held the leading share of 67% in 2022 in the global Calcite market owing to the increasing demand in new ongoing and upcoming industrial projects across the globe. Some of the leading segments exhibiting high demand are paper and pulp, paints and coatings, polymer and plastics and cement. The demand from polymer and paints industry is expected to remain considerably high.

Increasing demand for the PVC pipes and other thermoplastic materials has boosted the production of the polymers and plastics owing to which the demand for the calcite is increasing. The demand from paper and pulp industry is expected to surge considerably in the coming years. According to FMI, the paper and pulp industry will remain the dominant application segment through the forecast period.

Comparative View of the Adjacent Markets

Calcite Market:

Attributes Calcite Market
CAGR (2023 to 2033) 5.9%
Market Value 2023 US$ 11.4 billion
Growth Factor Calcite ore is used for a variety of tasks in the building, agriculture, and other sectors.
Future Opportunities In the following years, there will be several potential for current and future commercial and industrial uses of calcite due to the rising population and expanding urbanization.
Market Trends End-use industries have found it challenging to select the right calcite type for a certain application; as a result, producers have been concentrating on enhancing overall quality to meet particular industrial needs.

Calcium Oxide Market:

Attributes Calcium Oxide Market
CAGR (2023 to 2033) 12.3%
Market Value 2023 US$ 11.65 billion
Growth Factor The broad application of calcium oxide in heavy industries is a key factor in the market's growth.
Future Opportunities Calcium oxide is used to extract impurities by the flotation of various metal salts in the manufacture of copper, zinc, lead, silver, gold, uranium, nickel, and other metals. The market's projected need for lime is being supported by demand from the steel sector.
Market Trends The demand for calcium oxide is anticipated to increase due to the steel and cement sectors' phenomenal expansion.

Calcium Acetate Market:

Attributes Calcium Acetate Market
CAGR (2023 to 2033) 5.4%
Market Value 2023 US$ 5.4 billion
Growth Factor One of the most significant pharmacological uses of calcium acetate is in the treatment of hypophosphatemia.
Future Opportunities Through the projection period, the utilization of calcium acetate in the production of anti-epileptic medications will go up significantly.
Market Trends Calcium acetate is used as a concrete accelerator by participants in the building and construction sector. Calcium acetate is also used in detergent as well as wastewater treatment.

Get the data you need at a Fraction of the cost

Personalize your report by choosing insights you need
and save 40%!

Region-wise Analysis

How Big is the Opportunity in the United States?

Various Government Policies and Commercial Projects to Boost the Sales

FMI has projected North America to remain one of the most remunerative and paying markets throughout the course of the forecast period. One of the key factors supporting enhancement is the growth in construction industry in the United States. New commercial projects in the country are expected to increase the total sales of calcite in the forecast period as the United States is one of the second leading countries in construction gross value added index.

Commodity prices moved towards stability, creating sustainable market opportunities across regions and translating into positive effects on the global construction industry. Backed by these factors the United States remains one of the largest markets for Calcite in the world.

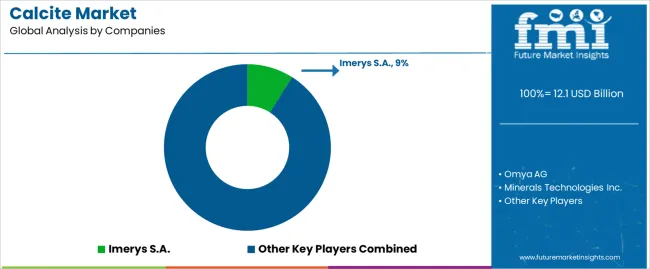
Favorable policies, coupled with high per capita spending, have created a conducive environment for the growth of calcite industry in theUnited States. The presence of leading players such as Imerys S. A. , Omya AG, and J. M. Huber Corporation is supporting growth in the United States Strategies undertaken by these companies include product launches and expansion plans, which will continue aiding overall expansion in the country.

Why Construction Industry is Key to Success in India Calcite Market?

Residential and Construction Projects are Propelling the Calcite Demand Regionally

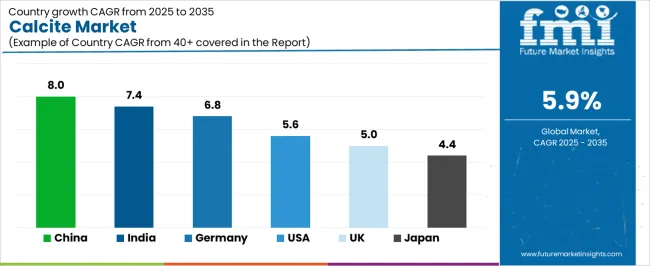
The India calcite market is accounts for the largest share in the Asia Pacific. Increasing investment in residential and commercial construction projects will aid expansion in India. Uttar Pradesh (state of India) is a major producer of PCC, GCC, and activated calcium carbonate. India will thus continue offering attractive opportunities for the growth of the market.

What will be the Outlook of the Middle Eastern Countries for the Sales of Calcite?

Tourism in Middle Eastern Countries is Tied Closely to Calcite Market Growth

Gulf Cooperation Council (GCC) countries such as the United Arab Emirates, Saudi Arabia, Bahrain, Kuwait, Oman, and Qatar with large scale residential and commercial projects has attracted the global tourists with unique designs and features. The Middle East countries’ vision program towards increasing non-oil economic growth has been creating the significant opportunities in global market.

he cement production has been increasing significantly in recent years owing to the high infrastructure development activities being carried out in the GCC countries such as UAE, Saudi Arabia, etc. The growth of cement production will certainly have a positive impact on the calcite demand in GCC countries.

Which Application Holds Maximum Potential for Calcite Market Growth in China?

High Production of Plastics and Polymers to Boost Sales

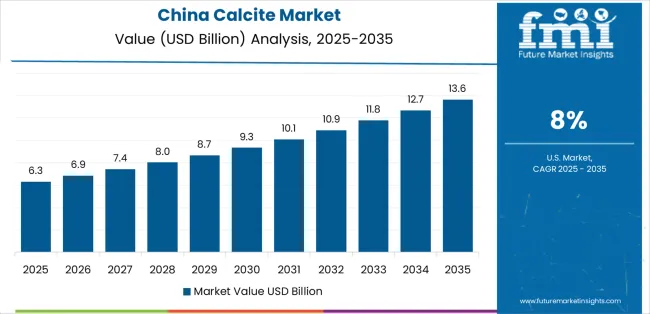
China is a key market that accounts for a major share in the global calcite market. The market in China is projected to witness significant growth over the forecast period. There has been extraordinary surge in sales of calcite from 2016 to present day and this trend expected continue through the forecast period 2023 to 2033.

An increase in residential and commercial projects across the country has been driving sales growth besides the presence of numerous calcite manufacturers in China. Growing production of polymers and plastics and adhesives and sealants is expected to drive the demand for Calcite in China. In addition to this, the increasing demand from the paper and pulp industry is expected to boost sales of PCC in the country.

Will Germany Emerge as a Significant Market for Calcite?

Germany’s Calcite Demand Will Continue to Rise Steadily

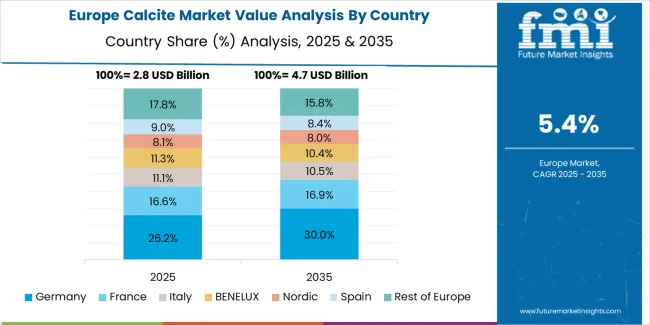
The adoption of calcite is expected to rise considerably across various end-use industries in Germany. The demand is expected rise in demand is projected to come from the polymers and plastics, adhesives and sealants and paints and coatings industries.Expanding construction activities will remain a chief driver of growth.

According to the Federal Statistics Office, Destatis, the construction sector turnover in Germany was by 2.2% in October 2022. With trends favoring expansion of the construction sector, the demand for calcite is expected to increase significantly in Germany.

Market Competition

The calcite market is a moderately competitive. There is ample focus on strong research and development activities. Companies operating in the calcite market are aiming at strategic collaborations with end users and regional distributors to address the requirements of an expanding customer base.

The key players in this market include:

  • Imerys S. A.
  • Omya AG
  • J. M. Huber Corporation
  • Minerals Technologies Inc.
  • Gulshan Polyol Ltd.
  • ASEC Company for Mining
  • Esen Mikronize A.S
  • Wolkem India Ltd.
  • Shandong CITIC Calcium Industry Co. Ltd.
  • Columbia River Carbonates
  • Jay Minerals
  • Golden Lime Public Co. Ltd.
  • Longcliffe Quarries Ltd.
  • Vietnam CMT Joint Stock Company
  • Mississippi Lime Company

Some key developments initiated by the key players are as follows:

  • Imerys began exclusive agreements with Syntagma Capital in September 2022 for the sale of the majority of its assets that produce kaolin, precipitated calcium carbonate ("PCC"), ground calcium carbonate ("GCC"), as well as talc, which mainly serves the paper marketplace, for a market value of EUR 390 million (US$ 424 million), which includes an earn-out contingent upon future business performance.
  • Omya International AG and Idwala Industrial Holdings Ltd. have entered into a joint venture in South Africa. The joint venture is intended at enabling access to the broad portfolio of calcium carbonate and specialty chemical products
  • Biesterfeld and Omya inked a contract in May 2020 for the distribution of organic calcium carbonate to supply the nutraceutical and pharmaceutical sectors.

Report Scope

Attribute Details
Growth Rate CAGR of 5.9% from 2022 to 2032
Market value in 2023 US$ 11.4 billion
Market value in 2033 US$ 20.22 billion
Base Year for Estimation 2022
Historical Data 2018 to 2022
Forecast Period 2023 to 2033
Quantitative Units US$ billion for value
Report Coverage Revenue Forecast, Volume Forecast, Company Ranking, Competitive Landscape, Growth Factors, Trends, and Pricing Analysis
Segments Covered
  • Type
  • Size
  • Application
  • Region
Regions Covered
  • North America
  • Latin America
  • Europe
  • Asia Pacific
  • Middle East and Africa
Key Countries Profiled
  • United States
  • Canada
  • Mexico
  • Brazil
  • Germany
  • United Kingdom
  • France
  • Spain
  • Italy
  • Japan
  • China
  • Singapore
  • Thailand
  • Indonesia
  • Israel
  • GCC countries
  • South Africa
  • Australia
  • New Zealand
Key Companies Profiled
  • Imerys S. A.
  • Omya AG
  • J. M. Huber Corporation
  • Minerals Technologies Inc.
  • Gulshan Polyol Ltd.
  • ASEC Company for Mining
  • Esen Mikronize A.S
  • Wolkem India Ltd.
  • Shandong CITIC Calcium Industry Co. Ltd.
  • Columbia River Carbonates
  • Jay Minerals
  • Golden Lime Public Co. Ltd.
  • Longcliffe Quarries Ltd.
  • Vietnam CMT Joint Stock Company
  • Mississippi Lime Company
Customization & Pricing Available upon Request

Key Segments Profiled in the Global Calcite Market

By Type:

  • Ground Calcium Carbonate (GCC)
  • Precipitated Calcium Carbonate (PCC)

By Size:

  • Fine
  • Coarse

By Application:

  • Paper & Pulp
  • Polymer & plastic
  • Paints & Coatings
  • Cement
  • Adhesives & Sealants
  • Agriculture
  • Other

By Region:

  • North America
  • Latin America
  • Europe
  • Asia Pacific
  • Middle East and Africa

Frequently Asked Questions

Which are the Key Asian Countries in the Global Calcite Market?

China, India, and Japan are key Asian countries.

Which Industry is the Key Consumer of Global Calcite Market?

The construction sector is the primary consumer of the worldwide calcite market.

What Regions Contribute Significantly to the Global calcite market?

Asia Pacific and North America are dominating the market for calcite.

What is Current Market Valuation of Global Calcite Market?

The current market size for calcite is $10.76 billion worldwide.

How Big will be the Global Calcite Market by 2033?

The global calcite market is anticipated to be valued at US$ 20.22 billion by 2033.

Table of Content

1. Executive Summary

    1.1. Global Market Outlook

    1.2. Demand-side Trends

    1.3. Supply-side Trends

    1.4. Technology Roadmap Analysis

    1.5. Analysis and Recommendations

2. Market Overview

    2.1. Market Coverage / Taxonomy

    2.2. Market Definition / Scope / Limitations

3. Market Background

    3.1. Market Dynamics

        3.1.1. Drivers

        3.1.2. Restraints

        3.1.3. Opportunity

        3.1.4. Trends

    3.2. Scenario Forecast

        3.2.1. Demand in Optimistic Scenario

        3.2.2. Demand in Likely Scenario

        3.2.3. Demand in Conservative Scenario

    3.3. Opportunity Map Analysis

    3.4. Product Life Cycle Analysis

    3.5. Supply Chain Analysis

        3.5.1. Supply Side Participants and their Roles

            3.5.1.1. Producers

            3.5.1.2. Mid-Level Participants (Traders/ Agents/ Brokers)

            3.5.1.3. Wholesalers and Distributors

        3.5.2. Value Added and Value Created at Node in the Supply Chain

        3.5.3. List of Raw Material Suppliers

        3.5.4. List of Existing and Potential Buyer’s

    3.6. Investment Feasibility Matrix

    3.7. Value Chain Analysis

        3.7.1. Profit Margin Analysis

        3.7.2. Wholesalers and Distributors

        3.7.3. Retailers

    3.8. PESTLE and Porter’s Analysis

    3.9. Regulatory Landscape

        3.9.1. By Key Regions

        3.9.2. By Key Countries

    3.10. Regional Parent Market Outlook

    3.11. Production and Consumption Statistics

    3.12. Import and Export Statistics

4. Global Market Analysis 2018 to 2022 and Forecast, 2023 to 2033

    4.1. Historical Market Size Value (US$ Million) & Volume (Tons) Analysis, 2018 to 2022

    4.2. Current and Future Market Size Value (US$ Million) & Volume (Tons) Projections, 2023 to 2033

        4.2.1. Y-o-Y Growth Trend Analysis

        4.2.2. Absolute $ Opportunity Analysis

5. Global Market Analysis 2018 to 2022 and Forecast 2023 to 2033, By Type

    5.1. Introduction / Key Findings

    5.2. Historical Market Size Value (US$ Million) & Volume (Tons) Analysis By Type, 2018 to 2022

    5.3. Current and Future Market Size Value (US$ Million) & Volume (Tons) Analysis and Forecast By Type, 2023 to 2033

        5.3.1. Ground Calcium Carbonate (GCC)

        5.3.2. Precipitated Calcium Carbonate (PCC)

    5.4. Y-o-Y Growth Trend Analysis By Type, 2018 to 2022

    5.5. Absolute $ Opportunity Analysis By Type, 2023 to 2033

6. Global Market Analysis 2018 to 2022 and Forecast 2023 to 2033, By Size

    6.1. Introduction / Key Findings

    6.2. Historical Market Size Value (US$ Million) & Volume (Tons) Analysis By Size, 2018 to 2022

    6.3. Current and Future Market Size Value (US$ Million) & Volume (Tons) Analysis and Forecast By Size, 2023 to 2033

        6.3.1. Fine

        6.3.2. Coarse

    6.4. Y-o-Y Growth Trend Analysis By Size, 2018 to 2022

    6.5. Absolute $ Opportunity Analysis By Size, 2023 to 2033

7. Global Market Analysis 2018 to 2022 and Forecast 2023 to 2033, By Application

    7.1. Introduction / Key Findings

    7.2. Historical Market Size Value (US$ Million) & Volume (Tons) Analysis By Application, 2018 to 2022

    7.3. Current and Future Market Size Value (US$ Million) & Volume (Tons) Analysis and Forecast By Application, 2023 to 2033

        7.3.1. Paper & Pulp

        7.3.2. Polymer & plastic

        7.3.3. Paints & Coatings

        7.3.4. Cement

        7.3.5. Adhesives & Sealants

        7.3.6. Agriculture

        7.3.7. Others

    7.4. Y-o-Y Growth Trend Analysis By Application, 2018 to 2022

    7.5. Absolute $ Opportunity Analysis By Application, 2023 to 2033

8. Global Market Analysis 2018 to 2022 and Forecast 2023 to 2033, By Region

    8.1. Introduction

    8.2. Historical Market Size Value (US$ Million) & Volume (Tons) Analysis By Region, 2018 to 2022

    8.3. Current Market Size Value (US$ Million) & Volume (Tons) Analysis and Forecast By Region, 2023 to 2033

        8.3.1. North America

        8.3.2. Latin America

        8.3.3. Europe

        8.3.4. Asia Pacific

        8.3.5. MEA

    8.4. Market Attractiveness Analysis By Region

9. North America Market Analysis 2018 to 2022 and Forecast 2023 to 2033, By Country

    9.1. Historical Market Size Value (US$ Million) & Volume (Tons) Trend Analysis By Market Taxonomy, 2018 to 2022

    9.2. Market Size Value (US$ Million) & Volume (Tons) Forecast By Market Taxonomy, 2023 to 2033

        9.2.1. By Country

            9.2.1.1. The USA

            9.2.1.2. Canada

        9.2.2. By Type

        9.2.3. By Size

        9.2.4. By Application

    9.3. Market Attractiveness Analysis

        9.3.1. By Country

        9.3.2. By Type

        9.3.3. By Size

        9.3.4. By Application

    9.4. Key Takeaways

10. Latin America Market Analysis 2018 to 2022 and Forecast 2023 to 2033, By Country

    10.1. Historical Market Size Value (US$ Million) & Volume (Tons) Trend Analysis By Market Taxonomy, 2018 to 2022

    10.2. Market Size Value (US$ Million) & Volume (Tons) Forecast By Market Taxonomy, 2023 to 2033

        10.2.1. By Country

            10.2.1.1. Brazil

            10.2.1.2. Mexico

            10.2.1.3. Rest of Latin America

        10.2.2. By Type

        10.2.3. By Size

        10.2.4. By Application

    10.3. Market Attractiveness Analysis

        10.3.1. By Country

        10.3.2. By Type

        10.3.3. By Size

        10.3.4. By Application

    10.4. Key Takeaways

11. Europe Market Analysis 2018 to 2022 and Forecast 2023 to 2033, By Country

    11.1. Historical Market Size Value (US$ Million) & Volume (Tons) Trend Analysis By Market Taxonomy, 2018 to 2022

    11.2. Market Size Value (US$ Million) & Volume (Tons) Forecast By Market Taxonomy, 2023 to 2033

        11.2.1. By Country

            11.2.1.1. Germany

            11.2.1.2. United Kingdom

            11.2.1.3. France

            11.2.1.4. Spain

            11.2.1.5. Italy

            11.2.1.6. Rest of Europe

        11.2.2. By Type

        11.2.3. By Size

        11.2.4. By Application

    11.3. Market Attractiveness Analysis

        11.3.1. By Country

        11.3.2. By Type

        11.3.3. By Size

        11.3.4. By Application

    11.4. Key Takeaways

12. Asia Pacific Market Analysis 2018 to 2022 and Forecast 2023 to 2033, By Country

    12.1. Historical Market Size Value (US$ Million) & Volume (Tons) Trend Analysis By Market Taxonomy, 2018 to 2022

    12.2. Market Size Value (US$ Million) & Volume (Tons) Forecast By Market Taxonomy, 2023 to 2033

        12.2.1. By Country

            12.2.1.1. China

            12.2.1.2. Japan

            12.2.1.3. South Korea

            12.2.1.4. Singapore

            12.2.1.5. Thailand

            12.2.1.6. Indonesia

            12.2.1.7. Australia

            12.2.1.8. New Zealand

            12.2.1.9. Rest of Asia Pacific

        12.2.2. By Type

        12.2.3. By Size

        12.2.4. By Application

    12.3. Market Attractiveness Analysis

        12.3.1. By Country

        12.3.2. By Type

        12.3.3. By Size

        12.3.4. By Application

    12.4. Key Takeaways

13. MEA Market Analysis 2018 to 2022 and Forecast 2023 to 2033, By Country

    13.1. Historical Market Size Value (US$ Million) & Volume (Tons) Trend Analysis By Market Taxonomy, 2018 to 2022

    13.2. Market Size Value (US$ Million) & Volume (Tons) Forecast By Market Taxonomy, 2023 to 2033

        13.2.1. By Country

            13.2.1.1. GCC Countries

            13.2.1.2. South Africa

            13.2.1.3. Israel

            13.2.1.4. Rest of MEA

        13.2.2. By Type

        13.2.3. By Size

        13.2.4. By Application

    13.3. Market Attractiveness Analysis

        13.3.1. By Country

        13.3.2. By Type

        13.3.3. By Size

        13.3.4. By Application

    13.4. Key Takeaways

14. Key Countries Market Analysis

    14.1. USA

        14.1.1. Pricing Analysis

        14.1.2. Market Share Analysis, 2022

            14.1.2.1. By Type

            14.1.2.2. By Size

            14.1.2.3. By Application

    14.2. Canada

        14.2.1. Pricing Analysis

        14.2.2. Market Share Analysis, 2022

            14.2.2.1. By Type

            14.2.2.2. By Size

            14.2.2.3. By Application

    14.3. Brazil

        14.3.1. Pricing Analysis

        14.3.2. Market Share Analysis, 2022

            14.3.2.1. By Type

            14.3.2.2. By Size

            14.3.2.3. By Application

    14.4. Mexico

        14.4.1. Pricing Analysis

        14.4.2. Market Share Analysis, 2022

            14.4.2.1. By Type

            14.4.2.2. By Size

            14.4.2.3. By Application

    14.5. Germany

        14.5.1. Pricing Analysis

        14.5.2. Market Share Analysis, 2022

            14.5.2.1. By Type

            14.5.2.2. By Size

            14.5.2.3. By Application

    14.6. United Kingdom

        14.6.1. Pricing Analysis

        14.6.2. Market Share Analysis, 2022

            14.6.2.1. By Type

            14.6.2.2. By Size

            14.6.2.3. By Application

    14.7. France

        14.7.1. Pricing Analysis

        14.7.2. Market Share Analysis, 2022

            14.7.2.1. By Type

            14.7.2.2. By Size

            14.7.2.3. By Application

    14.8. Spain

        14.8.1. Pricing Analysis

        14.8.2. Market Share Analysis, 2022

            14.8.2.1. By Type

            14.8.2.2. By Size

            14.8.2.3. By Application

    14.9. Italy

        14.9.1. Pricing Analysis

        14.9.2. Market Share Analysis, 2022

            14.9.2.1. By Type

            14.9.2.2. By Size

            14.9.2.3. By Application

    14.10. China

        14.10.1. Pricing Analysis

        14.10.2. Market Share Analysis, 2022

            14.10.2.1. By Type

            14.10.2.2. By Size

            14.10.2.3. By Application

    14.11. Japan

        14.11.1. Pricing Analysis

        14.11.2. Market Share Analysis, 2022

            14.11.2.1. By Type

            14.11.2.2. By Size

            14.11.2.3. By Application

    14.12. South Korea

        14.12.1. Pricing Analysis

        14.12.2. Market Share Analysis, 2022

            14.12.2.1. By Type

            14.12.2.2. By Size

            14.12.2.3. By Application

    14.13. Singapore

        14.13.1. Pricing Analysis

        14.13.2. Market Share Analysis, 2022

            14.13.2.1. By Type

            14.13.2.2. By Size

            14.13.2.3. By Application

    14.14. Thailand

        14.14.1. Pricing Analysis

        14.14.2. Market Share Analysis, 2022

            14.14.2.1. By Type

            14.14.2.2. By Size

            14.14.2.3. By Application

    14.15. Indonesia

        14.15.1. Pricing Analysis

        14.15.2. Market Share Analysis, 2022

            14.15.2.1. By Type

            14.15.2.2. By Size

            14.15.2.3. By Application

    14.16. Australia

        14.16.1. Pricing Analysis

        14.16.2. Market Share Analysis, 2022

            14.16.2.1. By Type

            14.16.2.2. By Size

            14.16.2.3. By Application

    14.17. New Zealand

        14.17.1. Pricing Analysis

        14.17.2. Market Share Analysis, 2022

            14.17.2.1. By Type

            14.17.2.2. By Size

            14.17.2.3. By Application

    14.18. GCC Countries

        14.18.1. Pricing Analysis

        14.18.2. Market Share Analysis, 2022

            14.18.2.1. By Type

            14.18.2.2. By Size

            14.18.2.3. By Application

    14.19. South Africa

        14.19.1. Pricing Analysis

        14.19.2. Market Share Analysis, 2022

            14.19.2.1. By Type

            14.19.2.2. By Size

            14.19.2.3. By Application

    14.20. Israel

        14.20.1. Pricing Analysis

        14.20.2. Market Share Analysis, 2022

            14.20.2.1. By Type

            14.20.2.2. By Size

            14.20.2.3. By Application

15. Market Structure Analysis

    15.1. Competition Dashboard

    15.2. Competition Benchmarking

    15.3. Market Share Analysis of Top Players

        15.3.1. By Regional

        15.3.2. By Type

        15.3.3. By Size

        15.3.4. By Application

16. Competition Analysis

    16.1. Competition Deep Dive

        16.1.1. Imerys S. A.

            16.1.1.1. Overview

            16.1.1.2. Product Portfolio

            16.1.1.3. Profitability by Market Segments

            16.1.1.4. Sales Footprint

            16.1.1.5. Strategy Overview

                16.1.1.5.1. Marketing Strategy

                16.1.1.5.2. Product Strategy

                16.1.1.5.3. Channel Strategy

        16.1.2. Omya AG

            16.1.2.1. Overview

            16.1.2.2. Product Portfolio

            16.1.2.3. Profitability by Market Segments

            16.1.2.4. Sales Footprint

            16.1.2.5. Strategy Overview

                16.1.2.5.1. Marketing Strategy

                16.1.2.5.2. Product Strategy

                16.1.2.5.3. Channel Strategy

        16.1.3. J. M. Huber Corporation

            16.1.3.1. Overview

            16.1.3.2. Product Portfolio

            16.1.3.3. Profitability by Market Segments

            16.1.3.4. Sales Footprint

            16.1.3.5. Strategy Overview

                16.1.3.5.1. Marketing Strategy

                16.1.3.5.2. Product Strategy

                16.1.3.5.3. Channel Strategy

        16.1.4. Minerals Technologies Inc

            16.1.4.1. Overview

            16.1.4.2. Product Portfolio

            16.1.4.3. Profitability by Market Segments

            16.1.4.4. Sales Footprint

            16.1.4.5. Strategy Overview

                16.1.4.5.1. Marketing Strategy

                16.1.4.5.2. Product Strategy

                16.1.4.5.3. Channel Strategy

        16.1.5. Gulshan Polyol Ltd.

            16.1.5.1. Overview

            16.1.5.2. Product Portfolio

            16.1.5.3. Profitability by Market Segments

            16.1.5.4. Sales Footprint

            16.1.5.5. Strategy Overview

                16.1.5.5.1. Marketing Strategy

                16.1.5.5.2. Product Strategy

                16.1.5.5.3. Channel Strategy

        16.1.6. ASEC Company for Mining

            16.1.6.1. Overview

            16.1.6.2. Product Portfolio

            16.1.6.3. Profitability by Market Segments

            16.1.6.4. Sales Footprint

            16.1.6.5. Strategy Overview

                16.1.6.5.1. Marketing Strategy

                16.1.6.5.2. Product Strategy

                16.1.6.5.3. Channel Strategy

        16.1.7. Esen Mikronize A.S

            16.1.7.1. Overview

            16.1.7.2. Product Portfolio

            16.1.7.3. Profitability by Market Segments

            16.1.7.4. Sales Footprint

            16.1.7.5. Strategy Overview

                16.1.7.5.1. Marketing Strategy

                16.1.7.5.2. Product Strategy

                16.1.7.5.3. Channel Strategy

        16.1.8. Wolkem India Ltd.

            16.1.8.1. Overview

            16.1.8.2. Product Portfolio

            16.1.8.3. Profitability by Market Segments

            16.1.8.4. Sales Footprint

            16.1.8.5. Strategy Overview

                16.1.8.5.1. Marketing Strategy

                16.1.8.5.2. Product Strategy

                16.1.8.5.3. Channel Strategy

        16.1.9. Shandong CITIC Calcium Industry Co.,Ltd.

            16.1.9.1. Overview

            16.1.9.2. Product Portfolio

            16.1.9.3. Profitability by Market Segments

            16.1.9.4. Sales Footprint

            16.1.9.5. Strategy Overview

                16.1.9.5.1. Marketing Strategy

                16.1.9.5.2. Product Strategy

                16.1.9.5.3. Channel Strategy

        16.1.10. Columbia River Carbonates

            16.1.10.1. Overview

            16.1.10.2. Product Portfolio

            16.1.10.3. Profitability by Market Segments

            16.1.10.4. Sales Footprint

            16.1.10.5. Strategy Overview

                16.1.10.5.1. Marketing Strategy

                16.1.10.5.2. Product Strategy

                16.1.10.5.3. Channel Strategy

        16.1.11. Jay Minerals

            16.1.11.1. Overview

            16.1.11.2. Product Portfolio

            16.1.11.3. Profitability by Market Segments

            16.1.11.4. Sales Footprint

            16.1.11.5. Strategy Overview

                16.1.11.5.1. Marketing Strategy

                16.1.11.5.2. Product Strategy

                16.1.11.5.3. Channel Strategy

        16.1.12. Golden Lime Public Co.

            16.1.12.1. Overview

            16.1.12.2. Product Portfolio

            16.1.12.3. Profitability by Market Segments

            16.1.12.4. Sales Footprint

            16.1.12.5. Strategy Overview

                16.1.12.5.1. Marketing Strategy

                16.1.12.5.2. Product Strategy

                16.1.12.5.3. Channel Strategy

        16.1.13. Ltd., Longcliffe Quarries Ltd.

            16.1.13.1. Overview

            16.1.13.2. Product Portfolio

            16.1.13.3. Profitability by Market Segments

            16.1.13.4. Sales Footprint

            16.1.13.5. Strategy Overview

                16.1.13.5.1. Marketing Strategy

                16.1.13.5.2. Product Strategy

                16.1.13.5.3. Channel Strategy

        16.1.14. Vietnam CMT Joint Stock Company

            16.1.14.1. Overview

            16.1.14.2. Product Portfolio

            16.1.14.3. Profitability by Market Segments

            16.1.14.4. Sales Footprint

            16.1.14.5. Strategy Overview

                16.1.14.5.1. Marketing Strategy

                16.1.14.5.2. Product Strategy

                16.1.14.5.3. Channel Strategy

        16.1.15. Mississippi Lime Company

            16.1.15.1. Overview

            16.1.15.2. Product Portfolio

            16.1.15.3. Profitability by Market Segments

            16.1.15.4. Sales Footprint

            16.1.15.5. Strategy Overview

                16.1.15.5.1. Marketing Strategy

                16.1.15.5.2. Product Strategy

                16.1.15.5.3. Channel Strategy

17. Assumptions & Acronyms Used

18. Research Methodology

Don't pay for what you don't need

Customize your report by selecting specific countries or regions and save 30%!

List of Tables

Table 1: Global Market Value (US$ Million) Forecast by Region, 2018 to 2033

Table 2: Global Market Volume (Tons) Forecast by Region, 2018 to 2033

Table 3: Global Market Value (US$ Million) Forecast by Type, 2018 to 2033

Table 4: Global Market Volume (Tons) Forecast by Type, 2018 to 2033

Table 5: Global Market Value (US$ Million) Forecast by Size, 2018 to 2033

Table 6: Global Market Volume (Tons) Forecast by Size, 2018 to 2033

Table 7: Global Market Value (US$ Million) Forecast by Application, 2018 to 2033

Table 8: Global Market Volume (Tons) Forecast by Application, 2018 to 2033

Table 9: North America Market Value (US$ Million) Forecast by Country, 2018 to 2033

Table 10: North America Market Volume (Tons) Forecast by Country, 2018 to 2033

Table 11: North America Market Value (US$ Million) Forecast by Type, 2018 to 2033

Table 12: North America Market Volume (Tons) Forecast by Type, 2018 to 2033

Table 13: North America Market Value (US$ Million) Forecast by Size, 2018 to 2033

Table 14: North America Market Volume (Tons) Forecast by Size, 2018 to 2033

Table 15: North America Market Value (US$ Million) Forecast by Application, 2018 to 2033

Table 16: North America Market Volume (Tons) Forecast by Application, 2018 to 2033

Table 17: Latin America Market Value (US$ Million) Forecast by Country, 2018 to 2033

Table 18: Latin America Market Volume (Tons) Forecast by Country, 2018 to 2033

Table 19: Latin America Market Value (US$ Million) Forecast by Type, 2018 to 2033

Table 20: Latin America Market Volume (Tons) Forecast by Type, 2018 to 2033

Table 21: Latin America Market Value (US$ Million) Forecast by Size, 2018 to 2033

Table 22: Latin America Market Volume (Tons) Forecast by Size, 2018 to 2033

Table 23: Latin America Market Value (US$ Million) Forecast by Application, 2018 to 2033

Table 24: Latin America Market Volume (Tons) Forecast by Application, 2018 to 2033

Table 25: Europe Market Value (US$ Million) Forecast by Country, 2018 to 2033

Table 26: Europe Market Volume (Tons) Forecast by Country, 2018 to 2033

Table 27: Europe Market Value (US$ Million) Forecast by Type, 2018 to 2033

Table 28: Europe Market Volume (Tons) Forecast by Type, 2018 to 2033

Table 29: Europe Market Value (US$ Million) Forecast by Size, 2018 to 2033

Table 30: Europe Market Volume (Tons) Forecast by Size, 2018 to 2033

Table 31: Europe Market Value (US$ Million) Forecast by Application, 2018 to 2033

Table 32: Europe Market Volume (Tons) Forecast by Application, 2018 to 2033

Table 33: Asia Pacific Market Value (US$ Million) Forecast by Country, 2018 to 2033

Table 34: Asia Pacific Market Volume (Tons) Forecast by Country, 2018 to 2033

Table 35: Asia Pacific Market Value (US$ Million) Forecast by Type, 2018 to 2033

Table 36: Asia Pacific Market Volume (Tons) Forecast by Type, 2018 to 2033

Table 37: Asia Pacific Market Value (US$ Million) Forecast by Size, 2018 to 2033

Table 38: Asia Pacific Market Volume (Tons) Forecast by Size, 2018 to 2033

Table 39: Asia Pacific Market Value (US$ Million) Forecast by Application, 2018 to 2033

Table 40: Asia Pacific Market Volume (Tons) Forecast by Application, 2018 to 2033

Table 41: MEA Market Value (US$ Million) Forecast by Country, 2018 to 2033

Table 42: MEA Market Volume (Tons) Forecast by Country, 2018 to 2033

Table 43: MEA Market Value (US$ Million) Forecast by Type, 2018 to 2033

Table 44: MEA Market Volume (Tons) Forecast by Type, 2018 to 2033

Table 45: MEA Market Value (US$ Million) Forecast by Size, 2018 to 2033

Table 46: MEA Market Volume (Tons) Forecast by Size, 2018 to 2033

Table 47: MEA Market Value (US$ Million) Forecast by Application, 2018 to 2033

Table 48: MEA Market Volume (Tons) Forecast by Application, 2018 to 2033
Nikhil Kaitwade
Nikhil Kaitwade

Principal Consultant

Talk to Analyst

Find your sweet spots for generating winning opportunities in this market.

List of Charts

Figure 1: Global Market Value (US$ Million) by Type, 2023 to 2033

Figure 2: Global Market Value (US$ Million) by Size, 2023 to 2033

Figure 3: Global Market Value (US$ Million) by Application, 2023 to 2033

Figure 4: Global Market Value (US$ Million) by Region, 2023 to 2033

Figure 5: Global Market Value (US$ Million) Analysis by Region, 2018 to 2033

Figure 6: Global Market Volume (Tons) Analysis by Region, 2018 to 2033

Figure 7: Global Market Value Share (%) and BPS Analysis by Region, 2023 to 2033

Figure 8: Global Market Y-o-Y Growth (%) Projections by Region, 2023 to 2033

Figure 9: Global Market Value (US$ Million) Analysis by Type, 2018 to 2033

Figure 10: Global Market Volume (Tons) Analysis by Type, 2018 to 2033

Figure 11: Global Market Value Share (%) and BPS Analysis by Type, 2023 to 2033

Figure 12: Global Market Y-o-Y Growth (%) Projections by Type, 2023 to 2033

Figure 13: Global Market Value (US$ Million) Analysis by Size, 2018 to 2033

Figure 14: Global Market Volume (Tons) Analysis by Size, 2018 to 2033

Figure 15: Global Market Value Share (%) and BPS Analysis by Size, 2023 to 2033

Figure 16: Global Market Y-o-Y Growth (%) Projections by Size, 2023 to 2033

Figure 17: Global Market Value (US$ Million) Analysis by Application, 2018 to 2033

Figure 18: Global Market Volume (Tons) Analysis by Application, 2018 to 2033

Figure 19: Global Market Value Share (%) and BPS Analysis by Application, 2023 to 2033

Figure 20: Global Market Y-o-Y Growth (%) Projections by Application, 2023 to 2033

Figure 21: Global Market Attractiveness by Type, 2023 to 2033

Figure 22: Global Market Attractiveness by Size, 2023 to 2033

Figure 23: Global Market Attractiveness by Application, 2023 to 2033

Figure 24: Global Market Attractiveness by Region, 2023 to 2033

Figure 25: North America Market Value (US$ Million) by Type, 2023 to 2033

Figure 26: North America Market Value (US$ Million) by Size, 2023 to 2033

Figure 27: North America Market Value (US$ Million) by Application, 2023 to 2033

Figure 28: North America Market Value (US$ Million) by Country, 2023 to 2033

Figure 29: North America Market Value (US$ Million) Analysis by Country, 2018 to 2033

Figure 30: North America Market Volume (Tons) Analysis by Country, 2018 to 2033

Figure 31: North America Market Value Share (%) and BPS Analysis by Country, 2023 to 2033

Figure 32: North America Market Y-o-Y Growth (%) Projections by Country, 2023 to 2033

Figure 33: North America Market Value (US$ Million) Analysis by Type, 2018 to 2033

Figure 34: North America Market Volume (Tons) Analysis by Type, 2018 to 2033

Figure 35: North America Market Value Share (%) and BPS Analysis by Type, 2023 to 2033

Figure 36: North America Market Y-o-Y Growth (%) Projections by Type, 2023 to 2033

Figure 37: North America Market Value (US$ Million) Analysis by Size, 2018 to 2033

Figure 38: North America Market Volume (Tons) Analysis by Size, 2018 to 2033

Figure 39: North America Market Value Share (%) and BPS Analysis by Size, 2023 to 2033

Figure 40: North America Market Y-o-Y Growth (%) Projections by Size, 2023 to 2033

Figure 41: North America Market Value (US$ Million) Analysis by Application, 2018 to 2033

Figure 42: North America Market Volume (Tons) Analysis by Application, 2018 to 2033

Figure 43: North America Market Value Share (%) and BPS Analysis by Application, 2023 to 2033

Figure 44: North America Market Y-o-Y Growth (%) Projections by Application, 2023 to 2033

Figure 45: North America Market Attractiveness by Type, 2023 to 2033

Figure 46: North America Market Attractiveness by Size, 2023 to 2033

Figure 47: North America Market Attractiveness by Application, 2023 to 2033

Figure 48: North America Market Attractiveness by Country, 2023 to 2033

Figure 49: Latin America Market Value (US$ Million) by Type, 2023 to 2033

Figure 50: Latin America Market Value (US$ Million) by Size, 2023 to 2033

Figure 51: Latin America Market Value (US$ Million) by Application, 2023 to 2033

Figure 52: Latin America Market Value (US$ Million) by Country, 2023 to 2033

Figure 53: Latin America Market Value (US$ Million) Analysis by Country, 2018 to 2033

Figure 54: Latin America Market Volume (Tons) Analysis by Country, 2018 to 2033

Figure 55: Latin America Market Value Share (%) and BPS Analysis by Country, 2023 to 2033

Figure 56: Latin America Market Y-o-Y Growth (%) Projections by Country, 2023 to 2033

Figure 57: Latin America Market Value (US$ Million) Analysis by Type, 2018 to 2033

Figure 58: Latin America Market Volume (Tons) Analysis by Type, 2018 to 2033

Figure 59: Latin America Market Value Share (%) and BPS Analysis by Type, 2023 to 2033

Figure 60: Latin America Market Y-o-Y Growth (%) Projections by Type, 2023 to 2033

Figure 61: Latin America Market Value (US$ Million) Analysis by Size, 2018 to 2033

Figure 62: Latin America Market Volume (Tons) Analysis by Size, 2018 to 2033

Figure 63: Latin America Market Value Share (%) and BPS Analysis by Size, 2023 to 2033

Figure 64: Latin America Market Y-o-Y Growth (%) Projections by Size, 2023 to 2033

Figure 65: Latin America Market Value (US$ Million) Analysis by Application, 2018 to 2033

Figure 66: Latin America Market Volume (Tons) Analysis by Application, 2018 to 2033

Figure 67: Latin America Market Value Share (%) and BPS Analysis by Application, 2023 to 2033

Figure 68: Latin America Market Y-o-Y Growth (%) Projections by Application, 2023 to 2033

Figure 69: Latin America Market Attractiveness by Type, 2023 to 2033

Figure 70: Latin America Market Attractiveness by Size, 2023 to 2033

Figure 71: Latin America Market Attractiveness by Application, 2023 to 2033

Figure 72: Latin America Market Attractiveness by Country, 2023 to 2033

Figure 73: Europe Market Value (US$ Million) by Type, 2023 to 2033

Figure 74: Europe Market Value (US$ Million) by Size, 2023 to 2033

Figure 75: Europe Market Value (US$ Million) by Application, 2023 to 2033

Figure 76: Europe Market Value (US$ Million) by Country, 2023 to 2033

Figure 77: Europe Market Value (US$ Million) Analysis by Country, 2018 to 2033

Figure 78: Europe Market Volume (Tons) Analysis by Country, 2018 to 2033

Figure 79: Europe Market Value Share (%) and BPS Analysis by Country, 2023 to 2033

Figure 80: Europe Market Y-o-Y Growth (%) Projections by Country, 2023 to 2033

Figure 81: Europe Market Value (US$ Million) Analysis by Type, 2018 to 2033

Figure 82: Europe Market Volume (Tons) Analysis by Type, 2018 to 2033

Figure 83: Europe Market Value Share (%) and BPS Analysis by Type, 2023 to 2033

Figure 84: Europe Market Y-o-Y Growth (%) Projections by Type, 2023 to 2033

Figure 85: Europe Market Value (US$ Million) Analysis by Size, 2018 to 2033

Figure 86: Europe Market Volume (Tons) Analysis by Size, 2018 to 2033

Figure 87: Europe Market Value Share (%) and BPS Analysis by Size, 2023 to 2033

Figure 88: Europe Market Y-o-Y Growth (%) Projections by Size, 2023 to 2033

Figure 89: Europe Market Value (US$ Million) Analysis by Application, 2018 to 2033

Figure 90: Europe Market Volume (Tons) Analysis by Application, 2018 to 2033

Figure 91: Europe Market Value Share (%) and BPS Analysis by Application, 2023 to 2033

Figure 92: Europe Market Y-o-Y Growth (%) Projections by Application, 2023 to 2033

Figure 93: Europe Market Attractiveness by Type, 2023 to 2033

Figure 94: Europe Market Attractiveness by Size, 2023 to 2033

Figure 95: Europe Market Attractiveness by Application, 2023 to 2033

Figure 96: Europe Market Attractiveness by Country, 2023 to 2033

Figure 97: Asia Pacific Market Value (US$ Million) by Type, 2023 to 2033

Figure 98: Asia Pacific Market Value (US$ Million) by Size, 2023 to 2033

Figure 99: Asia Pacific Market Value (US$ Million) by Application, 2023 to 2033

Figure 100: Asia Pacific Market Value (US$ Million) by Country, 2023 to 2033

Figure 101: Asia Pacific Market Value (US$ Million) Analysis by Country, 2018 to 2033

Figure 102: Asia Pacific Market Volume (Tons) Analysis by Country, 2018 to 2033

Figure 103: Asia Pacific Market Value Share (%) and BPS Analysis by Country, 2023 to 2033

Figure 104: Asia Pacific Market Y-o-Y Growth (%) Projections by Country, 2023 to 2033

Figure 105: Asia Pacific Market Value (US$ Million) Analysis by Type, 2018 to 2033

Figure 106: Asia Pacific Market Volume (Tons) Analysis by Type, 2018 to 2033

Figure 107: Asia Pacific Market Value Share (%) and BPS Analysis by Type, 2023 to 2033

Figure 108: Asia Pacific Market Y-o-Y Growth (%) Projections by Type, 2023 to 2033

Figure 109: Asia Pacific Market Value (US$ Million) Analysis by Size, 2018 to 2033

Figure 110: Asia Pacific Market Volume (Tons) Analysis by Size, 2018 to 2033

Figure 111: Asia Pacific Market Value Share (%) and BPS Analysis by Size, 2023 to 2033

Figure 112: Asia Pacific Market Y-o-Y Growth (%) Projections by Size, 2023 to 2033

Figure 113: Asia Pacific Market Value (US$ Million) Analysis by Application, 2018 to 2033

Figure 114: Asia Pacific Market Volume (Tons) Analysis by Application, 2018 to 2033

Figure 115: Asia Pacific Market Value Share (%) and BPS Analysis by Application, 2023 to 2033

Figure 116: Asia Pacific Market Y-o-Y Growth (%) Projections by Application, 2023 to 2033

Figure 117: Asia Pacific Market Attractiveness by Type, 2023 to 2033

Figure 118: Asia Pacific Market Attractiveness by Size, 2023 to 2033

Figure 119: Asia Pacific Market Attractiveness by Application, 2023 to 2033

Figure 120: Asia Pacific Market Attractiveness by Country, 2023 to 2033

Figure 121: MEA Market Value (US$ Million) by Type, 2023 to 2033

Figure 122: MEA Market Value (US$ Million) by Size, 2023 to 2033

Figure 123: MEA Market Value (US$ Million) by Application, 2023 to 2033

Figure 124: MEA Market Value (US$ Million) by Country, 2023 to 2033

Figure 125: MEA Market Value (US$ Million) Analysis by Country, 2018 to 2033

Figure 126: MEA Market Volume (Tons) Analysis by Country, 2018 to 2033

Figure 127: MEA Market Value Share (%) and BPS Analysis by Country, 2023 to 2033

Figure 128: MEA Market Y-o-Y Growth (%) Projections by Country, 2023 to 2033

Figure 129: MEA Market Value (US$ Million) Analysis by Type, 2018 to 2033

Figure 130: MEA Market Volume (Tons) Analysis by Type, 2018 to 2033

Figure 131: MEA Market Value Share (%) and BPS Analysis by Type, 2023 to 2033

Figure 132: MEA Market Y-o-Y Growth (%) Projections by Type, 2023 to 2033

Figure 133: MEA Market Value (US$ Million) Analysis by Size, 2018 to 2033

Figure 134: MEA Market Volume (Tons) Analysis by Size, 2018 to 2033

Figure 135: MEA Market Value Share (%) and BPS Analysis by Size, 2023 to 2033

Figure 136: MEA Market Y-o-Y Growth (%) Projections by Size, 2023 to 2033

Figure 137: MEA Market Value (US$ Million) Analysis by Application, 2018 to 2033

Figure 138: MEA Market Volume (Tons) Analysis by Application, 2018 to 2033

Figure 139: MEA Market Value Share (%) and BPS Analysis by Application, 2023 to 2033

Figure 140: MEA Market Y-o-Y Growth (%) Projections by Application, 2023 to 2033

Figure 141: MEA Market Attractiveness by Type, 2023 to 2033

Figure 142: MEA Market Attractiveness by Size, 2023 to 2033

Figure 143: MEA Market Attractiveness by Application, 2023 to 2033

Figure 144: MEA Market Attractiveness by Country, 2023 to 2033

Recommendations

Chemicals & Materials

Calcium Oxide Market

Published : October 2022

Chemicals & Materials

Calcium Ammonium Nitrate Market

Published : June 2022

Chemicals & Materials

Amine Oxide Market

Published : June 2022

Chemicals & Materials

Calcium Acetate Market

Published : March 2020

Explore Chemicals & Materials Insights

View Reports