Carob Market Forecast and Outlook 2025 to 2035

The carob market is valued at USD 792.6 million in 2025 and is projected to grow to USD 1,173.3 million by 2035, advancing at a CAGR of 4.0%.
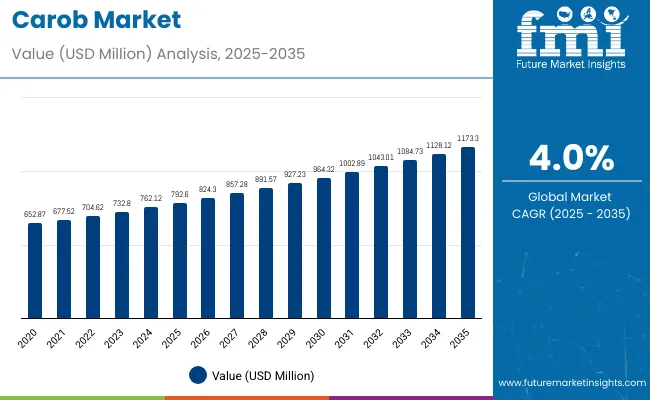
Quick Stats for Carob Market

  • Carob Market Value (2025): USD 792.6 million
  • Carob Market Forecast Value (2035): USD 1,173.3 million
  • Carob Market Forecast CAGR: 4.0%
  • Leading Segment in Carob Market in 2025: Solid (58% Market Share)
  • Key Growth Regionsin Carob Market: North America, East Asia, and Western Europe
  • Key Players in Carob Market: Australian Carobs Pty Ltd., The Hain Celestial Group Inc., Cyber Colloids Ltd., Carob Way, Carobs Australia Inc.

Carob Market

Metric Value
Estimated Size (2025E) USD 792.6 million
Projected Value (2035F) USD 1,173. 3 million
CAGR (2025 to 2035) 4.0%

Factors driving this growth include the rising demand for caffeine-free and gluten-free food alternatives, increasing use of carob in bakery and confectionery applications, and the growing popularity of natural sweeteners. Additionally, the expansion of retail infrastructure in emerging economies and a rising health-conscious consumer base are contributing to the market’s expansion.

By 2030, the market is forecasted to reach USD 984.1 million, reflecting steady growth throughout the forecast period. The absolute dollar growth between 2025 and 2035 is expected to be around USD 380.7 million, indicating consistent and reliable expansion. Market growth is anticipated to accelerate in the latter half of the timeline, driven by increased adoption of carob in clean-label beverages, functional foods, gluten-free products, pet food formulations, and natural health supplements. This growth is further supported by rising consumer demand for caffeine-free, gluten-free, and plant-based alternatives across global markets.

Companies such as Australian Carobs Pty Ltd and Carob S.A. are strengthening their competitive positions through investments in advanced extraction technologies and scalable production systems. Innovation-driven procurement models are enabling expansion into pharmaceutical drug delivery, nutraceutical formulations, and premium cosmetic applications utilizing carob. The market performance will continue to be anchored by strict regulatory compliance, high purity standards, and commitments to sustainable sourcing practices across the global carob supply chain.

The market holds a significant share across multiple segments. It accounts for 35% of the gluten-free ingredients market, driven by its natural caffeine-free and gluten-free properties and growing use in bakery, confectionery, and specialty health products. The market contributes about 28% to the functional food and beverage ingredients sector, supported by increasing adoption in nutrition bars, beverages, and dietary supplements. Carob also holds close to 22% of the natural and organic personal care ingredients market, where its antioxidant and moisturizing properties are valued. In the pet food segment, carob captures around 18% of the market share, favored for its safety and nutritional benefits in specialty formulations.

The market is evolving with advancements in processing technologies improving flavor profiles and nutritional benefits. Producers are expanding product lines to include carob-based snacks, clean-label beverages, and natural sweeteners, supported by organic and fair-trade certifications. Collaborations with foodservice operators, health retailers, and online platforms are broadening market reach, driving consumer awareness, and reshaping traditional sweetener and functional ingredient categories.

Carob Market Analysis by Top Investment Segment

The market is segmented by form, distribution channel, application, and region. By form, the market is bifurcated into solid and liquid. Based on distribution channel, the market is categorized into fitness stores, health stores, online stores and others (specialty stores, grocery chains, and departmental outlets). In terms of application, the market is divided into bakery products, dairy products, nutrition & supplements, pharmaceuticals, and others (pet food, beverages, and confectionery). Regionally, the market is classified in to North America, Latin America, Western Europe, Eastern Europe, South Asia and Pacific, East Asia, Middle East and Africa.
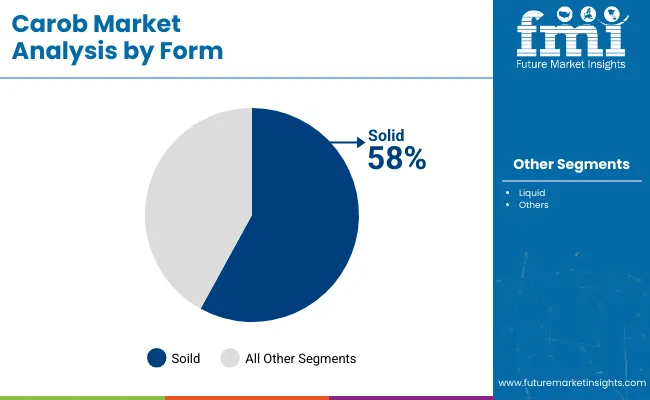
By Form, Solid Accounts for 58% of the Market Share

Carob Market By Form

Solid carob is expected to dominate the form segment in 2025, holding a 58% market share. Its widespread use in bakery, confectionery, and pet food sectors is attributed to its advantages like ease of storage, low moisture content, and extended shelf life. This form serves as a natural substitute for cocoa powder in various food products, making it highly versatile. Solid carob’s popularity spans both retail and foodservice sectors, fueling steady growth in major consumer markets.

It is particularly favored for dry mix applications due to its stability and convenience. Additionally, solid carob offers cost-efficiency for bulk manufacturing, making it attractive to producers. Its low processing requirements further enhance its commercial adoption, positioning it as a preferred ingredient in packaged foods and baked snacks. These benefits collectively contribute to solid carob’s leading status in the market and its continued expansion across diverse food applications.
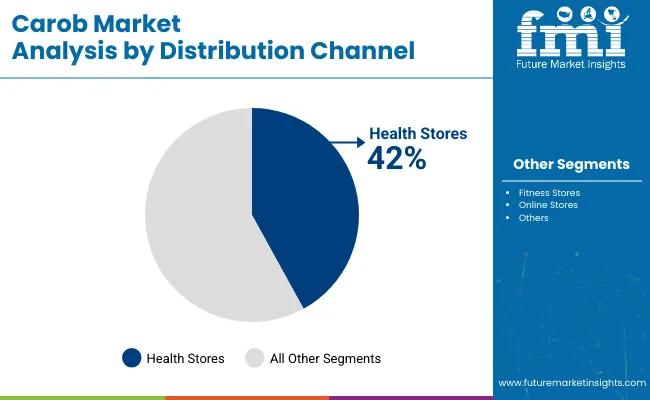
By Distribution Channel, Health Stores Account for 42% of the Market Share

Carob Market By Distribution

Health stores are poised to lead the distribution channel segment in 2025, capturing a 42% market share. These stores specifically target health-conscious consumers who prioritize functional, organic, and clean-label ingredients like carob. Carob’s natural sweetener qualities, caffeine-free profile, and suitability for diabetic-friendly diets align perfectly with health stores’ product offerings. Shoppers at these outlets seek certified and trustworthy products, which enhances carob’s visibility and shelf presence.

Health stores also emphasize organic and sugar-free carob variants, catering to niche consumer preferences. The availability of premium and specialty carob brands further strengthens the market in this segment. Additionally, in-store expert guidance helps build consumer confidence, encouraging repeat purchases. The growth of health stores distributing carob is particularly driven by rising demand in developed economies, where awareness of natural and functional ingredients continues to expand. This makes health stores a vital channel for carob adoption and sustained market growth.

What are the Drivers, Restraints, and Key Trends of the Carob Market?

From 2025 to 2035, rising consumer demand for natural, clean-label, and functional food and beverage products is driving significant growth in the carob market. Increasing preference for health-enhancing, organic, and sustainably sourced carob products has encouraged producers to invest in advanced extraction and processing technologies, enabling them to expand product portfolios and meet evolving consumer needs.

Growing Consumer Health Awareness Drives Market Growth

A steady rise in consumer interest in clean-label, gluten-free, and nutrient-rich products is a primary growth driver in the carob market. Consumers seek foods and beverages offering health benefits such as antioxidant support, caffeine-free alternatives, and digestive health. Brands are focusing on product quality by using innovative carob extracts and ensuring transparency in sourcing and production to satisfy these expectations.

Innovation in Product Development Expands Market Opportunities

Technological advancements in carob processing, flavor enhancement, and encapsulation have improved product stability, potency, and shelf life. The development of organic, allergen-free, and sustainably sourced carob products, along with quality certifications, appeals to environmentally conscious and health-driven consumers. These innovations create new opportunities for premium carob-based products, fueling sustained market expansion.
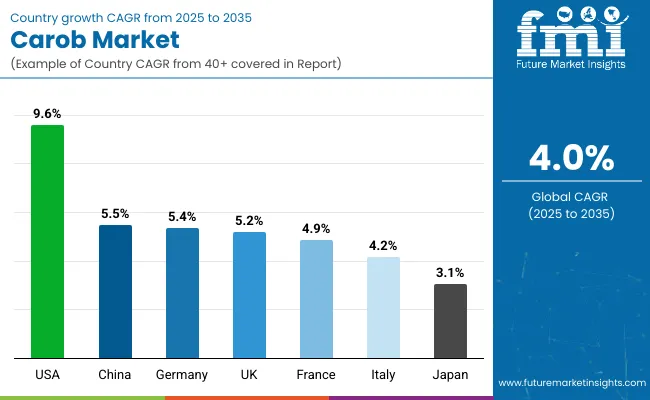
Carob Market Analysis by Key Countries

Carob Market By Country

Countries CAGR (2025 to 2035)
United States 9.6%
China 5.5%
Germany 5.4%
United Kingdom 5.2%
France 4.9%
Italy 4.2%
Japan 3.1%

The United States leads with a strong CAGR of 9.6%, driven by its robust consumer focus on gluten-free, caffeine-free, and clean-label products, along with expansion in pet food and functional beverages. China follows with a solid 5.5% CAGR, propelled by increasing plant-based nutrition interest and investments in processing technologies. Germany closely trails at 5.4%, supported by rising demand for diabetic-friendly and natural alternatives. The UK’s 5.2% CAGR reflects growing vegan and ethical consumption trends. France’s 4.9% CAGR is fueled by mediterranean diet influences and product innovations. Italy shows moderate growth at 4.2%, capitalizing on traditional culinary uses and sustainability trends. Japan reports the slowest but steady growth at 3.1%, driven by niche health supplements and gluten-free market segments.

The report covers an in-depth analysis of 40+ countries; seven top-performing OECD countries are highlighted below.

Production Capacity Trends in Carob Market in the United States

Revenue from carob in the U.S. is projected to grow at a CAGR of 9.6% from 2025 to 2035, leading global expansion driven by rising consumer demand for natural, gluten-free, and caffeine-free alternatives. This growth is supported by increasing use of carob in bakery, confectionery, and pet food formulations. Strong innovation in clean-label and organic product offerings enhances market penetration in both retail and foodservice channels.

The rising health consciousness of millennials and Gen Z fuels demand for diversified carob applications, including nutrition bars and functional beverages. Expansion of online and specialty store distribution networks further accelerates growth. Regulatory compliance and sustainable sourcing practices underpin market credibility. Increasing investment in production technologies supports scalability and quality improvements. Overall, the U.S. market sets a benchmark in product innovation and consumer adoption for carob worldwide.

  • Growing awareness of gluten and caffeine intolerance.
  • Accelerated demand in pet food formulations.
  • Strong presence of clean-label organic products.

Output Expansion in Carob Market in China

Revenue from carob in China is expected to expand at a CAGR of 5.5% during 2025–2035, reflecting increasing consumer interest in plant-based nutrition and functional foods. Large-scale investment in advanced carob processing facilities is boosting production capacity and quality. The rise of online retail channels is facilitating broader product distribution, making carob powder, snacks, and sweetener alternatives more accessible. Government initiatives promoting dietary diversification and healthier lifestyles are driving demand.

China’s nutraceutical and health supplement sectors integrate carob for its antioxidant and gluten-free benefits. Partnerships between domestic processors and international suppliers enhance product innovation. Sustainable sourcing and organic certifications are gaining focus as consumers become environmentally conscious. These factors position China as a key player in carob production and consumption in Asia.

  • Investment in scalable processing technologies.
  • Growing demand for plant-based, functional foods.
  • Expansion of e-commerce and retail channels.

Structural Adoption in Carob Market in Germany

Sales of carob in Germany are projected to grow at a CAGR of 5.4% from 2025 to 2035, driven by consumer preference for natural, clean-label, and diabetic-friendly foods. Carob powder is increasingly used as a cocoa substitute in bakery and confectionery products, supporting healthier dietary choices. The sports nutrition segment integrates carob for its functional benefits, appealing to fitness enthusiasts. Retailers are expanding product ranges to include organic carob powders and snacks. Sustainability considerations influence both sourcing and packaging innovations within the market. Manufacturers focus on reducing sugar content by leveraging carob’s natural sweetness. The market also benefits from rising awareness of allergen-free products. Regulatory standards ensure consistent product quality, boosting consumer confidence in carob-based foods.

  • High demand for clean-label bakery items.
  • Usage as a cocoa alternative in diabetic foods.
  • Adoption in sports nutrition products.

Market Expansion in Carob Market in the United Kingdom

Revenue from carob in the United Kingdom is forecasted to grow at a CAGR of 5.2% from 2025 to 2035, propelled by demand for vegan, dairy-free, and ethical food products. Carob syrup and powder gain popularity in alternative sweeteners and bakery goods. Private label and premium organic products are expanding their footprint in supermarkets and health stores. Sustainability is a core value, with emphasis on fair-trade sourcing and reduced environmental impact. Consumer awareness of clean-label food influences purchasing decisions strongly. Carob’s versatility as a sugar substitute supports growth in confectionery and snacks. Collaboration with foodservice operators enriches innovation pipelines. These factors collectively boost market visibility and drive consistent sales growth.

  • Rising vegan and dairy-free product demand.
  • Popularity of private label and premium products.
  • Fair-trade and sustainability initiatives.

Consumer Trend Shifts in Carob Market in France

Sales of carob in France are predicted to grow at a CAGR of 4.9% from 2025 to 2035, energized by interest in Mediterranean diets and flexitarian lifestyles. Carob is gaining visibility beyond health food niches through product innovations in beverages, chocolates, and spreads. Retail chains focusing on health and organic foods are expanding distribution. Flexitarian consumers contribute to moderate but steady market sales. Sustainable sourcing of carob raw materials strengthens the market’s ethical appeal. Traditional uses in specialty foods link heritage with modern health trends. Manufacturers invest in research to optimize flavor and nutritional profiles. Increasing health awareness among French consumers supports ongoing market acceptance.

  • Influence of Mediterranean and plant-based diets.
  • Innovation in carob-infused beverages and chocolates.
  • Emphasis on sustainable sourcing and ethics.

Market Development in Carob Market in Italy

Demand for carob in Italy is projected to grow at a CAGR of 4.2% from 2025 to 2035, leverages traditional culinary uses and increasing demand for natural sweeteners. Carob powder and products are gaining traction in bakery, confectionery, and dessert applications. Artisanal and regional producers emphasize product quality and organic certifications. Demand is supported by simplified supply chains focused on sustainability. Local recipes intertwine with modern health trends, driving regional consumer loyalty. Carob’s gluten-free and caffeine-free profile attracts health-conscious consumers. Premiumization of carob products enhances market positioning. Investment in processing technologies improves taste and shelf life, fostering wider adoption.

  • Traditional and regional usage in foods.
  • Emphasis on sustainable and local sourcing.
  • Health-driven interest in gluten and caffeine-free options.

Niche Growth Patterns in Carob Market in Japan

Revenue from carob in Japan is expected to grow steadily at a CAGR of 3.1% between 2025 and 2035, driven by niche demand in health supplements and gluten-free products. Carob is incorporated in functional foods, herbal remedies, and gluten-free bakery mixes. Nutraceutical companies collaborate with suppliers to create value-added products. Consumer interest in superfoods and traditional plant-based ingredients boosts market potential. Low allergenicity and caffeine-free characteristics appeal to sensitive consumer segments. Growth is supported by premium pricing strategies and product innovation. Japan’s increasing focus on natural health products fuels consistent but moderate expansion in the carob market.
  • Niche interest in superfoods and health supplements.
  • Preference for allergen- and caffeine-free options.
  • Steady growth supported by premium pricing and innovation.

Competitive Landscape of the Carob Market

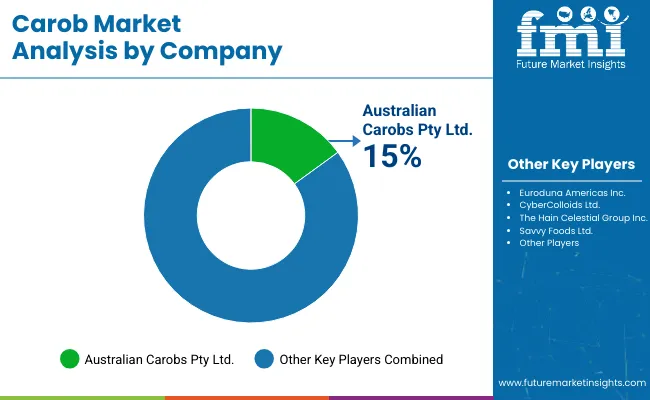
Carob Market By Company

The market is highly fragmented, with numerous regional and niche players contributing to a diversified global supply chain. Leading companies such as Australian Carobs Pty Ltd., Euroduna Americas Inc., and Cyber Colloids Ltd. are competing on the grounds of product purity, sustainability, and functional health benefits. With carob being increasingly recognized as a caffeine-free, gluten-free, and antioxidant-rich alternative to cocoa, these players are actively capitalizing on evolving dietary preferences, particularly in Europe, North America, and Asia Pacific.

Strategically, top firms are focusing on vertical integration, clean-label certification, and expanding their reach through e-commerce and direct-to-consumer models. Innovation in carob powder processing, non-GMO sourcing, and sugar-free formulations has become central to portfolio differentiation. Australian Carobs Pty Ltd. and Carobs Australia Inc. have been investing in chemical-free cultivation, while companies like Frontier Co-op and The Hain Celestial Group Inc. are strengthening global distribution through strategic retail and specialty health food channels.

Scope of Report

Items Values
Quantitative Units (2025) USD 792.6 million
Form Solid, Liquid
Application Bakery Products, Dairy Products, Nutrition & Supplements, Pharmaceuticals, Others (Pet Food, Beverages, and Confectionery)
Distribution Channel Fitness Stores, Health Stores, Online Stores, Others (Specialty Stores, Grocery Chains, and Departmental Outlets)
Regions Covered North America, Latin America, Western Europe, Eastern Europe, South Asia , Pacific, East Asia, Middle East and Africa
Countries Covered United States, Canada, United Kingdom, Germany, France, China, Japan, South Korea, Brazil, Australia , and 40+ countries
Key Players Australian Carobs Pty Ltd., Euroduna Americas Inc., Cyber Colloids Ltd., The Hain Celestial Group Inc., Savvy Foods Ltd., Carobs Australia Inc., Creta Carob, Lewis Confectionery Pty Ltd, Frontier Co-op, Oak Haven Inc .
Additional Attributes Dollar sales and growth by form, distribution channel, and application; segment-wise market share analysis; country-wise market analysis; consumer preferences for natural and value-added carob products; innovations in product formulation and processing; and quality, traceability, and sustainable sourcing practices

Key Segments

By Form:

  • Solid
  • Liquid

By Distribution Channel:

  • via Fitness Stores
  • via Health Stores
  • via Online Stores
  • via Other Distribution Channels

By Application:

  • for Bakery Products
  • for Dairy Products
  • for Nutrition & Supplements
  • for Pharmaceuticals
  • for Other Applications

By Region:

  • North America
  • Latin America
  • Europe
  • Asia Pacific
  • Middle East & Africa

Table of Content

  1. Executive Summary
    • Global Market Outlook
    • Demand-side Trends
    • Supply-side Trends
    • Technology Roadmap Analysis
    • Analysis and Recommendations
  2. Market Overview
    • Market Coverage / Taxonomy
    • Market Definition / Scope / Limitations
  3. Market Background
    • Market Dynamics
      • Drivers
      • Restraints
      • Opportunity
      • Trends
    • Scenario Forecast
      • Demand in Optimistic Scenario
      • Demand in Likely Scenario
      • Demand in Conservative Scenario
    • Opportunity Map Analysis
    • Product Life Cycle Analysis
    • Supply Chain Analysis
      • Supply Side Participants and their Roles
        • Producers
        • Mid-Level Participants (Traders/ Agents/ Brokers)
        • Wholesalers and Distributors
      • Value Added and Value Created at Node in the Supply Chain
      • List of Raw Material Suppliers
      • List of Existing and Potential Buyer’s
    • Investment Feasibility Matrix
    • Value Chain Analysis
      • Profit Margin Analysis
      • Wholesalers and Distributors
      • Retailers
    • PESTLE and Porter’s Analysis
    • Regulatory Landscape
      • By Key Regions
      • By Key Countries
    • Regional Parent Market Outlook
    • Production and Consumption Statistics
    • Import and Export Statistics
  4. Global Market Analysis 2020 to 2024 and Forecast, 2025 to 2035
    • Historical Market Size Value (USD Million) & Volume (Kilotons) Analysis, 2020 to 2024
    • Current and Future Market Size Value (USD Million) & Volume (Kilotons) Projections, 2025 to 2035
      • Y-o-Y Growth Trend Analysis
      • Absolute $ Opportunity Analysis
  5. Global Market Pricing Analysis 2020 to 2024 and Forecast 2025 to 2035
  6. Global Market Analysis 2020 to 2024 and Forecast 2025 to 2035, By Form
    • Introduction / Key Findings
    • Historical Market Size Value (USD Million) & Volume (Kilotons) Analysis By Form, 2020 to 2024
    • Current and Future Market Size Value (USD Million) & Volume (Kilotons) Analysis and Forecast By Form, 2025 to 2035
      • Solid
      • Liquid
    • Y-o-Y Growth Trend Analysis By Form, 2020 to 2024
    • Absolute $ Opportunity Analysis By Form, 2025 to 2035
  7. Global Market Analysis 2020 to 2024 and Forecast 2025 to 2035, By Distribution Channel
    • Introduction / Key Findings
    • Historical Market Size Value (USD Million) & Volume (Kilotons) Analysis By Distribution Channel, 2020 to 2024
    • Current and Future Market Size Value (USD Million) & Volume (Kilotons) Analysis and Forecast By Distribution Channel, 2025 to 2035
      • Fitness Stores
      • Health Store
      • Online Store
      • Others
        • Specialty Stores
        • Grocery Chains
        • Departmental Outlets
    • Y-o-Y Growth Trend Analysis By Distribution Channel, 2020 to 2024
    • Absolute $ Opportunity Analysis By Distribution Channel, 2025 to 2035
  8. Global Market Analysis 2020 to 2024 and Forecast 2025 to 2035, By Application
    • Introduction / Key Findings
    • Historical Market Size Value (USD Million) & Volume (Kilotons) Analysis By Application, 2020 to 2024
    • Current and Future Market Size Value (USD Million) & Volume (Kilotons) Analysis and Forecast By Application, 2025 to 2035
      • Bakery Products
      • Dairy Products
      • Nutrition & Supplements
      • Pharmaceuticals
      • Others
        • Pet Food
        • Beverages
        • Confectionery
    • Y-o-Y Growth Trend Analysis By Application, 2020 to 2024
    • Absolute $ Opportunity Analysis By Application, 2025 to 2035
  9. Global Market Analysis 2020 to 2024 and Forecast 2025 to 2035, By Region
    • Introduction
    • Historical Market Size Value (USD Million) & Volume (Kilotons) Analysis By Region, 2020 to 2024
    • Current Market Size Value (USD Million) & Volume (Kilotons) Analysis and Forecast By Region, 2025 to 2035
      • North America
      • Latin America
      • Western Europe
      • Eastern Europe
      • East Asia
      • South Asia & Pacific
      • Middle East and Africa
    • Market Attractiveness Analysis By Region
  10. North America Market Analysis 2020 to 2024 and Forecast 2025 to 2035, By Country
    • Historical Market Size Value (USD Million) & Volume (Kilotons) Trend Analysis By Market Taxonomy, 2020 to 2024
    • Market Size Value (USD Million) & Volume (Kilotons) Forecast By Market Taxonomy, 2025 to 2035
      • By Country
        • USA
        • Canada
        • Mexico
      • By Form
      • By Distribution Channel
      • By Application
    • Market Attractiveness Analysis
      • By Country
      • By Form
      • By Distribution Channel
      • By Application
    • Key Takeaways
  11. Latin America Market Analysis 2020 to 2024 and Forecast 2025 to 2035, By Country
    • Historical Market Size Value (USD Million) & Volume (Kilotons) Trend Analysis By Market Taxonomy, 2020 to 2024
    • Market Size Value (USD Million) & Volume (Kilotons) Forecast By Market Taxonomy, 2025 to 2035
      • By Country
        • Brazil
        • Argentina
        • Rest of LATAM
      • By Form
      • By Distribution Channel
      • By Application
    • Market Attractiveness Analysis
      • By Country
      • By Form
      • By Distribution Channel
      • By Application
    • Key Takeaways
  12. Western Europe Market Analysis 2020 to 2024 and Forecast 2025 to 2035, By Country
    • Historical Market Size Value (USD Million) & Volume (Kilotons) Trend Analysis By Market Taxonomy, 2020 to 2024
    • Market Size Value (USD Million) & Volume (Kilotons) Forecast By Market Taxonomy, 2025 to 2035
      • By Country
        • Germany
        • Italy
        • France
        • UK
        • Spain
        • BENELUX
        • Nordic
        • Rest of W.Europe
      • By Form
      • By Distribution Channel
      • By Application
    • Market Attractiveness Analysis
      • By Country
      • By Form
      • By Distribution Channel
      • By Application
    • Key Takeaways
  13. Eastern Europe Market Analysis 2020 to 2024 and Forecast 2025 to 2035, By Country
    • Historical Market Size Value (USD Million) & Volume (Kilotons) Trend Analysis By Market Taxonomy, 2020 to 2024
    • Market Size Value (USD Million) & Volume (Kilotons) Forecast By Market Taxonomy, 2025 to 2035
      • By Country
        • Russia
        • Hungary
        • Poland
        • Balkan & Baltics
        • Rest of E. Europe
      • By Form
      • By Distribution Channel
      • By Application
    • Market Attractiveness Analysis
      • By Country
      • By Form
      • By Distribution Channel
      • By Application
    • Key Takeaways
  14. East Asia Market Analysis 2020 to 2024 and Forecast 2025 to 2035, By Country
    • Historical Market Size Value (USD Million) & Volume (Kilotons) Trend Analysis By Market Taxonomy, 2020 to 2024
    • Market Size Value (USD Million) & Volume (Kilotons) Forecast By Market Taxonomy, 2025 to 2035
      • By Country
        • China
        • Japan
        • South Korea
      • By Form
      • By Distribution Channel
      • By Application
    • Market Attractiveness Analysis
      • By Country
      • By Form
      • By Distribution Channel
      • By Application
    • Key Takeaways
  15. South Asia & Pacific Market Analysis 2020 to 2024 and Forecast 2025 to 2035, By Country
    • Historical Market Size Value (USD Million) & Volume (Kilotons) Trend Analysis By Market Taxonomy, 2020 to 2024
    • Market Size Value (USD Million) & Volume (Kilotons) Forecast By Market Taxonomy, 2025 to 2035
      • By Country
        • India
        • Australia & New Zealand
        • ASEAN
        • Rest of SAP
      • By Form
      • By Distribution Channel
      • By Application
    • Market Attractiveness Analysis
      • By Country
      • By Form
      • By Distribution Channel
      • By Application
    • Key Takeaways
  16. Middle East and Africa Market Analysis 2020 to 2024 and Forecast 2025 to 2035, By Country
    • Historical Market Size Value (USD Million) & Volume (Kilotons) Trend Analysis By Market Taxonomy, 2020 to 2024
    • Market Size Value (USD Million) & Volume (Kilotons) Forecast By Market Taxonomy, 2025 to 2035
      • By Country
        • GCC Countries
        • Northern Africa
        • South Africa
        • Turkiye
        • Rest of MEA
      • By Form
      • By Distribution Channel
      • By Application
    • Market Attractiveness Analysis
      • By Country
      • By Form
      • By Distribution Channel
      • By Application
    • Key Takeaways
  17. Key Countries Market Analysis
    • USA
      • Pricing Analysis
      • Market Share Analysis, 2024
        • By Form
        • By Distribution Channel
        • By Application
    • Canada
      • Pricing Analysis
      • Market Share Analysis, 2024
        • By Form
        • By Distribution Channel
        • By Application
    • Brazil
      • Pricing Analysis
      • Market Share Analysis, 2024
        • By Form
        • By Distribution Channel
        • By Application
    • Mexico
      • Pricing Analysis
      • Market Share Analysis, 2024
        • By Form
        • By Distribution Channel
        • By Application
    • Argentina
      • Pricing Analysis
      • Market Share Analysis, 2024
        • By Form
        • By Distribution Channel
        • By Application
  18. Market Structure Analysis
    • Competition Dashboard
    • Competition Benchmarking
    • Market Share Analysis of Top Players
      • By Regional
      • By Form
      • By Distribution Channel
      • By Application
  19. Competition Analysis
    • Competition Deep Dive
      • Australians Pty Ltd.
        • Overview
        • Product Portfolio
        • Profitability by Market Segments (Product/Age /Sales Channel/Region)
        • Sales Footprint
        • Strategy Overview
          • Marketing Strategy
          • Product Strategy
          • Channel Strategy
      • Euroduna Americas Inc.
        • Overview
        • Product Portfolio
        • Profitability by Market Segments (Product/Age /Sales Channel/Region)
        • Sales Footprint
        • Strategy Overview
          • Marketing Strategy
          • Product Strategy
          • Channel Strategy
      • CyberColloids Ltd.
        • Overview
        • Product Portfolio
        • Profitability by Market Segments (Product/Age /Sales Channel/Region)
        • Sales Footprint
        • Strategy Overview
          • Marketing Strategy
          • Product Strategy
          • Channel Strategy
      • The Hain Celestial Group Inc.
        • Overview
        • Product Portfolio
        • Profitability by Market Segments (Product/Age /Sales Channel/Region)
        • Sales Footprint
        • Strategy Overview
          • Marketing Strategy
          • Product Strategy
          • Channel Strategy
      • Savvy Foods Ltd.
        • Overview
        • Product Portfolio
        • Profitability by Market Segments (Product/Age /Sales Channel/Region)
        • Sales Footprint
        • Strategy Overview
          • Marketing Strategy
          • Product Strategy
          • Channel Strategy
      • Carobs Australia Inc.
        • Overview
        • Product Portfolio
        • Profitability by Market Segments (Product/Age /Sales Channel/Region)
        • Sales Footprint
        • Strategy Overview
          • Marketing Strategy
          • Product Strategy
          • Channel Strategy
      • Creta
        • Overview
        • Product Portfolio
        • Profitability by Market Segments (Product/Age /Sales Channel/Region)
        • Sales Footprint
        • Strategy Overview
          • Marketing Strategy
          • Product Strategy
          • Channel Strategy
      • Lewis Confectionery Pty Ltd
        • Overview
        • Product Portfolio
        • Profitability by Market Segments (Product/Age /Sales Channel/Region)
        • Sales Footprint
        • Strategy Overview
          • Marketing Strategy
          • Product Strategy
          • Channel Strategy
      • Frontier Co-op
        • Overview
        • Product Portfolio
        • Profitability by Market Segments (Product/Age /Sales Channel/Region)
        • Sales Footprint
        • Strategy Overview
          • Marketing Strategy
          • Product Strategy
          • Channel Strategy
      • Oak Haven Inc.
        • Overview
        • Product Portfolio
        • Profitability by Market Segments (Product/Age /Sales Channel/Region)
        • Sales Footprint
        • Strategy Overview
          • Marketing Strategy
          • Product Strategy
          • Channel Strategy
  20. Assumptions & Acronyms Used
  21. Research Methodology

List of Tables

  • Table 1: Global Market Value (USD Million) Forecast by Region, 2020-2035
  • Table 2: Global Market Volume (Kilotons) Forecast by Region, 2020-2035
  • Table 3: Global Market Value (USD Million) Forecast by Form, 2020-2035
  • Table 4: Global Market Volume (Kilotons) Forecast by Form, 2020-2035
  • Table 5: Global Market Value (USD Million) Forecast by Distribution Channel, 2020-2035
  • Table 6: Global Market Volume (Kilotons) Forecast by Distribution Channel, 2020-2035
  • Table 7: Global Market Value (USD Million) Forecast by Application, 2020-2035
  • Table 8: Global Market Volume (Kilotons) Forecast by Application, 2020-2035
  • Table 9: North America Market Value (USD Million) Forecast by Country, 2020-2035
  • Table 10: North America Market Volume (Kilotons) Forecast by Country, 2020-2035
  • Table 11: North America Market Value (USD Million) Forecast by Form, 2020-2035
  • Table 12: North America Market Volume (Kilotons) Forecast by Form, 2020-2035
  • Table 13: North America Market Value (USD Million) Forecast by Distribution Channel, 2020-2035
  • Table 14: North America Market Volume (Kilotons) Forecast by Distribution Channel, 2020-2035
  • Table 15: North America Market Value (USD Million) Forecast by Application, 2020-2035
  • Table 16: North America Market Volume (Kilotons) Forecast by Application, 2020-2035
  • Table 17: Latin America Market Value (USD Million) Forecast by Country, 2020-2035
  • Table 18: Latin America Market Volume (Kilotons) Forecast by Country, 2020-2035
  • Table 19: Latin America Market Value (USD Million) Forecast by Form, 2020-2035
  • Table 20: Latin America Market Volume (Kilotons) Forecast by Form, 2020-2035
  • Table 21: Latin America Market Value (USD Million) Forecast by Distribution Channel, 2020-2035
  • Table 22: Latin America Market Volume (Kilotons) Forecast by Distribution Channel, 2020-2035
  • Table 23: Latin America Market Value (USD Million) Forecast by Application, 2020-2035
  • Table 24: Latin America Market Volume (Kilotons) Forecast by Application, 2020-2035
  • Table 25: Western Europe Market Value (USD Million) Forecast by Country, 2020-2035
  • Table 26: Western Europe Market Volume (Kilotons) Forecast by Country, 2020-2035
  • Table 27: Western Europe Market Value (USD Million) Forecast by Form, 2020-2035
  • Table 28: Western Europe Market Volume (Kilotons) Forecast by Form, 2020-2035
  • Table 29: Western Europe Market Value (USD Million) Forecast by Distribution Channel, 2020-2035
  • Table 30: Western Europe Market Volume (Kilotons) Forecast by Distribution Channel, 2020-2035
  • Table 31: Western Europe Market Value (USD Million) Forecast by Application, 2020-2035
  • Table 32: Western Europe Market Volume (Kilotons) Forecast by Application, 2020-2035
  • Table 33: Eastern Europe Market Value (USD Million) Forecast by Country, 2020-2035
  • Table 34: Eastern Europe Market Volume (Kilotons) Forecast by Country, 2020-2035
  • Table 35: Eastern Europe Market Value (USD Million) Forecast by Form, 2020-2035
  • Table 36: Eastern Europe Market Volume (Kilotons) Forecast by Form, 2020-2035
  • Table 37: Eastern Europe Market Value (USD Million) Forecast by Distribution Channel, 2020-2035
  • Table 38: Eastern Europe Market Volume (Kilotons) Forecast by Distribution Channel, 2020-2035
  • Table 39: Eastern Europe Market Value (USD Million) Forecast by Application, 2020-2035
  • Table 40: Eastern Europe Market Volume (Kilotons) Forecast by Application, 2020-2035
  • Table 41: East Asia Market Value (USD Million) Forecast by Country, 2020-2035
  • Table 42: East Asia Market Volume (Kilotons) Forecast by Country, 2020-2035
  • Table 43: East Asia Market Value (USD Million) Forecast by Form, 2020-2035
  • Table 44: East Asia Market Volume (Kilotons) Forecast by Form, 2020-2035
  • Table 45: East Asia Market Value (USD Million) Forecast by Distribution Channel, 2020-2035
  • Table 46: East Asia Market Volume (Kilotons) Forecast by Distribution Channel, 2020-2035
  • Table 47: East Asia Market Value (USD Million) Forecast by Application, 2020-2035
  • Table 48: East Asia Market Volume (Kilotons) Forecast by Application, 2020-2035
  • Table 49: South Asia & Pacific Market Value (USD Million) Forecast by Country, 2020-2035
  • Table 50: South Asia & Pacific Market Volume (Kilotons) Forecast by Country, 2020-2035
  • Table 51: South Asia & Pacific Market Value (USD Million) Forecast by Form, 2020-2035
  • Table 52: South Asia & Pacific Market Volume (Kilotons) Forecast by Form, 2020-2035
  • Table 53: South Asia & Pacific Market Value (USD Million) Forecast by Distribution Channel, 2020-2035
  • Table 54: South Asia & Pacific Market Volume (Kilotons) Forecast by Distribution Channel, 2020-2035
  • Table 55: South Asia & Pacific Market Value (USD Million) Forecast by Application, 2020-2035
  • Table 56: South Asia & Pacific Market Volume (Kilotons) Forecast by Application, 2020-2035
  • Table 57: Middle East and Africa Market Value (USD Million) Forecast by Country, 2020-2035
  • Table 58: Middle East and Africa Market Volume (Kilotons) Forecast by Country, 2020-2035
  • Table 59: Middle East and Africa Market Value (USD Million) Forecast by Form, 2020-2035
  • Table 60: Middle East and Africa Market Volume (Kilotons) Forecast by Form, 2020-2035
  • Table 61: Middle East and Africa Market Value (USD Million) Forecast by Distribution Channel, 2020-2035
  • Table 62: Middle East and Africa Market Volume (Kilotons) Forecast by Distribution Channel, 2020-2035
  • Table 63: Middle East and Africa Market Value (USD Million) Forecast by Application, 2020-2035
  • Table 64: Middle East and Africa Market Volume (Kilotons) Forecast by Application, 2020-2035

List of Figures

  • Figure 1: Global Market Volume (Kilotons) Forecast 2020-2035
  • Figure 2: Global Market Pricing Analysis
  • Figure 3: Global Market Value (USD Million) Forecast 2020-2035
  • Figure 4: Global Market Value Share and BPS Analysis by Form, 2025 and 2035
  • Figure 5: Global Market Y-o-Y Growth Comparison by Form, 2025-2035
  • Figure 6: Global Market Attractiveness Analysis by Form
  • Figure 7: Global Market Value Share and BPS Analysis by Distribution Channel, 2025 and 2035
  • Figure 8: Global Market Y-o-Y Growth Comparison by Distribution Channel, 2025-2035
  • Figure 9: Global Market Attractiveness Analysis by Distribution Channel
  • Figure 10: Global Market Value Share and BPS Analysis by Application, 2025 and 2035
  • Figure 11: Global Market Y-o-Y Growth Comparison by Application, 2025-2035
  • Figure 12: Global Market Attractiveness Analysis by Application
  • Figure 13: Global Market Value (USD Million) Share and BPS Analysis by Region, 2025 and 2035
  • Figure 14: Global Market Y-o-Y Growth Comparison by Region, 2025-2035
  • Figure 15: Global Market Attractiveness Analysis by Region
  • Figure 16: North America Market Incremental $ Opportunity, 2025-2035
  • Figure 17: Latin America Market Incremental $ Opportunity, 2025-2035
  • Figure 18: Western Europe Market Incremental $ Opportunity, 2025-2035
  • Figure 19: Eastern Europe Market Incremental $ Opportunity, 2025-2035
  • Figure 20: East Asia Market Incremental $ Opportunity, 2025-2035
  • Figure 21: South Asia & Pacific Market Incremental $ Opportunity, 2025-2035
  • Figure 22: Middle East and Africa Market Incremental $ Opportunity, 2025-2035
  • Figure 23: North America Market Value Share and BPS Analysis by Country, 2025 and 2035
  • Figure 24: North America Market Value Share and BPS Analysis by Form, 2025 and 2035
  • Figure 25: North America Market Y-o-Y Growth Comparison by Form, 2025-2035
  • Figure 26: North America Market Attractiveness Analysis by Form
  • Figure 27: North America Market Value Share and BPS Analysis by Distribution Channel, 2025 and 2035
  • Figure 28: North America Market Y-o-Y Growth Comparison by Distribution Channel, 2025-2035
  • Figure 29: North America Market Attractiveness Analysis by Distribution Channel
  • Figure 30: North America Market Value Share and BPS Analysis by Application, 2025 and 2035
  • Figure 31: North America Market Y-o-Y Growth Comparison by Application, 2025-2035
  • Figure 32: North America Market Attractiveness Analysis by Application
  • Figure 33: Latin America Market Value Share and BPS Analysis by Country, 2025 and 2035
  • Figure 34: Latin America Market Value Share and BPS Analysis by Form, 2025 and 2035
  • Figure 35: Latin America Market Y-o-Y Growth Comparison by Form, 2025-2035
  • Figure 36: Latin America Market Attractiveness Analysis by Form
  • Figure 37: Latin America Market Value Share and BPS Analysis by Distribution Channel, 2025 and 2035
  • Figure 38: Latin America Market Y-o-Y Growth Comparison by Distribution Channel, 2025-2035
  • Figure 39: Latin America Market Attractiveness Analysis by Distribution Channel
  • Figure 40: Latin America Market Value Share and BPS Analysis by Application, 2025 and 2035
  • Figure 41: Latin America Market Y-o-Y Growth Comparison by Application, 2025-2035
  • Figure 42: Latin America Market Attractiveness Analysis by Application
  • Figure 43: Western Europe Market Value Share and BPS Analysis by Country, 2025 and 2035
  • Figure 44: Western Europe Market Value Share and BPS Analysis by Form, 2025 and 2035
  • Figure 45: Western Europe Market Y-o-Y Growth Comparison by Form, 2025-2035
  • Figure 46: Western Europe Market Attractiveness Analysis by Form
  • Figure 47: Western Europe Market Value Share and BPS Analysis by Distribution Channel, 2025 and 2035
  • Figure 48: Western Europe Market Y-o-Y Growth Comparison by Distribution Channel, 2025-2035
  • Figure 49: Western Europe Market Attractiveness Analysis by Distribution Channel
  • Figure 50: Western Europe Market Value Share and BPS Analysis by Application, 2025 and 2035
  • Figure 51: Western Europe Market Y-o-Y Growth Comparison by Application, 2025-2035
  • Figure 52: Western Europe Market Attractiveness Analysis by Application
  • Figure 53: Eastern Europe Market Value Share and BPS Analysis by Country, 2025 and 2035
  • Figure 54: Eastern Europe Market Value Share and BPS Analysis by Form, 2025 and 2035
  • Figure 55: Eastern Europe Market Y-o-Y Growth Comparison by Form, 2025-2035
  • Figure 56: Eastern Europe Market Attractiveness Analysis by Form
  • Figure 57: Eastern Europe Market Value Share and BPS Analysis by Distribution Channel, 2025 and 2035
  • Figure 58: Eastern Europe Market Y-o-Y Growth Comparison by Distribution Channel, 2025-2035
  • Figure 59: Eastern Europe Market Attractiveness Analysis by Distribution Channel
  • Figure 60: Eastern Europe Market Value Share and BPS Analysis by Application, 2025 and 2035
  • Figure 61: Eastern Europe Market Y-o-Y Growth Comparison by Application, 2025-2035
  • Figure 62: Eastern Europe Market Attractiveness Analysis by Application
  • Figure 63: East Asia Market Value Share and BPS Analysis by Country, 2025 and 2035
  • Figure 64: East Asia Market Value Share and BPS Analysis by Form, 2025 and 2035
  • Figure 65: East Asia Market Y-o-Y Growth Comparison by Form, 2025-2035
  • Figure 66: East Asia Market Attractiveness Analysis by Form
  • Figure 67: East Asia Market Value Share and BPS Analysis by Distribution Channel, 2025 and 2035
  • Figure 68: East Asia Market Y-o-Y Growth Comparison by Distribution Channel, 2025-2035
  • Figure 69: East Asia Market Attractiveness Analysis by Distribution Channel
  • Figure 70: East Asia Market Value Share and BPS Analysis by Application, 2025 and 2035
  • Figure 71: East Asia Market Y-o-Y Growth Comparison by Application, 2025-2035
  • Figure 72: East Asia Market Attractiveness Analysis by Application
  • Figure 73: South Asia & Pacific Market Value Share and BPS Analysis by Country, 2025 and 2035
  • Figure 74: South Asia & Pacific Market Value Share and BPS Analysis by Form, 2025 and 2035
  • Figure 75: South Asia & Pacific Market Y-o-Y Growth Comparison by Form, 2025-2035
  • Figure 76: South Asia & Pacific Market Attractiveness Analysis by Form
  • Figure 77: South Asia & Pacific Market Value Share and BPS Analysis by Distribution Channel, 2025 and 2035
  • Figure 78: South Asia & Pacific Market Y-o-Y Growth Comparison by Distribution Channel, 2025-2035
  • Figure 79: South Asia & Pacific Market Attractiveness Analysis by Distribution Channel
  • Figure 80: South Asia & Pacific Market Value Share and BPS Analysis by Application, 2025 and 2035
  • Figure 81: South Asia & Pacific Market Y-o-Y Growth Comparison by Application, 2025-2035
  • Figure 82: South Asia & Pacific Market Attractiveness Analysis by Application
  • Figure 83: Middle East and Africa Market Value Share and BPS Analysis by Country, 2025 and 2035
  • Figure 84: Middle East and Africa Market Value Share and BPS Analysis by Form, 2025 and 2035
  • Figure 85: Middle East and Africa Market Y-o-Y Growth Comparison by Form, 2025-2035
  • Figure 86: Middle East and Africa Market Attractiveness Analysis by Form
  • Figure 87: Middle East and Africa Market Value Share and BPS Analysis by Distribution Channel, 2025 and 2035
  • Figure 88: Middle East and Africa Market Y-o-Y Growth Comparison by Distribution Channel, 2025-2035
  • Figure 89: Middle East and Africa Market Attractiveness Analysis by Distribution Channel
  • Figure 90: Middle East and Africa Market Value Share and BPS Analysis by Application, 2025 and 2035
  • Figure 91: Middle East and Africa Market Y-o-Y Growth Comparison by Application, 2025-2035
  • Figure 92: Middle East and Africa Market Attractiveness Analysis by Application
  • Figure 93: Global Market - Tier Structure Analysis
  • Figure 94: Global Market - Company Share Analysis

Frequently Asked Questions

How big is the carob market in 2025?

The global carob market is estimated to be valued at USD 792.6 million in 2025.

What will be the size of the carob market in 2035?

The market size for carob is projected to reach USD 1,173.3 million by 2035.

How much will be the carob market growth between 2025 and 2035?

The carob market is expected to grow at a 4.0% CAGR between 2025 and 2035.

Which form is projected to lead in the carob market in 2025?

The solid form is projected to lead in the carob market with 58% market share in 2025.

Which distribution channel segment is expected to dominate the carob market in 2025?

The health stores segment is expected to dominate with 42% market share in 2025.

Future Market Insights

Carob Market

Chat With

MaRIA

Hi There, I am MaRIA, Your Market Research Intelligence Assistant. How may I help you?