Chassis Dynamometers Market
Market Insights on Chassis Dynamometers covering sales outlook, demand forecast & up-to-date key trends
Chassis Dynamometers Market by Type, End User & Region - Forecast 2022 - 2032
Chassis Dynamometers Market Snapshot (2022-2032)
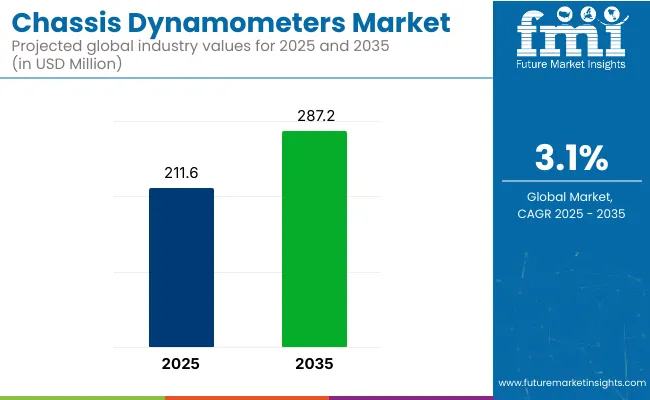
[294 Pages Report] The global chassis dynamometers market is anticipated to be valued at US$ 196.4 Million in 2022, forecast to grow at a CAGR of 2.5% to be valued at US$ 250.9 Million from 2022 to 2032. Growth of the market is attributed to an increase in automation. During the historical period ranging from 2016-2021, the market experienced an upswing at a CAGR of 2%.
Report Attribute |
Key Statistics |
Growth Rate (2016-2021) |
US$ 2.0% CAGR |
Expected Market Value (2022) |
US$ 196.4 Million |
Anticipated Forecast Value (2032) |
US$ 250.9 Million |
Projected Growth Rate (2022-2032) |
2.5% CAGR |
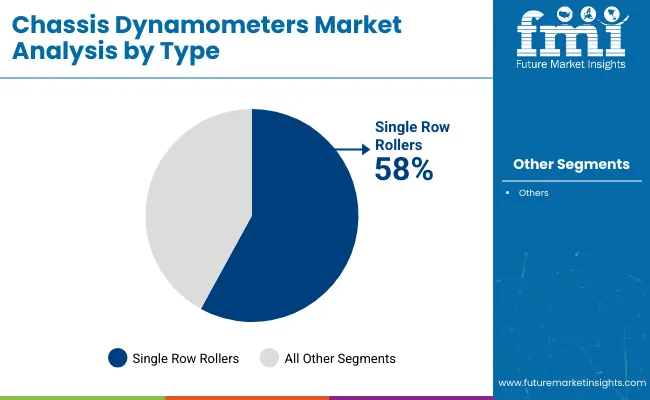
Chassis dynamometers are generally available in two types, i.e., single row of rollers and double row of rollers. Chassis dynamometers are very useful for analyzing suspension problems, determining output in torque and horsepower, tuning the engine and testing vehicle performance. Thus, the Chassis dynamometers are highly preferred in the developing countries owing to its benefits.
Factors such as high accuracy and modularity are expected to boost the growth of the chassis dynamometers market during the forecast period. Chassis dynamometer is a part of test equipment involving a platform with a pair of rollers, braking absorption system and software to calculate power output. It is proficient of providing drive input and measuring output, such as torque and power at the wheels.
On the contrary, frictional and mechanical losses in various drivetrain components are expected to act as restraining factors in the growth of chassis dynamometers market during the forecast period.
Let us know your requirement to get
100% FREE customization
Which are Some Prominent Drivers Spearheading Chassis Dynamometers Market Growth?
The major factors that are expected to augment the growth of the chassis dynamometer market over the forecast period include accuracy of the measurement and high repetitiveness. In addition, possibility of the easy upgrade and the modularity of solutions are also expected to accelerate the growth of the chassis dynamometer market in the forthcoming years.
Advantages of chassis dynamometers such as no limitation on the complexity of test cycle, fuel economy and exhaust emission, which can be measured simultaneously and measurement can be made over a wide temperature range, are anticipated to fuel the growth of the chassis dynamometers market in the near future. Additionally, high labor cost and an increase in automation are also expected to give traction to the growth of chassis dynamometers market over the analysis period.
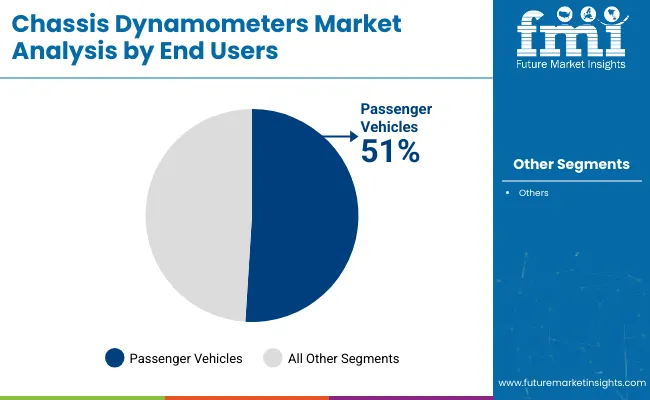
Furthermore, dynamometers can also be used for a variety of engine development activities such as calibration of engine management controller. Chassis dynamometers are used by various end users such as passenger and commercial vehicles to perform tests involving emission performance, environmental performance and horsepower performance. These factors are expected to propel the growth of the Chassis Dynamometers over the analysis period.
What are the Challenges Faced by the Chassis Dynamometers Industry?
Risk of incorrect inertia and frequent friction losses are the major factors that are expected to impede the growth of the chassis dynamometer market over the analysis period. Some chassis dynamometers may give rise to incorrect inertia loading of the vehicle owing to large intervals in inertia weight. This is expected to be a major factor hindering the growth of the chassis dynamometers market over the forecast period. Moreover, total load simulated on the chassis dynamometers may not duplicate the rolling resistance of vehicle.
In addition, frictional and mechanical losses in various drivetrain components also act as restraining factors in the growth of chassis dynamometers market.
Find your sweet spots for generating winning opportunities in this market.
Talk to AnalystWhy is North America Emerging as an Opportunistic Chassis Dynamometers Market?
In terms of regional platform, North America holds a significant market share in Chassis Dynamometers market. The region is expected to accumulate a market share of 14% in 2022.
North America is projected to account for a major share of the global chassis dynamometers market during the forecast period. The market in the region is anticipated to expand at a rapid pace in the next few years owing to the growing consumer awareness regarding benefits of chassis dynamometers over other dynamometers.
How is Europe Contributing to Growth of the Chassis Dynamometers Market?
According to Future Market Insights, Europe is expected to provide immense growth opportunities for chassis dynamometers, and is expected to accumulate a market share of 18% in 2022.
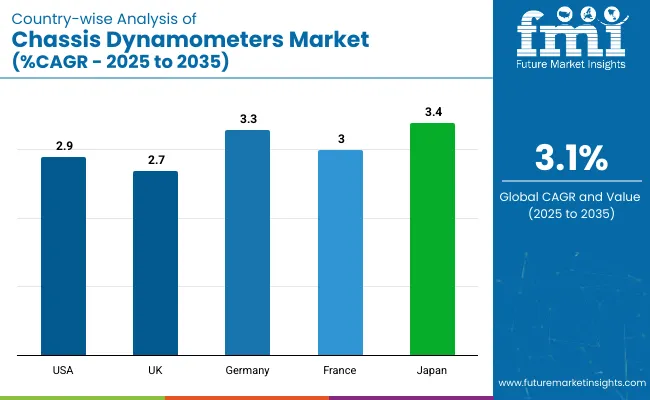
Europe is expected to be the largest chassis dynamometers market during the forecast period owing to the countries such as Germany, Italy and France witnessing economic growth for the chassis dynamometer market owing to preference of electric dynamometer over the other types of dynamometers.

An unified Market Research Subscription Platform, built for today’s disparate research needs.
Role of Start-ups in Chassis Dynamometers Market
There are many prominent market players in the Chassis Dynamometers Market, that are working hand-in-hand to provide the best-in-class products for enhancing the global dynamometers arena. However, there are many global start-ups in the chassis dynamometers market, which are stepping forward in matching the requirements of the global domain.
Global Startups of Chassis Dynamometers Market |
|
Market Competition
Some of the key participants present in the global Chassis Dynamometers market include MTS Systems Corporation, MEIDENSHA CORPORATION, HORIBA, Ltd., Rototest, Schenck RoTec GmbH, Mustang Advanced Engineering, Dyno Dynamics, Maha Maschinenbau Haldenwang GmbH, V-tech Dynamometers, Dynocom Industries, Inc., Elektrodyne, Mustang Dynamometer, and SuperFlow Dynamometers & Flowbenches, among others.
Attributed to the presence of such high number of participants, the market is highly competitive. While global players such as MTS Systems Corporation, MEIDENSHA CORPORATION, HORIBA, Ltd., Rototest, and Schenck RoTec GmbH account for a considerable market size, several regional level players are also operating across key growth regions, particularly in Europe.
Recent Developments:
- In June 2022, Sentronics partnered with HORIBA UK to launch the next generation Ultrasonic Fuel Consumption Measurement Sensor, the HORIBA RealFlow: Powered by Sentronics, for the automotive industry. Featuring the latest innovative advancements and patented technology in ultrasonic fuel flow sensing, the HORIBA RealFlow provides true under-bonnet installation and real-time measurement of fuel consumption for automotive validation and verification test applications.
- In March 2021, Schenck RoTec Introduced CAST 2, an enhanced version of CAST (Computer-Aided Spin Testing), which appears in a more modern interface and with the capability for further modular extension. The software features a modern and intuitive user interface. As the central system on a spin-testing rig, it records a wide range of measurement data and analyzes and monitors all parameters. The software supports up to 64 analog and digital measurement channels - e.g. for speed, shaft vibration, vacuum and temperature.
Report Scope
Report Attribute |
Details |
Growth Rate |
CAGR of 2.5% from 2022 to 2032 |
Market Value in 2022 |
US$ 196.4 Million |
Market Value in 2032 |
US$ 250.9 Million |
Base Year for Estimation |
2021 |
Historical Data |
2016-2021 |
Forecast Period |
2022-2032 |
Quantitative Units |
Revenue in US$ Million and CAGR from 2022-2032 |
Report Coverage |
Revenue Forecast, Volume Forecast, Company Ranking, Competitive Landscape, Growth Factors, Trends and Pricing Analysis |
Segments Covered |
|
Regions Covered |
|
Key Countries Profiled |
|
Key Companies Profiled |
|
Customization |
Available Upon Request |
Key Segments Profiled in the Chassis Dynamometers Industry Survey
Chassis Dynamometers Market by Type:
- Single Row Rollers Chassis Dynamometers
- Double Row Rollers Chassis Dynamometers
Chassis Dynamometers Market by End User:
- Chassis Dynamometers for Light Commercial Vehicles
- Chassis Dynamometers for Heavy Commercial Vehicles
- Chassis Dynamometers for Passenger Vehicles
- Chassis Dynamometers for Racing Vehicles
Chassis Dynamometers Market By Region:
- North America Chassis Dynamometers Market
- Latin America Chassis Dynamometers Market
- Europe Chassis Dynamometers Market
- Asia Pacific Chassis Dynamometers Market
- Middle East & Africa& Chassis Dynamometers Market
Frequently Asked Questions
FMI projects the global chassis dynamometers market to expand at a 2.5% value CAGR by 2032.
Europe is expected to be the most opportunistic chassis dynamometers market, accounting for 18% of the total market .
MTS Systems Corporation, MEIDENSHA CORPORATION, HORIBA, Ltd., Rototest, and Schenck RoTec GmbH are some prominent Chassis Dynamometers manufacturers.
Table of Content
1. Executive Summary
1.1. Global Market Outlook
1.2. Demand-side Trends
1.3. Supply-side Trends
1.4. Technology Roadmap Analysis
1.5. Analysis and Recommendations
2. Market Overview
2.1. Market Coverage / Taxonomy
2.2. Market Definition / Scope / Limitations
3. Market Background
3.1. Market Dynamics
3.1.1. Drivers
3.1.2. Restraints
3.1.3. Opportunity
3.1.4. Trends
3.2. Scenario Forecast
3.2.1. Demand in Optimistic Scenario
3.2.2. Demand in Likely Scenario
3.2.3. Demand in Conservative Scenario
3.3. Opportunity Map Analysis
3.4. Product Life Cycle Analysis
3.5. Supply Chain Analysis
3.5.1. Supply Side Participants and their Roles
3.5.1.1. Producers
3.5.1.2. Mid-Level Participants (Traders/ Agents/ Brokers)
3.5.1.3. Wholesalers and Distributors
3.5.2. Value Added and Value Created at Node in the Supply Chain
3.5.3. List of Raw Material Suppliers
3.5.4. List of Existing and Potential Buyer’s
3.6. Investment Feasibility Matrix
3.7. Value Chain Analysis
3.7.1. Profit Margin Analysis
3.7.2. Wholesalers and Distributors
3.7.3. Retailers
3.8. PESTLE and Porter’s Analysis
3.9. Regulatory Landscape
3.9.1. By Key Regions
3.9.2. By Key Countries
3.10. Regional Parent Market Outlook
3.11. Production and Consumption Statistics
3.12. Import and Export Statistics
4. Global Chassis Dynamometers Market Analysis 2017-2021 and Forecast, 2022-2032
4.1. Historical Market Size Value (US$ Mn) & Volume (Units) Analysis, 2017-2021
4.2. Current and Future Market Size Value (US$ Mn) & Volume (Units) Projections, 2022-2032
4.2.1. Y-o-Y Growth Trend Analysis
4.2.2. Absolute $ Opportunity Analysis
5. Global Chassis Dynamometers Market Analysis 2017-2021 and Forecast 2022-2032, By Type
5.1. Introduction / Key Findings
5.2. Historical Market Size Value (US$ Mn) & Volume (Units) Analysis By Type, 2017-2021
5.3. Current and Future Market Size Value (US$ Mn) & Volume (Units) Analysis and Forecast By Type, 2022-2032
5.3.1. Single Row of Rollers
5.3.2. Double Row of Rollers
5.4. Y-o-Y Growth Trend Analysis By Type, 2017-2021
5.5. Absolute $ Opportunity Analysis By Type, 2022-2032
6. Global Chassis Dynamometers Market Analysis 2017-2021 and Forecast 2022-2032, By End Use
6.1. Introduction / Key Findings
6.2. Historical Market Size Value (US$ Mn) & Volume (Units) Analysis By End Use, 2017-2021
6.3. Current and Future Market Size Value (US$ Mn) & Volume (Units) Analysis and Forecast By End Use, 2022-2032
6.3.1. Light Commercial Vehicle
6.3.2. Heavy Commercial Vehicle
6.3.3. Passenger Vehicle
6.3.4. Racing Vehicle
6.4. Y-o-Y Growth Trend Analysis By End Use, 2017-2021
6.5. Absolute $ Opportunity Analysis By End Use, 2022-2032
7. Global Chassis Dynamometers Market Analysis 2017-2021 and Forecast 2022-2032, By Region
7.1. Introduction
7.2. Historical Market Size Value (US$ Mn) & Volume (Units) Analysis By Region, 2017-2021
7.3. Current Market Size Value (US$ Mn) & Volume (Units) Analysis and Forecast By Region, 2022-2032
7.3.1. North America
7.3.2. Latin America
7.3.3. Europe
7.3.4. Asia Pacific
7.3.5. MEA
7.4. Market Attractiveness Analysis By Region
8. North America Chassis Dynamometers Market Analysis 2017-2021 and Forecast 2022-2032, By Country
8.1. Historical Market Size Value (US$ Mn) & Volume (Units) Trend Analysis By Market Taxonomy, 2017-2021
8.2. Market Size Value (US$ Mn) & Volume (Units) Forecast By Market Taxonomy, 2022-2032
8.2.1. By Country
8.2.1.1. U.S.
8.2.1.2. Canada
8.2.2. By Type
8.2.3. By End Use
8.3. Market Attractiveness Analysis
8.3.1. By Country
8.3.2. By Type
8.3.3. By End Use
8.4. Key Takeaways
9. Latin America Chassis Dynamometers Market Analysis 2017-2021 and Forecast 2022-2032, By Country
9.1. Historical Market Size Value (US$ Mn) & Volume (Units) Trend Analysis By Market Taxonomy, 2017-2021
9.2. Market Size Value (US$ Mn) & Volume (Units) Forecast By Market Taxonomy, 2022-2032
9.2.1. By Country
9.2.1.1. Brazil
9.2.1.2. Mexico
9.2.1.3. Rest of Latin America
9.2.2. By Type
9.2.3. By End Use
9.3. Market Attractiveness Analysis
9.3.1. By Country
9.3.2. By Type
9.3.3. By End Use
9.4. Key Takeaways
10. Europe Chassis Dynamometers Market Analysis 2017-2021 and Forecast 2022-2032, By Country
10.1. Historical Market Size Value (US$ Mn) & Volume (Units) Trend Analysis By Market Taxonomy, 2017-2021
10.2. Market Size Value (US$ Mn) & Volume (Units) Forecast By Market Taxonomy, 2022-2032
10.2.1. By Country
10.2.1.1. Germany
10.2.1.2. U.K.
10.2.1.3. France
10.2.1.4. Spain
10.2.1.5. Italy
10.2.1.6. Rest of Europe
10.2.2. By Type
10.2.3. By End Use
10.3. Market Attractiveness Analysis
10.3.1. By Country
10.3.2. By Type
10.3.3. By End Use
10.4. Key Takeaways
11. Asia Pacific Chassis Dynamometers Market Analysis 2017-2021 and Forecast 2022-2032, By Country
11.1. Historical Market Size Value (US$ Mn) & Volume (Units) Trend Analysis By Market Taxonomy, 2017-2021
11.2. Market Size Value (US$ Mn) & Volume (Units) Forecast By Market Taxonomy, 2022-2032
11.2.1. By Country
11.2.1.1. China
11.2.1.2. Japan
11.2.1.3. South Korea
11.2.1.4. Malaysia
11.2.1.5. Singapore
11.2.1.6. Australia
11.2.1.7. New Zealand
11.2.1.8. Rest of APAC
11.2.2. By Type
11.2.3. By End Use
11.3. Market Attractiveness Analysis
11.3.1. By Country
11.3.2. By Type
11.3.3. By End Use
11.4. Key Takeaways
12. MEA Chassis Dynamometers Market Analysis 2017-2021 and Forecast 2022-2032, By Country
12.1. Historical Market Size Value (US$ Mn) & Volume (Units) Trend Analysis By Market Taxonomy, 2017-2021
12.2. Market Size Value (US$ Mn) & Volume (Units) Forecast By Market Taxonomy, 2022-2032
12.2.1. By Country
12.2.1.1. GCC Countries
12.2.1.2. South Africa
12.2.1.3. Israel
12.2.1.4. Rest of MEA
12.2.2. By Type
12.2.3. By End Use
12.3. Market Attractiveness Analysis
12.3.1. By Country
12.3.2. By Type
12.3.3. By End Use
12.4. Key Takeaways
13. Key Countries Chassis Dynamometers Market Analysis
13.1. U.S.
13.1.1. Pricing Analysis
13.1.2. Market Share Analysis, 2021
13.1.2.1. By Type
13.1.2.2. By End Use
13.2. Canada
13.2.1. Pricing Analysis
13.2.2. Market Share Analysis, 2021
13.2.2.1. By Type
13.2.2.2. By End Use
13.3. Brazil
13.3.1. Pricing Analysis
13.3.2. Market Share Analysis, 2021
13.3.2.1. By Type
13.3.2.2. By End Use
13.4. Mexico
13.4.1. Pricing Analysis
13.4.2. Market Share Analysis, 2021
13.4.2.1. By Type
13.4.2.2. By End Use
13.5. Germany
13.5.1. Pricing Analysis
13.5.2. Market Share Analysis, 2021
13.5.2.1. By Type
13.5.2.2. By End Use
13.6. U.K.
13.6.1. Pricing Analysis
13.6.2. Market Share Analysis, 2021
13.6.2.1. By Type
13.6.2.2. By End Use
13.7. France
13.7.1. Pricing Analysis
13.7.2. Market Share Analysis, 2021
13.7.2.1. By Type
13.7.2.2. By End Use
13.8. Spain
13.8.1. Pricing Analysis
13.8.2. Market Share Analysis, 2021
13.8.2.1. By Type
13.8.2.2. By End Use
13.9. Italy
13.9.1. Pricing Analysis
13.9.2. Market Share Analysis, 2021
13.9.2.1. By Type
13.9.2.2. By End Use
13.10. China
13.10.1. Pricing Analysis
13.10.2. Market Share Analysis, 2021
13.10.2.1. By Type
13.10.2.2. By End Use
13.11. Japan
13.11.1. Pricing Analysis
13.11.2. Market Share Analysis, 2021
13.11.2.1. By Type
13.11.2.2. By End Use
13.12. South Korea
13.12.1. Pricing Analysis
13.12.2. Market Share Analysis, 2021
13.12.2.1. By Type
13.12.2.2. By End Use
13.13. Malaysia
13.13.1. Pricing Analysis
13.13.2. Market Share Analysis, 2021
13.13.2.1. By Type
13.13.2.2. By End Use
13.14. Singapore
13.14.1. Pricing Analysis
13.14.2. Market Share Analysis, 2021
13.14.2.1. By Type
13.14.2.2. By End Use
13.15. Australia
13.15.1. Pricing Analysis
13.15.2. Market Share Analysis, 2021
13.15.2.1. By Type
13.15.2.2. By End Use
13.16. New Zealand
13.16.1. Pricing Analysis
13.16.2. Market Share Analysis, 2021
13.16.2.1. By Type
13.16.2.2. By End Use
13.17. GCC Countries
13.17.1. Pricing Analysis
13.17.2. Market Share Analysis, 2021
13.17.2.1. By Type
13.17.2.2. By End Use
13.18. South Africa
13.18.1. Pricing Analysis
13.18.2. Market Share Analysis, 2021
13.18.2.1. By Type
13.18.2.2. By End Use
13.19. Israel
13.19.1. Pricing Analysis
13.19.2. Market Share Analysis, 2021
13.19.2.1. By Type
13.19.2.2. By End Use
14. Market Structure Analysis
14.1. Competition Dashboard
14.2. Competition Benchmarking
14.3. Market Share Analysis of Top Players
14.3.1. By Regional
14.3.2. By Type
14.3.3. By End Use
15. Competition Analysis
15.1. Competition Deep Dive
15.1.1. MTS Systems Corporation
15.1.1.1. Overview
15.1.1.2. Product Portfolio
15.1.1.3. Profitability by Market Segments
15.1.1.4. Sales Footprint
15.1.1.5. Strategy Overview
15.1.1.5.1. Marketing Strategy
15.1.1.5.2. Product Strategy
15.1.1.5.3. Channel Strategy
15.1.2. MEIDENSHA CORPORATION
15.1.2.1. Overview
15.1.2.2. Product Portfolio
15.1.2.3. Profitability by Market Segments
15.1.2.4. Sales Footprint
15.1.2.5. Strategy Overview
15.1.2.5.1. Marketing Strategy
15.1.2.5.2. Product Strategy
15.1.2.5.3. Channel Strategy
15.1.3. HORIBA, Ltd.
15.1.3.1. Overview
15.1.3.2. Product Portfolio
15.1.3.3. Profitability by Market Segments
15.1.3.4. Sales Footprint
15.1.3.5. Strategy Overview
15.1.3.5.1. Marketing Strategy
15.1.3.5.2. Product Strategy
15.1.3.5.3. Channel Strategy
15.1.4. Rototest
15.1.4.1. Overview
15.1.4.2. Product Portfolio
15.1.4.3. Profitability by Market Segments
15.1.4.4. Sales Footprint
15.1.4.5. Strategy Overview
15.1.4.5.1. Marketing Strategy
15.1.4.5.2. Product Strategy
15.1.4.5.3. Channel Strategy
15.1.5. Schenck RoTec GmbH
15.1.5.1. Overview
15.1.5.2. Product Portfolio
15.1.5.3. Profitability by Market Segments
15.1.5.4. Sales Footprint
15.1.5.5. Strategy Overview
15.1.5.5.1. Marketing Strategy
15.1.5.5.2. Product Strategy
15.1.5.5.3. Channel Strategy
15.1.6. Mustang Advanced Engineering
15.1.6.1. Overview
15.1.6.2. Product Portfolio
15.1.6.3. Profitability by Market Segments
15.1.6.4. Sales Footprint
15.1.6.5. Strategy Overview
15.1.6.5.1. Marketing Strategy
15.1.6.5.2. Product Strategy
15.1.6.5.3. Channel Strategy
15.1.7. Dyno Dynamics
15.1.7.1. Overview
15.1.7.2. Product Portfolio
15.1.7.3. Profitability by Market Segments
15.1.7.4. Sales Footprint
15.1.7.5. Strategy Overview
15.1.7.5.1. Marketing Strategy
15.1.7.5.2. Product Strategy
15.1.7.5.3. Channel Strategy
15.1.8. Maha Maschinenbau Haldenwang GmbH
15.1.8.1. Overview
15.1.8.2. Product Portfolio
15.1.8.3. Profitability by Market Segments
15.1.8.4. Sales Footprint
15.1.8.5. Strategy Overview
15.1.8.5.1. Marketing Strategy
15.1.8.5.2. Product Strategy
15.1.8.5.3. Channel Strategy
15.1.9. V-tech Dynamometers
15.1.9.1. Overview
15.1.9.2. Product Portfolio
15.1.9.3. Profitability by Market Segments
15.1.9.4. Sales Footprint
15.1.9.5. Strategy Overview
15.1.9.5.1. Marketing Strategy
15.1.9.5.2. Product Strategy
15.1.9.5.3. Channel Strategy
15.1.10. Dynocom Industries, Inc.
15.1.10.1. Overview
15.1.10.2. Product Portfolio
15.1.10.3. Profitability by Market Segments
15.1.10.4. Sales Footprint
15.1.10.5. Strategy Overview
15.1.10.5.1. Marketing Strategy
15.1.10.5.2. Product Strategy
15.1.10.5.3. Channel Strategy
15.1.11. Elektrodyne
15.1.11.1. Overview
15.1.11.2. Product Portfolio
15.1.11.3. Profitability by Market Segments
15.1.11.4. Sales Footprint
15.1.11.5. Strategy Overview
15.1.11.5.1. Marketing Strategy
15.1.11.5.2. Product Strategy
15.1.11.5.3. Channel Strategy
15.1.12. SuperFlow Dynamometers & Flowbenches
15.1.12.1. Overview
15.1.12.2. Product Portfolio
15.1.12.3. Profitability by Market Segments
15.1.12.4. Sales Footprint
15.1.12.5. Strategy Overview
15.1.12.5.1. Marketing Strategy
15.1.12.5.2. Product Strategy
15.1.12.5.3. Channel Strategy
16. Assumptions & Acronyms Used
17. Research Methodology
Let us know your requirement to get
100% FREE customization
List of Tables
Table 1: Global Chassis Dynamometers Market Value (US$ Mn) Forecast by Region, 2017-2032
Table 2: Global Chassis Dynamometers Market Volume (Units) Forecast by Region, 2017-2032
Table 3: Global Chassis Dynamometers Market Value (US$ Mn) Forecast by Type, 2017-2032
Table 4: Global Chassis Dynamometers Market Volume (Units) Forecast by Type, 2017-2032
Table 5: Global Chassis Dynamometers Market Value (US$ Mn) Forecast by End Use, 2017-2032
Table 6: Global Chassis Dynamometers Market Volume (Units) Forecast by End Use, 2017-2032
Table 7: North America Chassis Dynamometers Market Value (US$ Mn) Forecast by Country, 2017-2032
Table 8: North America Chassis Dynamometers Market Volume (Units) Forecast by Country, 2017-2032
Table 9: North America Chassis Dynamometers Market Value (US$ Mn) Forecast by Type, 2017-2032
Table 10: North America Chassis Dynamometers Market Volume (Units) Forecast by Type, 2017-2032
Table 11: North America Chassis Dynamometers Market Value (US$ Mn) Forecast by End Use, 2017-2032
Table 12: North America Chassis Dynamometers Market Volume (Units) Forecast by End Use, 2017-2032
Table 13: Latin America Chassis Dynamometers Market Value (US$ Mn) Forecast by Country, 2017-2032
Table 14: Latin America Chassis Dynamometers Market Volume (Units) Forecast by Country, 2017-2032
Table 15: Latin America Chassis Dynamometers Market Value (US$ Mn) Forecast by Type, 2017-2032
Table 16: Latin America Chassis Dynamometers Market Volume (Units) Forecast by Type, 2017-2032
Table 17: Latin America Chassis Dynamometers Market Value (US$ Mn) Forecast by End Use, 2017-2032
Table 18: Latin America Chassis Dynamometers Market Volume (Units) Forecast by End Use, 2017-2032
Table 19: Europe Chassis Dynamometers Market Value (US$ Mn) Forecast by Country, 2017-2032
Table 20: Europe Chassis Dynamometers Market Volume (Units) Forecast by Country, 2017-2032
Table 21: Europe Chassis Dynamometers Market Value (US$ Mn) Forecast by Type, 2017-2032
Table 22: Europe Chassis Dynamometers Market Volume (Units) Forecast by Type, 2017-2032
Table 23: Europe Chassis Dynamometers Market Value (US$ Mn) Forecast by End Use, 2017-2032
Table 24: Europe Chassis Dynamometers Market Volume (Units) Forecast by End Use, 2017-2032
Table 25: Asia Pacific Chassis Dynamometers Market Value (US$ Mn) Forecast by Country, 2017-2032
Table 26: Asia Pacific Chassis Dynamometers Market Volume (Units) Forecast by Country, 2017-2032
Table 27: Asia Pacific Chassis Dynamometers Market Value (US$ Mn) Forecast by Type, 2017-2032
Table 28: Asia Pacific Chassis Dynamometers Market Volume (Units) Forecast by Type, 2017-2032
Table 29: Asia Pacific Chassis Dynamometers Market Value (US$ Mn) Forecast by End Use, 2017-2032
Table 30: Asia Pacific Chassis Dynamometers Market Volume (Units) Forecast by End Use, 2017-2032
Table 31: MEA Chassis Dynamometers Market Value (US$ Mn) Forecast by Country, 2017-2032
Table 32: MEA Chassis Dynamometers Market Volume (Units) Forecast by Country, 2017-2032
Table 33: MEA Chassis Dynamometers Market Value (US$ Mn) Forecast by Type, 2017-2032
Table 34: MEA Chassis Dynamometers Market Volume (Units) Forecast by Type, 2017-2032
Table 35: MEA Chassis Dynamometers Market Value (US$ Mn) Forecast by End Use, 2017-2032
Table 36: MEA Chassis Dynamometers Market Volume (Units) Forecast by End Use, 2017-2032
Find your sweet spots for generating winning opportunities in this market.
Talk to AnalystList of Charts
Figure 1: Global Chassis Dynamometers Market Value (US$ Mn) by Type, 2022-2032
Figure 2: Global Chassis Dynamometers Market Value (US$ Mn) by End Use, 2022-2032
Figure 3: Global Chassis Dynamometers Market Value (US$ Mn) by Region, 2022-2032
Figure 4: Global Chassis Dynamometers Market Value (US$ Mn) Analysis by Region, 2017-2032
Figure 5: Global Chassis Dynamometers Market Volume (Units) Analysis by Region, 2017-2032
Figure 6: Global Chassis Dynamometers Market Value Share (%) and BPS Analysis by Region, 2022-2032
Figure 7: Global Chassis Dynamometers Market Y-o-Y Growth (%) Projections by Region, 2022-2032
Figure 8: Global Chassis Dynamometers Market Value (US$ Mn) Analysis by Type, 2017-2032
Figure 9: Global Chassis Dynamometers Market Volume (Units) Analysis by Type, 2017-2032
Figure 10: Global Chassis Dynamometers Market Value Share (%) and BPS Analysis by Type, 2022-2032
Figure 11: Global Chassis Dynamometers Market Y-o-Y Growth (%) Projections by Type, 2022-2032
Figure 12: Global Chassis Dynamometers Market Value (US$ Mn) Analysis by End Use, 2017-2032
Figure 13: Global Chassis Dynamometers Market Volume (Units) Analysis by End Use, 2017-2032
Figure 14: Global Chassis Dynamometers Market Value Share (%) and BPS Analysis by End Use, 2022-2032
Figure 15: Global Chassis Dynamometers Market Y-o-Y Growth (%) Projections by End Use, 2022-2032
Figure 16: Global Chassis Dynamometers Market Attractiveness by Type, 2022-2032
Figure 17: Global Chassis Dynamometers Market Attractiveness by End Use, 2022-2032
Figure 18: Global Chassis Dynamometers Market Attractiveness by Region, 2022-2032
Figure 19: North America Chassis Dynamometers Market Value (US$ Mn) by Type, 2022-2032
Figure 20: North America Chassis Dynamometers Market Value (US$ Mn) by End Use, 2022-2032
Figure 21: North America Chassis Dynamometers Market Value (US$ Mn) by Country, 2022-2032
Figure 22: North America Chassis Dynamometers Market Value (US$ Mn) Analysis by Country, 2017-2032
Figure 23: North America Chassis Dynamometers Market Volume (Units) Analysis by Country, 2017-2032
Figure 24: North America Chassis Dynamometers Market Value Share (%) and BPS Analysis by Country, 2022-2032
Figure 25: North America Chassis Dynamometers Market Y-o-Y Growth (%) Projections by Country, 2022-2032
Figure 26: North America Chassis Dynamometers Market Value (US$ Mn) Analysis by Type, 2017-2032
Figure 27: North America Chassis Dynamometers Market Volume (Units) Analysis by Type, 2017-2032
Figure 28: North America Chassis Dynamometers Market Value Share (%) and BPS Analysis by Type, 2022-2032
Figure 29: North America Chassis Dynamometers Market Y-o-Y Growth (%) Projections by Type, 2022-2032
Figure 30: North America Chassis Dynamometers Market Value (US$ Mn) Analysis by End Use, 2017-2032
Figure 31: North America Chassis Dynamometers Market Volume (Units) Analysis by End Use, 2017-2032
Figure 32: North America Chassis Dynamometers Market Value Share (%) and BPS Analysis by End Use, 2022-2032
Figure 33: North America Chassis Dynamometers Market Y-o-Y Growth (%) Projections by End Use, 2022-2032
Figure 34: North America Chassis Dynamometers Market Attractiveness by Type, 2022-2032
Figure 35: North America Chassis Dynamometers Market Attractiveness by End Use, 2022-2032
Figure 36: North America Chassis Dynamometers Market Attractiveness by Country, 2022-2032
Figure 37: Latin America Chassis Dynamometers Market Value (US$ Mn) by Type, 2022-2032
Figure 38: Latin America Chassis Dynamometers Market Value (US$ Mn) by End Use, 2022-2032
Figure 39: Latin America Chassis Dynamometers Market Value (US$ Mn) by Country, 2022-2032
Figure 40: Latin America Chassis Dynamometers Market Value (US$ Mn) Analysis by Country, 2017-2032
Figure 41: Latin America Chassis Dynamometers Market Volume (Units) Analysis by Country, 2017-2032
Figure 42: Latin America Chassis Dynamometers Market Value Share (%) and BPS Analysis by Country, 2022-2032
Figure 43: Latin America Chassis Dynamometers Market Y-o-Y Growth (%) Projections by Country, 2022-2032
Figure 44: Latin America Chassis Dynamometers Market Value (US$ Mn) Analysis by Type, 2017-2032
Figure 45: Latin America Chassis Dynamometers Market Volume (Units) Analysis by Type, 2017-2032
Figure 46: Latin America Chassis Dynamometers Market Value Share (%) and BPS Analysis by Type, 2022-2032
Figure 47: Latin America Chassis Dynamometers Market Y-o-Y Growth (%) Projections by Type, 2022-2032
Figure 48: Latin America Chassis Dynamometers Market Value (US$ Mn) Analysis by End Use, 2017-2032
Figure 49: Latin America Chassis Dynamometers Market Volume (Units) Analysis by End Use, 2017-2032
Figure 50: Latin America Chassis Dynamometers Market Value Share (%) and BPS Analysis by End Use, 2022-2032
Figure 51: Latin America Chassis Dynamometers Market Y-o-Y Growth (%) Projections by End Use, 2022-2032
Figure 52: Latin America Chassis Dynamometers Market Attractiveness by Type, 2022-2032
Figure 53: Latin America Chassis Dynamometers Market Attractiveness by End Use, 2022-2032
Figure 54: Latin America Chassis Dynamometers Market Attractiveness by Country, 2022-2032
Figure 55: Europe Chassis Dynamometers Market Value (US$ Mn) by Type, 2022-2032
Figure 56: Europe Chassis Dynamometers Market Value (US$ Mn) by End Use, 2022-2032
Figure 57: Europe Chassis Dynamometers Market Value (US$ Mn) by Country, 2022-2032
Figure 58: Europe Chassis Dynamometers Market Value (US$ Mn) Analysis by Country, 2017-2032
Figure 59: Europe Chassis Dynamometers Market Volume (Units) Analysis by Country, 2017-2032
Figure 60: Europe Chassis Dynamometers Market Value Share (%) and BPS Analysis by Country, 2022-2032
Figure 61: Europe Chassis Dynamometers Market Y-o-Y Growth (%) Projections by Country, 2022-2032
Figure 62: Europe Chassis Dynamometers Market Value (US$ Mn) Analysis by Type, 2017-2032
Figure 63: Europe Chassis Dynamometers Market Volume (Units) Analysis by Type, 2017-2032
Figure 64: Europe Chassis Dynamometers Market Value Share (%) and BPS Analysis by Type, 2022-2032
Figure 65: Europe Chassis Dynamometers Market Y-o-Y Growth (%) Projections by Type, 2022-2032
Figure 66: Europe Chassis Dynamometers Market Value (US$ Mn) Analysis by End Use, 2017-2032
Figure 67: Europe Chassis Dynamometers Market Volume (Units) Analysis by End Use, 2017-2032
Figure 68: Europe Chassis Dynamometers Market Value Share (%) and BPS Analysis by End Use, 2022-2032
Figure 69: Europe Chassis Dynamometers Market Y-o-Y Growth (%) Projections by End Use, 2022-2032
Figure 70: Europe Chassis Dynamometers Market Attractiveness by Type, 2022-2032
Figure 71: Europe Chassis Dynamometers Market Attractiveness by End Use, 2022-2032
Figure 72: Europe Chassis Dynamometers Market Attractiveness by Country, 2022-2032
Figure 73: Asia Pacific Chassis Dynamometers Market Value (US$ Mn) by Type, 2022-2032
Figure 74: Asia Pacific Chassis Dynamometers Market Value (US$ Mn) by End Use, 2022-2032
Figure 75: Asia Pacific Chassis Dynamometers Market Value (US$ Mn) by Country, 2022-2032
Figure 76: Asia Pacific Chassis Dynamometers Market Value (US$ Mn) Analysis by Country, 2017-2032
Figure 77: Asia Pacific Chassis Dynamometers Market Volume (Units) Analysis by Country, 2017-2032
Figure 78: Asia Pacific Chassis Dynamometers Market Value Share (%) and BPS Analysis by Country, 2022-2032
Figure 79: Asia Pacific Chassis Dynamometers Market Y-o-Y Growth (%) Projections by Country, 2022-2032
Figure 80: Asia Pacific Chassis Dynamometers Market Value (US$ Mn) Analysis by Type, 2017-2032
Figure 81: Asia Pacific Chassis Dynamometers Market Volume (Units) Analysis by Type, 2017-2032
Figure 82: Asia Pacific Chassis Dynamometers Market Value Share (%) and BPS Analysis by Type, 2022-2032
Figure 83: Asia Pacific Chassis Dynamometers Market Y-o-Y Growth (%) Projections by Type, 2022-2032
Figure 84: Asia Pacific Chassis Dynamometers Market Value (US$ Mn) Analysis by End Use, 2017-2032
Figure 85: Asia Pacific Chassis Dynamometers Market Volume (Units) Analysis by End Use, 2017-2032
Figure 86: Asia Pacific Chassis Dynamometers Market Value Share (%) and BPS Analysis by End Use, 2022-2032
Figure 87: Asia Pacific Chassis Dynamometers Market Y-o-Y Growth (%) Projections by End Use, 2022-2032
Figure 88: Asia Pacific Chassis Dynamometers Market Attractiveness by Type, 2022-2032
Figure 89: Asia Pacific Chassis Dynamometers Market Attractiveness by End Use, 2022-2032
Figure 90: Asia Pacific Chassis Dynamometers Market Attractiveness by Country, 2022-2032
Figure 91: MEA Chassis Dynamometers Market Value (US$ Mn) by Type, 2022-2032
Figure 92: MEA Chassis Dynamometers Market Value (US$ Mn) by End Use, 2022-2032
Figure 93: MEA Chassis Dynamometers Market Value (US$ Mn) by Country, 2022-2032
Figure 94: MEA Chassis Dynamometers Market Value (US$ Mn) Analysis by Country, 2017-2032
Figure 95: MEA Chassis Dynamometers Market Volume (Units) Analysis by Country, 2017-2032
Figure 96: MEA Chassis Dynamometers Market Value Share (%) and BPS Analysis by Country, 2022-2032
Figure 97: MEA Chassis Dynamometers Market Y-o-Y Growth (%) Projections by Country, 2022-2032
Figure 98: MEA Chassis Dynamometers Market Value (US$ Mn) Analysis by Type, 2017-2032
Figure 99: MEA Chassis Dynamometers Market Volume (Units) Analysis by Type, 2017-2032
Figure 100: MEA Chassis Dynamometers Market Value Share (%) and BPS Analysis by Type, 2022-2032
Figure 101: MEA Chassis Dynamometers Market Y-o-Y Growth (%) Projections by Type, 2022-2032
Figure 102: MEA Chassis Dynamometers Market Value (US$ Mn) Analysis by End Use, 2017-2032
Figure 103: MEA Chassis Dynamometers Market Volume (Units) Analysis by End Use, 2017-2032
Figure 104: MEA Chassis Dynamometers Market Value Share (%) and BPS Analysis by End Use, 2022-2032
Figure 105: MEA Chassis Dynamometers Market Y-o-Y Growth (%) Projections by End Use, 2022-2032
Figure 106: MEA Chassis Dynamometers Market Attractiveness by Type, 2022-2032
Figure 107: MEA Chassis Dynamometers Market Attractiveness by End Use, 2022-2032
Figure 108: MEA Chassis Dynamometers Market Attractiveness by Country, 2022-2032
Need specific information?
Request CustomizationExplore Industrial Automation Insights
View Reports