Reports

- Global Locations -

Headquarters

Future Market Insights, Inc.

Christiana Corporate, 200
Continental Drive, Suite 401,
Newark, Delaware - 19713,
United States

T: +1-845-579-5705

Americas

Future Market Insights, Inc.

616 Corporate Way, Suite 2-9018,
Valley Cottage, NY 10989, United States

T: +1-347-918-3531

MEA

Future Market Insights

1602-6 Jumeirah Bay X2 Tower, Plot No: JLT-PH2-X2A,
Jumeirah Lakes Towers, Dubai,
United Arab Emirates

Europe

Future Market Insights

3rd Floor, 207 Regent Street,
W1B 3HH London
United Kingdom

T: + 44 (0) 20 8123 9659
D: +44 (0) 20 3287 4268

Asia Pacific

Future Market Insights

IndiaLand Global Tech Park, Unit UG-1, Behind Grand HighStreet, Phase 1, Hinjawadi, MH, Pune – 411057, India

Chloromethane Market Overview (2022 to 2032)

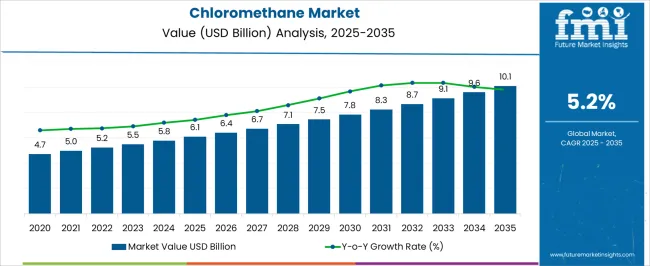
Global chloromethane demand is anticipated to be valued at US$ 5.3 Billion in 2022, forecast to grow at a CAGR of 5.2% to be valued at US$ 8.8 Billion from 2022 to 2032. Growth is attributed to increased demand for silicone elastomers, especially across the automotive and construction industries.

Report Attributes Details
Estimated Base Year Value (2021) US$ 5 Billion
Expected Market Value (2022) US$ 5.3 Billion
Anticipated Forecast Value (2032) US$ 8.8 Billion
Projected Growth Rate (2022 to 2032) 5.2% CAGR

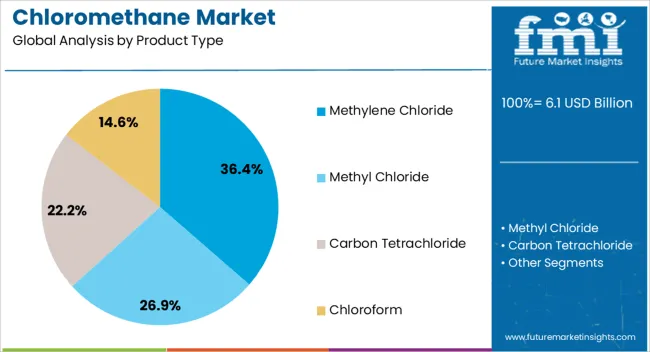
Traditionally, chloromethane was widely used as a refrigerant. However, owing to its high toxicity levels, the use of this chemical has been banned in consumer products. Presently, it is used as a chemical intermediate to manufacture derivative products such as chloroform, methylene chloride, and carbon tetrachloride.

Germany is considered to be a highly lucrative market for chloromethane and its derived products, driven primarily by its utilization across the pharmaceutical industry. Chloromethane is being specifically used as a local anesthetic, and as an intermediate in drug manufacturing.

As global warming and sustainability concerns rise, several domains, including the cold chain industry, are transitioning towards using hydrofluoric olefins, a more sustainable refrigeration alternative to CFCs, thereby widening chloromethane sales prospects.

Simultaneously, high toxicity claims concerning the use of chloromethane are acting as significant growth barriers. Individuals exposed to elevated chloromethane levels have reported effects such as staggering, blurred or double vision, fatigue, dizziness, and nausea among others. Hence, manufacturers are striving to develop more user-friendly alternatives. This is expected to restrain market growth to a significant extent.

Don't pay for what you don't need

Customize your report by selecting specific countries or regions and save 30%!

Which are Some Prominent Drivers Spearheading Chloromethane Market Growth?

Presently, chloromethane is used as a chemical intermediate to manufacture derivative products such as chloroform, methylene chloride, and carbon tetrachloride. In addition, it is used in the manufacture of silicone.

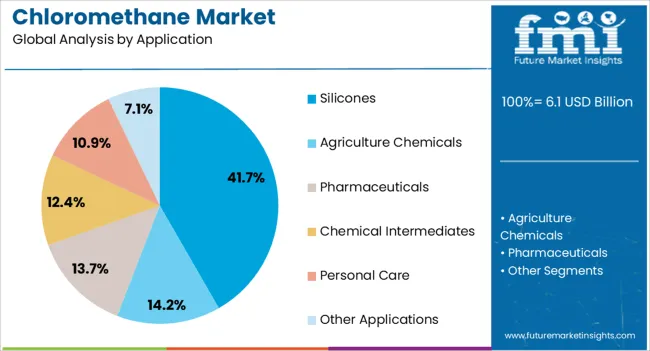
Growth of the electronics and automotive market is expected to be one of the primary factors driving the silicones market which in turn is expected to augment the demand for chloromethane over the next few years. In addition, rapid industrialization is expected to fuel the demand for derivatives of chloromethane such as chloroform, methylene chloride, and carbon tetrachloride.

Across the construction industry, silicones are deployed for structural glazing and weatherproofing. Moreover, they help contribute to maintaining the energy efficiency of buildings, reducing material waste, an extension of building a life, and maintaining in-shop productivity. Hence, the use of chloromethane to manufacture construction-grade silicone is forecast to increase in the upcoming decade.

The pharmaceutical industry is expected to accrue significant benefits to the global chloromethane market. A major application of chloromethane in this regard is the manufacturing of chloroform, a very popular anesthetic. In addition, chloromethane is deployed as an intermediate in the production of medicinal drugs. Moreover, methylene chloride, a prominent chloromethane product, is also used to extract numerous pharmaceutical compounds and synthesis of vitamins and antibiotics.

What are the Challenges Faced by the Chloromethane Industry?

Although chloromethane has numerous end uses, there are numerous obstacles likely to pose a challenge to market growth. According to a study published in the National Center for Biotechnology Information (NCBI), among all halogenated hydrocarbons, chloromethanes are highly volatile, meaning they can be transported to the stratosphere, leading to increased concentrations of chlorinated atoms, which depletes the ozone layer.

Given the increased emphasis on reducing carbon emissions and global warming, industries are gradually abandoning the use of chloromethanes and other chlorinated compounds in favor of more sustainable elements. Hence, this is anticipated to act as a significant growth barrier to the chloromethane market in forthcoming years.

Nikhil Kaitwade
Nikhil Kaitwade

Principal Consultant

Talk to Analyst

Find your sweet spots for generating winning opportunities in this market.

Why is Asia-Pacific Emerging as an Opportunistic Chloromethane Market?

Asia Pacific was the largest market for chloromethane and the trend is expected to continue into the forecast period owing to rapid industrialization in this region. Growing demand for electronics and automobiles is indirectly expected to augment the chloromethane market. The region is forecast to surge at over 5% CAGR from 2022 to 2032.

The abundant availability of feedstock and significant availability of shale gas reserves in China are amongst some of the most prominent growth drivers for the Asia Pacific region. Because of this, numerous chemical manufacturers are establishing bases across the region. Additionally, countries such as India are offering the required raw materials and skilled labor at comparatively inexpensive rates, motivating players to establish production units in these nations.

How is Europe Contributing to Growth of the Chloromethane Market?

According to Future Market Insights, Europe is expected to provide immense growth opportunities for chloromethane, with Germany expected to steer the bulk of all regional growth. Extensive applications in the pharmaceutical industry are keeping sales of chloromethane afloat across Germany.

Countries such as Poland, Belgium, the United Kingdom, and the Czech Republic are all also generating high demand for chloromethane, as these regions are witnessing an uptick in construction activity. Moreover, the chemical industry in these countries is also experiencing a major upsurge, which will generate favorable conditions for market growth.

Get the data you need at a Fraction of the cost

Personalize your report by choosing insights you need
and save 40%!

Market Competition

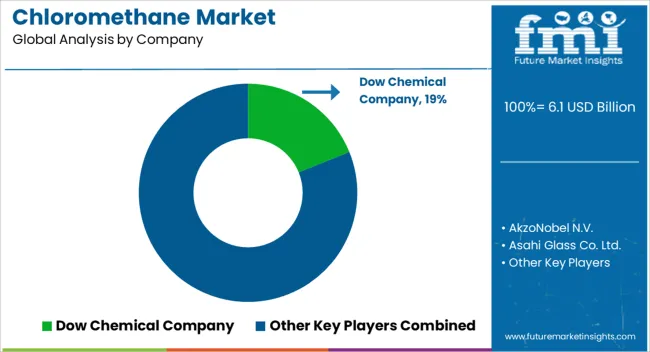
Some of the key participants present in the global chloromethane market include AkzoNobel N.V., Asahi Glass Co. Ltd., Dow Chemical Company, Gujarat Alkalies & Chemicals Ltd., Ineos, Solvay S.A., Shin-Etsu Chemical Co. Ltd., and Tokuyama Corporation among others.

Attributed to the presence of such a high number of participants, the market is highly competitive. While global players such as AkzoNobel and Dow Chemical Company account for a considerable market size, several regional-level players are also operating across key growth regions, particularly in the Asia Pacific.

Report Scope

Report Attributes Details
Growth Rate CAGR of 5.2% from 2022 to 2032
Base Year for Estimation 2021
Historical Data 2015 to 2020
Forecast Period 2022 to 2032
Quantitative Units Revenue in USD Billion, Volume in Kilotons, and CAGR from 2022 to 2032
Report Coverage Revenue Forecast, Volume Forecast, Company Ranking, Competitive Landscape, Growth Factors, Trends, and Pricing Analysis
Segments Covered
  • Product Type
  • Application
  • Region
Regions Covered
  • North America
  • Latin America
  • Western Europe
  • Eastern Europe
  • Asia Pacific Excluding Japan
  • Japan
  • Middle East and Africa
Key Countries Profiled
  • USA
  • Canada
  • Brazil
  • Argentina
  • Germany
  • United Kingdom
  • France
  • Spain
  • Italy
  • Nordics
  • BENELUX
  • Australia & New Zealand
  • China
  • India
  • ASIAN
  • GCC Countries
  • South Africa
Key Companies Profiled
  • AkzoNobel N.V.
  • Asahi Glass Co. Ltd.
  • Dow Chemical Company
  • Gujarat Alkalies & Chemicals Ltd.
  • Ineos
  • Solvay S.A.
  • Shin-Etsu Chemical Co. Ltd.
  • Tokuyama Corporation
Customization Available Upon Request

Key Segments Profiled in the Chloromethane Industry Survey

Product Type:

  • Methyl Chloride
  • Methylene Chloride
  • Carbon Tetrachloride
  • Chloroform

Application:

  • Silicones
  • Agriculture Chemicals
  • Pharmaceuticals
  • Chemical Intermediate
  • Personal Care
  • Other Applications

Region:

  • North America
  • Latin America
  • Western Europe
  • Eastern Europe
  • Asia Pacific Excluding Japan
  • Japan
  • Middle East & Africa

Frequently Asked Questions

What is the anticipated growth of the chloromethane market until 2032?

FMI projects the global chloromethane market to expand at a 5.2% value CAGR by 2032.

Which region is forecast to be the most lucrative for chloromethane market growth?

Asia Pacific is expected to be the most opportunistic chloromethane market, expanding at a 5% CAGR.

Which are some prominent chloromethane manufacturers?

AkzoNobel N.V., Asahi Glass Co. Ltd., Dow Chemical Company, and Solvay S.A. are some prominent chloromethane manufacturers.

Table of Content

1. Executive Summary | Chloromethane Market

    1.1. Global Market Outlook

    1.2. Demand-side Trends

    1.3. Supply-side Trends

    1.4. Technology Roadmap Analysis

    1.5. Analysis and Recommendations

2. Market Overview

    2.1. Market Coverage / Taxonomy

    2.2. Market Definition / Scope / Limitations

3. Market Background

    3.1. Market Dynamics

        3.1.1. Drivers

        3.1.2. Restraints

        3.1.3. Opportunity

        3.1.4. Trends

    3.2. Scenario Forecast

        3.2.1. Demand in Optimistic Scenario

        3.2.2. Demand in Likely Scenario

        3.2.3. Demand in Conservative Scenario

    3.3. Opportunity Map Analysis

    3.4. Product Life Cycle Analysis

    3.5. Supply Chain Analysis

        3.5.1. Supply Side Participants and Their Roles

            3.5.1.1. Producers

            3.5.1.2. Mid-Level Participants (Traders/ Agents/ Brokers)

            3.5.1.3. Wholesalers and Distributors

        3.5.2. Value Added and Value Created at Node in the Supply Chain

        3.5.3. List of Raw Material Suppliers

        3.5.4. List of Existing and Potential Buyers

    3.6. Investment Feasibility Matrix

    3.7. Value Chain Analysis

        3.7.1. Profit Margin Analysis

        3.7.2. Wholesalers and Distributors

        3.7.3. Retailers

    3.8. PESTLE and Porter’s Analysis

    3.9. Regulatory Landscape

        3.9.1. By Key Regions

        3.9.2. By Key Countries

    3.10. Regional Parent Market Outlook

    3.11. Production and Consumption Statistics

    3.12. Import and Export Statistics

4. Global Market Analysis 2017 to 2021 and Forecast, 2022 to 2032

    4.1. Historical Market Size Value (US$ Million) & Volume (Tons) Analysis, 2017 to 2021

    4.2. Current and Future Market Size Value (US$ Million) & Volume (Tons) Projections, 2022 to 2032

        4.2.1. Y-o-Y Growth Trend Analysis

        4.2.2. Absolute $ Opportunity Analysis

5. Global Market Analysis 2017 to 2021 and Forecast 2022 to 2032, By Product Type

    5.1. Introduction / Key Findings

    5.2. Historical Market Size Value (US$ Million) & Volume (Tons) Analysis By Product Type, 2017 to 2021

    5.3. Current and Future Market Size Value (US$ Million) & Volume (Tons) Analysis and Forecast By Product Type, 2022 to 2032

        5.3.1. Methyl Chloride

        5.3.2. Methylene Chloride

        5.3.3. Chloroform

        5.3.4. Carbon Tetrachloride

    5.4. Y-o-Y Growth Trend Analysis By Product Type, 2017 to 2021

    5.5. Absolute $ Opportunity Analysis By Product Type, 2022 to 2032 Deep-dive segmentation will be available in the sample on request

6. Global Market Analysis 2017 to 2021 and Forecast 2022 to 2032, By End Use

    6.1. Introduction / Key Findings

    6.2. Historical Market Size Value (US$ Million) & Volume (Tons) Analysis By End Use, 2017 to 2021

    6.3. Current and Future Market Size Value (US$ Million) & Volume (Tons) Analysis and Forecast By End Use, 2022 to 2032

        6.3.1. Silicones

        6.3.2. Agriculture Chemicals

        6.3.3. Pharmaceuticals

        6.3.4. Chemical Intermediate

        6.3.5. Personal Care

        6.3.6. Other Applications

    6.4. Y-o-Y Growth Trend Analysis By End Use, 2017 to 2021

    6.5. Absolute $ Opportunity Analysis By End Use, 2022 to 2032 Deep-dive segmentation will be available in the sample on request

7. Global Market Analysis 2017 to 2021 and Forecast 2022 to 2032, By Region

    7.1. Introduction

    7.2. Historical Market Size Value (US$ Million) & Volume (Tons) Analysis By Region, 2017 to 2021

    7.3. Current Market Size Value (US$ Million) & Volume (Tons) Analysis and Forecast By Region, 2022 to 2032

        7.3.1. North America

        7.3.2. Latin America

        7.3.3. Europe

        7.3.4. East Asia

        7.3.5. South Asia & Pacific

        7.3.6. Middle East and Africa

    7.4. Market Attractiveness Analysis By Region

8. North America Market Analysis 2017 to 2021 and Forecast 2022 to 2032, By Country

    8.1. Historical Market Size Value (US$ Million) & Volume (Tons) Trend Analysis By Market Taxonomy, 2017 to 2021

    8.2. Market Size Value (US$ Million) & Volume (Tons) Forecast By Market Taxonomy, 2022 to 2032

        8.2.1. By Country

            8.2.1.1. USA

            8.2.1.2. Canada

        8.2.2. By Product Type

        8.2.3. By End Use

    8.3. Market Attractiveness Analysis

        8.3.1. By Country

        8.3.2. By Product Type

        8.3.3. By End Use

    8.4. Key Takeaways

9. Latin America Market Analysis 2017 to 2021 and Forecast 2022 to 2032, By Country

    9.1. Historical Market Size Value (US$ Million) & Volume (Tons) Trend Analysis By Market Taxonomy, 2017 to 2021

    9.2. Market Size Value (US$ Million) & Volume (Tons) Forecast By Market Taxonomy, 2022 to 2032

        9.2.1. By Country

            9.2.1.1. Brazil

            9.2.1.2. Mexico

            9.2.1.3. Rest of Latin America

        9.2.2. By Product Type

        9.2.3. By End Use

    9.3. Market Attractiveness Analysis

        9.3.1. By Country

        9.3.2. By Product Type

        9.3.3. By End Use

    9.4. Key Takeaways

10. Europe Market Analysis 2017 to 2021 and Forecast 2022 to 2032, By Country

    10.1. Historical Market Size Value (US$ Million) & Volume (Tons) Trend Analysis By Market Taxonomy, 2017 to 2021

    10.2. Market Size Value (US$ Million) & Volume (Tons) Forecast By Market Taxonomy, 2022 to 2032

        10.2.1. By Country

            10.2.1.1. Germany

            10.2.1.2. United Kingdom

            10.2.1.3. France

            10.2.1.4. Spain

            10.2.1.5. Italy

            10.2.1.6. Rest of Europe

        10.2.2. By Product Type

        10.2.3. By End Use

    10.3. Market Attractiveness Analysis

        10.3.1. By Country

        10.3.2. By Product Type

        10.3.3. By End Use

    10.4. Key Takeaways

11. East Asia Market Analysis 2017 to 2021 and Forecast 2022 to 2032, By Country

    11.1. Historical Market Size Value (US$ Million) & Volume (Tons) Trend Analysis By Market Taxonomy, 2017 to 2021

    11.2. Market Size Value (US$ Million) & Volume (Tons) Forecast By Market Taxonomy, 2022 to 2032

        11.2.1. By Country

            11.2.1.1. China

            11.2.1.2. Japan

            11.2.1.3. South Korea

        11.2.2. By Product Type

        11.2.3. By End Use

    11.3. Market Attractiveness Analysis

        11.3.1. By Country

        11.3.2. By Product Type

        11.3.3. By End Use

    11.4. Key Takeaways

12. South Asia & Pacific Market Analysis 2017 to 2021 and Forecast 2022 to 2032, By Country

    12.1. Historical Market Size Value (US$ Million) & Volume (Tons) Trend Analysis By Market Taxonomy, 2017 to 2021

    12.2. Market Size Value (US$ Million) & Volume (Tons) Forecast By Market Taxonomy, 2022 to 2032

        12.2.1. By Country

            12.2.1.1. India

            12.2.1.2. Thailand

            12.2.1.3. Indonesia

            12.2.1.4. Malaysia

            12.2.1.5. Singapore

            12.2.1.6. Australia

            12.2.1.7. New Zealand

            12.2.1.8. Rest of South Asia & Pacific

        12.2.2. By Product Type

        12.2.3. By End Use

    12.3. Market Attractiveness Analysis

        12.3.1. By Country

        12.3.2. By Product Type

        12.3.3. By End Use

    12.4. Key Takeaways

13. Middle East and Africa Market Analysis 2017 to 2021 and Forecast 2022 to 2032, By Country

    13.1. Historical Market Size Value (US$ Million) & Volume (Tons) Trend Analysis By Market Taxonomy, 2017 to 2021

    13.2. Market Size Value (US$ Million) & Volume (Tons) Forecast By Market Taxonomy, 2022 to 2032

        13.2.1. By Country

            13.2.1.1. GCC Countries

            13.2.1.2. South Africa

            13.2.1.3. Israel

            13.2.1.4. Rest of Middle East and Africa

        13.2.2. By Product Type

        13.2.3. By End Use

    13.3. Market Attractiveness Analysis

        13.3.1. By Country

        13.3.2. By Product Type

        13.3.3. By End Use

    13.4. Key Takeaways

14. Key Countries Market Analysis

    14.1. USA

        14.1.1. Pricing Analysis

        14.1.2. Market Share Analysis, 2021

            14.1.2.1. By Product Type

            14.1.2.2. By End Use

    14.2. Canada

        14.2.1. Pricing Analysis

        14.2.2. Market Share Analysis, 2021

            14.2.2.1. By Product Type

            14.2.2.2. By End Use

    14.3. Brazil

        14.3.1. Pricing Analysis

        14.3.2. Market Share Analysis, 2021

            14.3.2.1. By Product Type

            14.3.2.2. By End Use

    14.4. Mexico

        14.4.1. Pricing Analysis

        14.4.2. Market Share Analysis, 2021

            14.4.2.1. By Product Type

            14.4.2.2. By End Use

    14.5. Germany

        14.5.1. Pricing Analysis

        14.5.2. Market Share Analysis, 2021

            14.5.2.1. By Product Type

            14.5.2.2. By End Use

    14.6. United Kingdom

        14.6.1. Pricing Analysis

        14.6.2. Market Share Analysis, 2021

            14.6.2.1. By Product Type

            14.6.2.2. By End Use

    14.7. France

        14.7.1. Pricing Analysis

        14.7.2. Market Share Analysis, 2021

            14.7.2.1. By Product Type

            14.7.2.2. By End Use

    14.8. Spain

        14.8.1. Pricing Analysis

        14.8.2. Market Share Analysis, 2021

            14.8.2.1. By Product Type

            14.8.2.2. By End Use

    14.9. Italy

        14.9.1. Pricing Analysis

        14.9.2. Market Share Analysis, 2021

            14.9.2.1. By Product Type

            14.9.2.2. By End Use

    14.10. China

        14.10.1. Pricing Analysis

        14.10.2. Market Share Analysis, 2021

            14.10.2.1. By Product Type

            14.10.2.2. By End Use

    14.11. Japan

        14.11.1. Pricing Analysis

        14.11.2. Market Share Analysis, 2021

            14.11.2.1. By Product Type

            14.11.2.2. By End Use

    14.12. South Korea

        14.12.1. Pricing Analysis

        14.12.2. Market Share Analysis, 2021

            14.12.2.1. By Product Type

            14.12.2.2. By End Use

    14.13. India

        14.13.1. Pricing Analysis

        14.13.2. Market Share Analysis, 2021

            14.13.2.1. By Product Type

            14.13.2.2. By End Use

    14.14. Thailand

        14.14.1. Pricing Analysis

        14.14.2. Market Share Analysis, 2021

            14.14.2.1. By Product Type

            14.14.2.2. By End Use

    14.15. Indonesia

        14.15.1. Pricing Analysis

        14.15.2. Market Share Analysis, 2021

            14.15.2.1. By Product Type

            14.15.2.2. By End Use

    14.16. Malaysia

        14.16.1. Pricing Analysis

        14.16.2. Market Share Analysis, 2021

            14.16.2.1. By Product Type

            14.16.2.2. By End Use

    14.17. Singapore

        14.17.1. Pricing Analysis

        14.17.2. Market Share Analysis, 2021

            14.17.2.1. By Product Type

            14.17.2.2. By End Use

    14.18. Australia

        14.18.1. Pricing Analysis

        14.18.2. Market Share Analysis, 2021

            14.18.2.1. By Product Type

            14.18.2.2. By End Use

    14.19. New Zealand

        14.19.1. Pricing Analysis

        14.19.2. Market Share Analysis, 2021

            14.19.2.1. By Product Type

            14.19.2.2. By End Use

    14.20. GCC Countries

        14.20.1. Pricing Analysis

        14.20.2. Market Share Analysis, 2021

            14.20.2.1. By Product Type

            14.20.2.2. By End Use

    14.21. South Africa

        14.21.1. Pricing Analysis

        14.21.2. Market Share Analysis, 2021

            14.21.2.1. By Product Type

            14.21.2.2. By End Use

    14.22. Israel

        14.22.1. Pricing Analysis

        14.22.2. Market Share Analysis, 2021

            14.22.2.1. By Product Type

            14.22.2.2. By End Use

15. Market Structure Analysis

    15.1. Competition Dashboard

    15.2. Competition Benchmarking

    15.3. Market Share Analysis of Top Players

        15.3.1. By Regional

        15.3.2. By Product Type

        15.3.3. By End Use

16. Competition Analysis

    16.1. Competition Deep Dive

        16.1.1. Akzo Nobel N.V.

            16.1.1.1. Overview

            16.1.1.2. Product Portfolio

            16.1.1.3. Profitability by Market Segments

            16.1.1.4. Sales Footprint

            16.1.1.5. Strategy Overview

                16.1.1.5.1. Marketing Strategy

                16.1.1.5.2. Product Strategy

                16.1.1.5.3. Channel Strategy

        16.1.2. DowDuPont Inc.

            16.1.2.1. Overview

            16.1.2.2. Product Portfolio

            16.1.2.3. Profitability by Market Segments

            16.1.2.4. Sales Footprint

            16.1.2.5. Strategy Overview

                16.1.2.5.1. Marketing Strategy

                16.1.2.5.2. Product Strategy

                16.1.2.5.3. Channel Strategy

        16.1.3. Kem One

            16.1.3.1. Overview

            16.1.3.2. Product Portfolio

            16.1.3.3. Profitability by Market Segments

            16.1.3.4. Sales Footprint

            16.1.3.5. Strategy Overview

                16.1.3.5.1. Marketing Strategy

                16.1.3.5.2. Product Strategy

                16.1.3.5.3. Channel Strategy

        16.1.4. Occidental Petroleum Corporation

            16.1.4.1. Overview

            16.1.4.2. Product Portfolio

            16.1.4.3. Profitability by Market Segments

            16.1.4.4. Sales Footprint

            16.1.4.5. Strategy Overview

                16.1.4.5.1. Marketing Strategy

                16.1.4.5.2. Product Strategy

                16.1.4.5.3. Channel Strategy

        16.1.5. Shin-Etsu Chemical Co., Ltd.

            16.1.5.1. Overview

            16.1.5.2. Product Portfolio

            16.1.5.3. Profitability by Market Segments

            16.1.5.4. Sales Footprint

            16.1.5.5. Strategy Overview

                16.1.5.5.1. Marketing Strategy

                16.1.5.5.2. Product Strategy

                16.1.5.5.3. Channel Strategy

        16.1.6. Tokuyama Corporation

            16.1.6.1. Overview

            16.1.6.2. Product Portfolio

            16.1.6.3. Profitability by Market Segments

            16.1.6.4. Sales Footprint

            16.1.6.5. Strategy Overview

                16.1.6.5.1. Marketing Strategy

                16.1.6.5.2. Product Strategy

                16.1.6.5.3. Channel Strategy

        16.1.7. AGC Chemicals

            16.1.7.1. Overview

            16.1.7.2. Product Portfolio

            16.1.7.3. Profitability by Market Segments

            16.1.7.4. Sales Footprint

            16.1.7.5. Strategy Overview

                16.1.7.5.1. Marketing Strategy

                16.1.7.5.2. Product Strategy

                16.1.7.5.3. Channel Strategy

        16.1.8. Gujarat Alkalies and Chemicals Ltd.

            16.1.8.1. Overview

            16.1.8.2. Product Portfolio

            16.1.8.3. Profitability by Market Segments

            16.1.8.4. Sales Footprint

            16.1.8.5. Strategy Overview

                16.1.8.5.1. Marketing Strategy

                16.1.8.5.2. Product Strategy

                16.1.8.5.3. Channel Strategy

        16.1.9. Luzhou SANHE fluorine chemical industry co., Ltd.

            16.1.9.1. Overview

            16.1.9.2. Product Portfolio

            16.1.9.3. Profitability by Market Segments

            16.1.9.4. Sales Footprint

            16.1.9.5. Strategy Overview

                16.1.9.5.1. Marketing Strategy

                16.1.9.5.2. Product Strategy

                16.1.9.5.3. Channel Strategy

        16.1.10. Juhua Group Corporation

            16.1.10.1. Overview

            16.1.10.2. Product Portfolio

            16.1.10.3. Profitability by Market Segments

            16.1.10.4. Sales Footprint

            16.1.10.5. Strategy Overview

                16.1.10.5.1. Marketing Strategy

                16.1.10.5.2. Product Strategy

                16.1.10.5.3. Channel Strategy

        16.1.11. Solvay S.A.

            16.1.11.1. Overview

            16.1.11.2. Product Portfolio

            16.1.11.3. Profitability by Market Segments

            16.1.11.4. Sales Footprint

            16.1.11.5. Strategy Overview

                16.1.11.5.1. Marketing Strategy

                16.1.11.5.2. Product Strategy

                16.1.11.5.3. Channel Strategy

        16.1.12. INEOS

            16.1.12.1. Overview

            16.1.12.2. Product Portfolio

            16.1.12.3. Profitability by Market Segments

            16.1.12.4. Sales Footprint

            16.1.12.5. Strategy Overview

                16.1.12.5.1. Marketing Strategy

                16.1.12.5.2. Product Strategy

                16.1.12.5.3. Channel Strategy

17. Assumptions & Acronyms Used

18. Research Methodology

Don't pay for what you don't need

Customize your report by selecting specific countries or regions and save 30%!

List of Tables

Table 1: Global Market Value (US$ Million) Forecast by Region, 2017 to 2032

Table 2: Global Market Volume (Tons) Forecast by Region, 2017 to 2032

Table 3: Global Market Value (US$ Million) Forecast by Product Type, 2017 to 2032

Table 4: Global Market Volume (Tons) Forecast by Product Type, 2017 to 2032

Table 5: Global Market Value (US$ Million) Forecast by End Use, 2017 to 2032

Table 6: Global Market Volume (Tons) Forecast by End Use, 2017 to 2032

Table 7: North America Market Value (US$ Million) Forecast by Country, 2017 to 2032

Table 8: North America Market Volume (Tons) Forecast by Country, 2017 to 2032

Table 9: North America Market Value (US$ Million) Forecast by Product Type, 2017 to 2032

Table 10: North America Market Volume (Tons) Forecast by Product Type, 2017 to 2032

Table 11: North America Market Value (US$ Million) Forecast by End Use, 2017 to 2032

Table 12: North America Market Volume (Tons) Forecast by End Use, 2017 to 2032

Table 13: Latin America Market Value (US$ Million) Forecast by Country, 2017 to 2032

Table 14: Latin America Market Volume (Tons) Forecast by Country, 2017 to 2032

Table 15: Latin America Market Value (US$ Million) Forecast by Product Type, 2017 to 2032

Table 16: Latin America Market Volume (Tons) Forecast by Product Type, 2017 to 2032

Table 17: Latin America Market Value (US$ Million) Forecast by End Use, 2017 to 2032

Table 18: Latin America Market Volume (Tons) Forecast by End Use, 2017 to 2032

Table 19: Europe Market Value (US$ Million) Forecast by Country, 2017 to 2032

Table 20: Europe Market Volume (Tons) Forecast by Country, 2017 to 2032

Table 21: Europe Market Value (US$ Million) Forecast by Product Type, 2017 to 2032

Table 22: Europe Market Volume (Tons) Forecast by Product Type, 2017 to 2032

Table 23: Europe Market Value (US$ Million) Forecast by End Use, 2017 to 2032

Table 24: Europe Market Volume (Tons) Forecast by End Use, 2017 to 2032

Table 25: East Asia Market Value (US$ Million) Forecast by Country, 2017 to 2032

Table 26: East Asia Market Volume (Tons) Forecast by Country, 2017 to 2032

Table 27: East Asia Market Value (US$ Million) Forecast by Product Type, 2017 to 2032

Table 28: East Asia Market Volume (Tons) Forecast by Product Type, 2017 to 2032

Table 29: East Asia Market Value (US$ Million) Forecast by End Use, 2017 to 2032

Table 30: East Asia Market Volume (Tons) Forecast by End Use, 2017 to 2032

Table 31: South Asia & Pacific Market Value (US$ Million) Forecast by Country, 2017 to 2032

Table 32: South Asia & Pacific Market Volume (Tons) Forecast by Country, 2017 to 2032

Table 33: South Asia & Pacific Market Value (US$ Million) Forecast by Product Type, 2017 to 2032

Table 34: South Asia & Pacific Market Volume (Tons) Forecast by Product Type, 2017 to 2032

Table 35: South Asia & Pacific Market Value (US$ Million) Forecast by End Use, 2017 to 2032

Table 36: South Asia & Pacific Market Volume (Tons) Forecast by End Use, 2017 to 2032

Table 37: MEA Market Value (US$ Million) Forecast by Country, 2017 to 2032

Table 38: MEA Market Volume (Tons) Forecast by Country, 2017 to 2032

Table 39: MEA Market Value (US$ Million) Forecast by Product Type, 2017 to 2032

Table 40: MEA Market Volume (Tons) Forecast by Product Type, 2017 to 2032

Table 41: MEA Market Value (US$ Million) Forecast by End Use, 2017 to 2032

Table 42: MEA Market Volume (Tons) Forecast by End Use, 2017 to 2032
Nikhil Kaitwade
Nikhil Kaitwade

Principal Consultant

Talk to Analyst

Find your sweet spots for generating winning opportunities in this market.

List of Charts

Figure 1: Global Market Value (US$ Million) by Product Type, 2022 to 2032

Figure 2: Global Market Value (US$ Million) by End Use, 2022 to 2032

Figure 3: Global Market Value (US$ Million) by Region, 2022 to 2032

Figure 4: Global Market Value (US$ Million) Analysis by Region, 2017 to 2032

Figure 5: Global Market Volume (Tons) Analysis by Region, 2017 to 2032

Figure 6: Global Market Value Share (%) and BPS Analysis by Region, 2022 to 2032

Figure 7: Global Market Y-o-Y Growth (%) Projections by Region, 2022 to 2032

Figure 8: Global Market Value (US$ Million) Analysis by Product Type, 2017 to 2032

Figure 9: Global Market Volume (Tons) Analysis by Product Type, 2017 to 2032

Figure 10: Global Market Value Share (%) and BPS Analysis by Product Type, 2022 to 2032

Figure 11: Global Market Y-o-Y Growth (%) Projections by Product Type, 2022 to 2032

Figure 12: Global Market Value (US$ Million) Analysis by End Use, 2017 to 2032

Figure 13: Global Market Volume (Tons) Analysis by End Use, 2017 to 2032

Figure 14: Global Market Value Share (%) and BPS Analysis by End Use, 2022 to 2032

Figure 15: Global Market Y-o-Y Growth (%) Projections by End Use, 2022 to 2032

Figure 16: Global Market Attractiveness by Product Type, 2022 to 2032

Figure 17: Global Market Attractiveness by End Use, 2022 to 2032

Figure 18: Global Market Attractiveness by Region, 2022 to 2032

Figure 19: North America Market Value (US$ Million) by Product Type, 2022 to 2032

Figure 20: North America Market Value (US$ Million) by End Use, 2022 to 2032

Figure 21: North America Market Value (US$ Million) by Country, 2022 to 2032

Figure 22: North America Market Value (US$ Million) Analysis by Country, 2017 to 2032

Figure 23: North America Market Volume (Tons) Analysis by Country, 2017 to 2032

Figure 24: North America Market Value Share (%) and BPS Analysis by Country, 2022 to 2032

Figure 25: North America Market Y-o-Y Growth (%) Projections by Country, 2022 to 2032

Figure 26: North America Market Value (US$ Million) Analysis by Product Type, 2017 to 2032

Figure 27: North America Market Volume (Tons) Analysis by Product Type, 2017 to 2032

Figure 28: North America Market Value Share (%) and BPS Analysis by Product Type, 2022 to 2032

Figure 29: North America Market Y-o-Y Growth (%) Projections by Product Type, 2022 to 2032

Figure 30: North America Market Value (US$ Million) Analysis by End Use, 2017 to 2032

Figure 31: North America Market Volume (Tons) Analysis by End Use, 2017 to 2032

Figure 32: North America Market Value Share (%) and BPS Analysis by End Use, 2022 to 2032

Figure 33: North America Market Y-o-Y Growth (%) Projections by End Use, 2022 to 2032

Figure 34: North America Market Attractiveness by Product Type, 2022 to 2032

Figure 35: North America Market Attractiveness by End Use, 2022 to 2032

Figure 36: North America Market Attractiveness by Country, 2022 to 2032

Figure 37: Latin America Market Value (US$ Million) by Product Type, 2022 to 2032

Figure 38: Latin America Market Value (US$ Million) by End Use, 2022 to 2032

Figure 39: Latin America Market Value (US$ Million) by Country, 2022 to 2032

Figure 40: Latin America Market Value (US$ Million) Analysis by Country, 2017 to 2032

Figure 41: Latin America Market Volume (Tons) Analysis by Country, 2017 to 2032

Figure 42: Latin America Market Value Share (%) and BPS Analysis by Country, 2022 to 2032

Figure 43: Latin America Market Y-o-Y Growth (%) Projections by Country, 2022 to 2032

Figure 44: Latin America Market Value (US$ Million) Analysis by Product Type, 2017 to 2032

Figure 45: Latin America Market Volume (Tons) Analysis by Product Type, 2017 to 2032

Figure 46: Latin America Market Value Share (%) and BPS Analysis by Product Type, 2022 to 2032

Figure 47: Latin America Market Y-o-Y Growth (%) Projections by Product Type, 2022 to 2032

Figure 48: Latin America Market Value (US$ Million) Analysis by End Use, 2017 to 2032

Figure 49: Latin America Market Volume (Tons) Analysis by End Use, 2017 to 2032

Figure 50: Latin America Market Value Share (%) and BPS Analysis by End Use, 2022 to 2032

Figure 51: Latin America Market Y-o-Y Growth (%) Projections by End Use, 2022 to 2032

Figure 52: Latin America Market Attractiveness by Product Type, 2022 to 2032

Figure 53: Latin America Market Attractiveness by End Use, 2022 to 2032

Figure 54: Latin America Market Attractiveness by Country, 2022 to 2032

Figure 55: Europe Market Value (US$ Million) by Product Type, 2022 to 2032

Figure 56: Europe Market Value (US$ Million) by End Use, 2022 to 2032

Figure 57: Europe Market Value (US$ Million) by Country, 2022 to 2032

Figure 58: Europe Market Value (US$ Million) Analysis by Country, 2017 to 2032

Figure 59: Europe Market Volume (Tons) Analysis by Country, 2017 to 2032

Figure 60: Europe Market Value Share (%) and BPS Analysis by Country, 2022 to 2032

Figure 61: Europe Market Y-o-Y Growth (%) Projections by Country, 2022 to 2032

Figure 62: Europe Market Value (US$ Million) Analysis by Product Type, 2017 to 2032

Figure 63: Europe Market Volume (Tons) Analysis by Product Type, 2017 to 2032

Figure 64: Europe Market Value Share (%) and BPS Analysis by Product Type, 2022 to 2032

Figure 65: Europe Market Y-o-Y Growth (%) Projections by Product Type, 2022 to 2032

Figure 66: Europe Market Value (US$ Million) Analysis by End Use, 2017 to 2032

Figure 67: Europe Market Volume (Tons) Analysis by End Use, 2017 to 2032

Figure 68: Europe Market Value Share (%) and BPS Analysis by End Use, 2022 to 2032

Figure 69: Europe Market Y-o-Y Growth (%) Projections by End Use, 2022 to 2032

Figure 70: Europe Market Attractiveness by Product Type, 2022 to 2032

Figure 71: Europe Market Attractiveness by End Use, 2022 to 2032

Figure 72: Europe Market Attractiveness by Country, 2022 to 2032

Figure 73: East Asia Market Value (US$ Million) by Product Type, 2022 to 2032

Figure 74: East Asia Market Value (US$ Million) by End Use, 2022 to 2032

Figure 75: East Asia Market Value (US$ Million) by Country, 2022 to 2032

Figure 76: East Asia Market Value (US$ Million) Analysis by Country, 2017 to 2032

Figure 77: East Asia Market Volume (Tons) Analysis by Country, 2017 to 2032

Figure 78: East Asia Market Value Share (%) and BPS Analysis by Country, 2022 to 2032

Figure 79: East Asia Market Y-o-Y Growth (%) Projections by Country, 2022 to 2032

Figure 80: East Asia Market Value (US$ Million) Analysis by Product Type, 2017 to 2032

Figure 81: East Asia Market Volume (Tons) Analysis by Product Type, 2017 to 2032

Figure 82: East Asia Market Value Share (%) and BPS Analysis by Product Type, 2022 to 2032

Figure 83: East Asia Market Y-o-Y Growth (%) Projections by Product Type, 2022 to 2032

Figure 84: East Asia Market Value (US$ Million) Analysis by End Use, 2017 to 2032

Figure 85: East Asia Market Volume (Tons) Analysis by End Use, 2017 to 2032

Figure 86: East Asia Market Value Share (%) and BPS Analysis by End Use, 2022 to 2032

Figure 87: East Asia Market Y-o-Y Growth (%) Projections by End Use, 2022 to 2032

Figure 88: East Asia Market Attractiveness by Product Type, 2022 to 2032

Figure 89: East Asia Market Attractiveness by End Use, 2022 to 2032

Figure 90: East Asia Market Attractiveness by Country, 2022 to 2032

Figure 91: South Asia & Pacific Market Value (US$ Million) by Product Type, 2022 to 2032

Figure 92: South Asia & Pacific Market Value (US$ Million) by End Use, 2022 to 2032

Figure 93: South Asia & Pacific Market Value (US$ Million) by Country, 2022 to 2032

Figure 94: South Asia & Pacific Market Value (US$ Million) Analysis by Country, 2017 to 2032

Figure 95: South Asia & Pacific Market Volume (Tons) Analysis by Country, 2017 to 2032

Figure 96: South Asia & Pacific Market Value Share (%) and BPS Analysis by Country, 2022 to 2032

Figure 97: South Asia & Pacific Market Y-o-Y Growth (%) Projections by Country, 2022 to 2032

Figure 98: South Asia & Pacific Market Value (US$ Million) Analysis by Product Type, 2017 to 2032

Figure 99: South Asia & Pacific Market Volume (Tons) Analysis by Product Type, 2017 to 2032

Figure 100: South Asia & Pacific Market Value Share (%) and BPS Analysis by Product Type, 2022 to 2032

Figure 101: South Asia & Pacific Market Y-o-Y Growth (%) Projections by Product Type, 2022 to 2032

Figure 102: South Asia & Pacific Market Value (US$ Million) Analysis by End Use, 2017 to 2032

Figure 103: South Asia & Pacific Market Volume (Tons) Analysis by End Use, 2017 to 2032

Figure 104: South Asia & Pacific Market Value Share (%) and BPS Analysis by End Use, 2022 to 2032

Figure 105: South Asia & Pacific Market Y-o-Y Growth (%) Projections by End Use, 2022 to 2032

Figure 106: South Asia & Pacific Market Attractiveness by Product Type, 2022 to 2032

Figure 107: South Asia & Pacific Market Attractiveness by End Use, 2022 to 2032

Figure 108: South Asia & Pacific Market Attractiveness by Country, 2022 to 2032

Figure 109: MEA Market Value (US$ Million) by Product Type, 2022 to 2032

Figure 110: MEA Market Value (US$ Million) by End Use, 2022 to 2032

Figure 111: MEA Market Value (US$ Million) by Country, 2022 to 2032

Figure 112: MEA Market Value (US$ Million) Analysis by Country, 2017 to 2032

Figure 113: MEA Market Volume (Tons) Analysis by Country, 2017 to 2032

Figure 114: MEA Market Value Share (%) and BPS Analysis by Country, 2022 to 2032

Figure 115: MEA Market Y-o-Y Growth (%) Projections by Country, 2022 to 2032

Figure 116: MEA Market Value (US$ Million) Analysis by Product Type, 2017 to 2032

Figure 117: MEA Market Volume (Tons) Analysis by Product Type, 2017 to 2032

Figure 118: MEA Market Value Share (%) and BPS Analysis by Product Type, 2022 to 2032

Figure 119: MEA Market Y-o-Y Growth (%) Projections by Product Type, 2022 to 2032

Figure 120: MEA Market Value (US$ Million) Analysis by End Use, 2017 to 2032

Figure 121: MEA Market Volume (Tons) Analysis by End Use, 2017 to 2032

Figure 122: MEA Market Value Share (%) and BPS Analysis by End Use, 2022 to 2032

Figure 123: MEA Market Y-o-Y Growth (%) Projections by End Use, 2022 to 2032

Figure 124: MEA Market Attractiveness by Product Type, 2022 to 2032

Figure 125: MEA Market Attractiveness by End Use, 2022 to 2032

Figure 126: MEA Market Attractiveness by Country, 2022 to 2032

Explore Chemicals & Materials Insights

View Reports