Cocoglycerides Market Size and Share Forecast Outlook 2025 to 2035

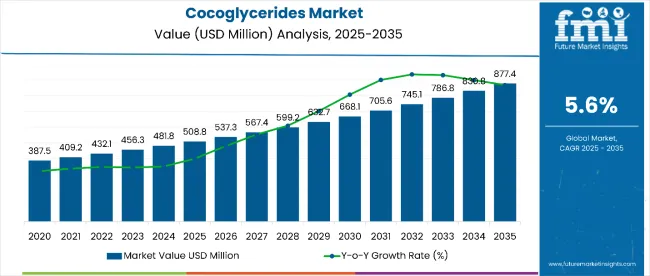
The cocoglycerides market is estimated to be valued at USD 508.8 million in 2025 and is projected to reach USD 877.4 million by 2035, registering a CAGR of 5.6% over the forecast period. The market is projected to add an absolute dollar opportunity of USD 368.6 million over the forecast period.
Quick Stats for Cocoglycerides Market

  • Cocoglycerides Market Value (2025): USD 508.8 million
  • Cocoglycerides Market Forecast Value (2035): USD 877.4 million
  • Cocoglycerides Market Forecast CAGR: 5.6%
  • Leading Application Segment in Cocoglycerides Market in 2025: Skincare Products (52%)
  • Key Growth Regions in Cocoglycerides Market: Asia-Pacific, Europe, and Latin America
  • Top Key Players in Cocoglycerides Market: Cargill, Archer Daniels Midland Company, BASF SE, KLK OLEO, Stepan Company, Lonza Group Ltd.

Cocoglycerides Market

Metric Value
Cocoglycerides Market Estimated Value in (2025E) USD 508.8 million
Cocoglycerides Market Forecast Value in (2035F) USD 877.4 million
Forecast CAGR (2025 to 2035) 5.6%

This reflects a 1.68 times growth at a compound annual growth rate of 5.6%. The market's evolution is expected to be shaped by rising demand for natural emollients and emulsifiers in cosmetic formulations, increasing consumer preference for coconut-derived ingredients, and expanding applications across skincare, haircare, and personal care product categories.

By 2030, the market is likely to reach approximately USD 688.8 million, accounting for USD 180 million in incremental value over the first half of the decade. The remaining USD 188.6 million is expected during the second half, suggesting a moderately back-loaded growth pattern. Product innovation focusing on multifunctional cocoglycerides is gaining traction due to their superior emollient properties, stability enhancement capabilities, and compatibility with clean-label formulations.

Companies such as Cargill and BASF SE are advancing their competitive positions through investment in sustainable sourcing technologies and advanced processing capabilities. Innovation-led product development is supporting expansion into premium cosmetic applications, natural personal care formulations, and specialty pharmaceutical applications. Market performance will remain anchored in ingredient quality standards, regulatory compliance frameworks, and sustainable sourcing initiatives.

The market holds approximately 38% of the coconut-derived cosmetic ingredients market, driven by their excellent emollient properties and natural origin appeal among beauty-conscious consumers. It accounts for around 15% of the natural emulsifiers market, supported by increasing demand for plant-based cosmetic formulations and clean-label personal care products.

The market contributes nearly 28% to the specialty cosmetic emollients market, particularly for premium skincare applications requiring superior moisturizing and texture-enhancing properties. It holds close to 22% of the multifunctional cosmetic ingredients market, where cocoglycerides serve dual roles as emollients and stabilizers. The share in the natural personal care ingredients market reaches about 12%, reflecting growing consumer preference for coconut-derived and sustainable beauty ingredients.

The market is undergoing structural change driven by rising demand for natural and sustainable cosmetic ingredients and clean-label beauty formulations. Advanced processing methods using controlled fractionation and purification techniques have enhanced product purity, functional performance, and application versatility, making cocoglycerides a preferred alternative to synthetic emollients and petroleum-derived ingredients.

Manufacturers are introducing specialized grades with enhanced stability, improved sensory characteristics, and multifunctional properties tailored for premium cosmetic and pharmaceutical applications.

Why is the Cocoglycerides Market Growing?

Cocoglycerides’ natural origin from coconut oil, excellent emollient properties, and multifunctional capabilities as both moisturizer and emulsifier make them highly attractive ingredients for modern cosmetic and personal care formulations seeking natural alternatives to synthetic compounds.

Growing consumer awareness of ingredient safety and sustainability is further propelling adoption, especially among millennials and Gen Z consumers who prioritize clean-label beauty products and environmentally conscious brands. Scientific validation of cocoglycerides’ skin-conditioning benefits, along with improved processing technologies for enhanced purity and performance, is also driving market expansion.

As the global beauty industry shifts toward natural and organic formulations and regulatory frameworks increasingly favor bio-based ingredients, the market outlook remains favorable. With continued innovation in application technologies, expanding usage in premium skincare formulations, and growing adoption in emerging markets, cocoglycerides are well-positioned to capture increasing share across cosmetic, personal care, and specialty pharmaceutical applications.

Cocoglycerides Market Analysis by Top Investment Segments

The market is segmented by application, distribution channel, and region. By application, the market is divided into baby care products, lotions, powder, cream, oils, bath products, eye lotion, eye makeup, eye liner, fragrance products, personal hygiene, and skincare products. In terms of distribution channel, the market is bifurcated into online and offline. Regionally, the market is characterized into North America, Latin America, Asia Pacific, Eastern Europe, Western Europe, and Japan.
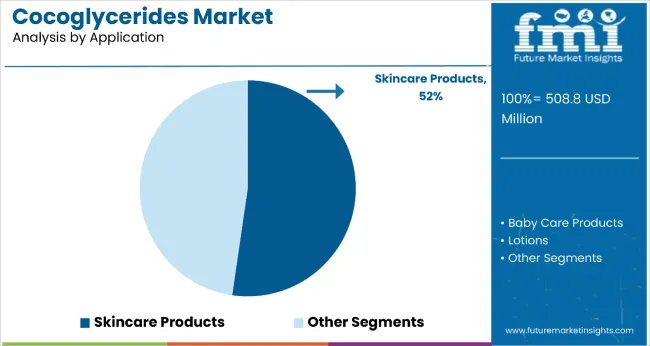
By Application, Skincare Products Segment Accounts for 52% of the Market Share

Cocoglycerides Market Analysis By Application

The skincare products segment holds a leading 52% market share in the application category, driven by the superior emollient and moisturizing properties of cocoglycerides that align well with modern skincare formulations. These coconut-derived ingredients are widely used in face creams, body lotions, serums, and specialty treatments due to their multifunctionality and gentle yet effective conditioning effects.

Their compatibility with both oil-in-water and water-in-oil systems adds formulation flexibility, making them highly versatile across premium skincare ranges. As clean beauty trends gain momentum, consumers are prioritizing natural ingredients with proven efficacy and safe skin benefits.

Manufacturers are responding with advanced cocoglycerides grades that offer enhanced penetration, stability, and synergy with actives, catering to growing demand for high-performance, natural skincare. The segment’s continued dominance is underpinned by rising consumer interest in sustainable, ingredient-transparent beauty products.
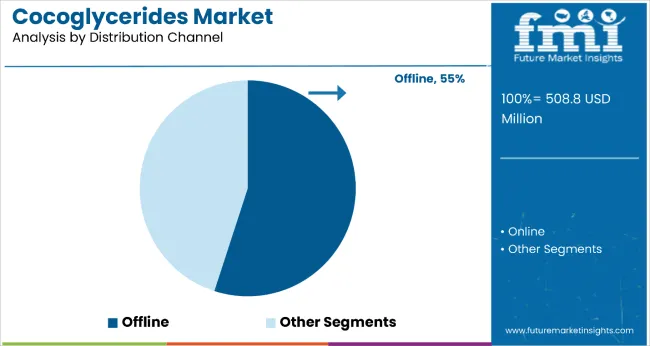
By Distribution Channel, Offline Segment Accounts for 55.0% of the Market Share

Cocoglycerides Market Analysis By Distribution Channel

The offline distribution channel dominates with 55.0% market share in 2025, as consumers continue to favor in-store purchases for personal care and cosmetic products. Supermarkets, pharmacies, and specialty beauty stores remain trusted touchpoints for product evaluation, tactile experience, and expert recommendations.

Offline shopping also caters well to premium and high-involvement products such as skincare and baby care, where consumers often seek authenticity assurance and compatibility trials.

In-store promotions, shelf visibility, and real-time customer engagement contribute significantly to brand loyalty and conversion rates. Despite the rise of e-commerce, offline retail maintains a strong foothold, particularly in regions with limited digital infrastructure. The segment’s resilience is supported by evolving retail strategies focused on experiential shopping and hybrid models.

What are the Drivers, Restraints, and Key Trends of the Cocoglycerides Market?

From 2025 to 2035, natural ingredient validation and clean beauty trends were central to market expansion, with sustainability-focused brands adopting cocoglycerides as preferred alternatives to synthetic emollients. Advanced processing technologies ensuring consistent quality and enhanced functionality became key differentiators. Growing consumer awareness of coconut-derived ingredients’ benefits and environmental advantages supported market growth across all application segments.

Clean Beauty Movement Drives Cocoglycerides Adoption

The accelerating shift toward clean, natural beauty products has been identified as the primary catalyst for growth in the cocoglycerides market. By 2025, demand was elevated as cosmetic formulators recommended plant-based emollients for sensitive skin applications and organic product certifications. Scientific validation of cocoglycerides’ skin-conditioning benefits and safety profile has demonstrated superior compatibility with natural formulation systems compared to synthetic alternatives.

Multifunctional Ingredient Innovation Creates Market Opportunities

In 2024, cosmetic manufacturers began integrating advanced cocoglycerides grades with enhanced emulsification and stabilization properties, supported by improved processing technologies that preserve natural characteristics while optimizing performance.

By 2025, specialized cocoglycerides variants were being deployed in premium formulations requiring multifunctional ingredients that combine emollient, emulsifier, and texture-enhancing properties. These implementations demonstrate that cocoglycerides can evolve from basic emollient ingredients to sophisticated multifunctional components enabling innovative cosmetic formulations.
Analysis of Cocoglycerides Market by Key Countries

Cocoglycerides Market Country Wise Analysis

Country CAGR
China 6.8%
India 6.2%
Germany 5.7%
France 5.4%
UK 4.9%

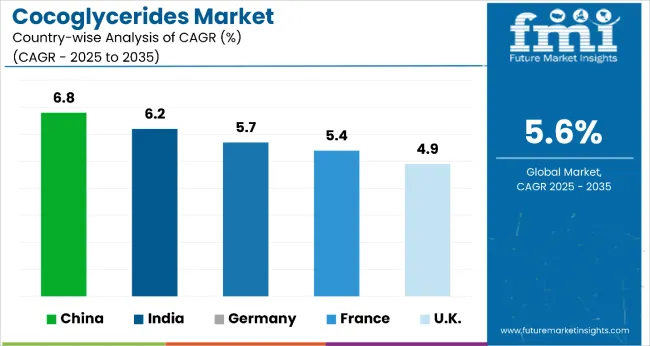
China leads the cocoglycerides market with a strong CAGR of 6.8%. Growth is driven by domestic cosmetics manufacturing and support for natural formulations. India follows with a 6.2% CAGR, fueled by Ayurvedic integration and rising clean beauty demand. Germany sees 5.7% growth, led by organic-certified ingredients. France grows at 5.4%, supported by dermocosmetics and REACH compliance. The UK, at 4.9%, trails but remains active with clean-label trends, vegan beauty products, and innovation from DTC and indie brands.

The report covers an in-depth analysis of 40+ countries; five top performing OECD countries are highlighted below.

Market Expansion Trends in Cocoglycerides Market in China

The cocoglycerides market in China is projected to grow at a CAGR of 6.8% from 2025 to 2035, outperforming the global average by 1.5%. The growth is linked to expanding domestic cosmetic manufacturing in Guangdong, Shanghai, and Zhejiang provinces. Natural ingredient formulations are widely adopted in premium skincare and beauty products targeting affluent urban consumers.

Output has been expanded by government support for sustainable ingredient sourcing and clean beauty product development. Processed cocoglycerides are increasingly integrated into domestic brand formulations and export-oriented cosmetic manufacturing.

More than 55% of production supports high-end skincare applications catering to demand from tier-1 cities and international markets. Local brands have also increased cocoglycerides integration in natural beauty products, especially targeting millennials and Gen Z consumers.

  • 2.8 million kg of processed cocoglycerides consumed in Chinese cosmetic manufacturing in 2024
  • 142 cosmetic manufacturing facilities integrated cocoglycerides in premium formulations in 2023 to 2024
  • 62% of China's cosmetic ingredient imports included coconut-derived emollients in 2024

Growth Opportunities in Cocoglycerides Market in India

Cocoglycerides revenue in India is forecast to grow at a CAGR of 6.2% from 2025 to 2035, ahead of the global average by 0.9%. Urban regions, particularly Mumbai, Delhi, and Bangalore, have expanded consumption of premium beauty products containing natural emollients and coconut-derived ingredients.

Government-backed initiatives are supporting Ayurvedic cosmetic formulations integrating traditional and modern ingredients. Beauty brands have shifted toward natural ingredient portfolios to address growing consumer awareness of clean beauty products. Export-grade cosmetic ingredients are gaining traction in European and North American markets.

Domestic manufacturing of cocoglycerides-containing products is increasing as local brands expand premium product lines. Regional distribution networks for natural cosmetic ingredients are strengthening across tier-2 and tier-3 cities.

  • 1.6 million kg of cocoglycerides processed for cosmetic applications in India during FY 2024
  • 35% year-on-year growth in natural cosmetic ingredient consumption between 2023 to 2024
  • 980 beauty formulations incorporated cocoglycerides across twelve states in 2024

Market Development in Cocoglycerides Market in Germany

Demand for cocoglycerides in Germany is expected to grow at a CAGR of 5.7% from 2025 to 2035, exceeding the global rate by 0.4%. Growth is centered on premium cosmetic formulation and organic beauty product development in cities such as Munich, Hamburg, and Berlin. Natural emollients with certified organic status are being specified for luxury skincare formulations and pharmaceutical applications.

Import volumes from sustainable suppliers have increased, particularly from certified organic and fair-trade sources. Processed products with EU organic certification are favored under strict quality and environmental standards. Most adoption is driven by luxury beauty brands and specialized cosmetic manufacturers focusing on natural ingredient formulations. Advanced cocoglycerides grades have also gained share in dermatological applications, especially in sensitive skin and therapeutic cosmetic products.

  • 1.2 million kg of certified organic cocoglycerides imported into Germany in 2024
  • 78% of cocoglycerides imports met EU organic certification standards in FY 2024
  • 630 premium cosmetic formulations used cocoglycerides in German market in 2023 to 2024

Demand Analysis for Cocoglycerides in France by Application

Sales of cocoglycerides in France are witnessing a steady CAGR of 5.4%, driven by its leadership in high-end cosmetics, skincare, and dermocosmetics. The nation’s strong heritage in personal care formulation, supported by major cosmetic clusters in Paris and Lyon, makes it a hotspot for coconut-derived emulsifiers. Cocoglycerides are being increasingly adopted in anti-aging and baby care products due to their mild, non-comedogenic, and biodegradable properties.

France’s strict adherence to EU REACH standards and push toward natural, plant-based ingredients also encourage companies to shift from synthetic to bio-based esters. French cosmetic giants are incorporating these emollients into natural formulations to appeal to ingredient-conscious consumers. Furthermore, its pharma-cosmetic segment is integrating cocoglycerides in topical ointments and sensitive skin applications.

  • Leading clean-beauty brands are formulating with cocoglycerides for premium product textures
  • Regulatory compliance with REACH supports coconut-based alternatives to petrochemical esters
  • Strong export growth of dermocosmetic products drives cocoglyceride volume

UK Cocoglycerides Market Growth Analysis

The UK cocoglycerides revenue is advancing at a CAGR of 4.9%, backed by its proactive clean-label movement, ethical sourcing frameworks, and premiumization trends in personal care. Cocoglycerides are gaining traction as sustainable emollients in a wide range of applications-from moisturizers and body oils to food emulsifiers.

UK formulators prefer multifunctional ingredients like cocoglycerides for their moisturizing, thickening, and stabilizing properties, especially in organic and vegan-certified products. Stringent labeling requirements and growing consumer aversion to synthetic additives are driving up demand for naturally derived esters.

In addition, the rise of DTC (direct-to-consumer) brands is accelerating innovations that highlight ingredients like cocoglycerides in marketing claims. With established players like Unilever and emerging indie brands alike reformulating their products, the UK is cementing itself as a cocoglyceride-forward market.

  • UK brands are prioritizing clean-label and traceable ingredient sourcing
  • Cocoglycerides are featured in vegan, cruelty-free, and sensitive-skin skincare products
  • Growing DTC brands are leveraging ingredient transparency as a USP

Competitive Landscape of Cocoglycerides Market


The market is moderately consolidated, with Cargill leading at an estimated 16.8% market share. The company holds a dominant position through its integrated coconut oil supply chain, advanced processing capabilities, and established relationships with major cosmetic and personal care manufacturers requiring consistent quality natural ingredients.

Key players include Archer Daniels Midland Company, BASF SE, KLK OLEO, Stepan Company, Lonza Group Ltd., Kao Corporation, DeWolf Chemical, COSME ITALY, and Nicozyme Inc., each providing specialized cocoglycerides solutions including various grades and purities for cosmetic, personal care, and pharmaceutical applications, supported by technical expertise and regulatory compliance capabilities.

Market demand is driven by growing consumer preference for natural ingredients, expanding clean beauty trends, and increasing regulatory support for bio-based cosmetic ingredients. Competition focuses on product quality consistency, sustainable sourcing practices, and technical support for cosmetic formulation optimization.

Key Developments in Cocoglycerides Market

  • In April 2025, BASF expanded its natural ingredient portfolio by launching Verdessence® Maize, Lamesoft® OP Plus, and Dehyton® PK45 GA/RA, derived from certified coconut oil. These biodegradable ingredients cater to clean beauty trends and will be showcased under BASF’s Longevity Ecosystem at in-cosmetics Global in Amsterdam.

Scope of the Report - Cocoglycerides Market

Item Value
Quantitative Units USD 508.8 Million
Application Baby Care Products, Lotions, Powder, Cream, Oils, Bath Products, Eye Lotion, Eye Makeup, Eye Liner, Fragrance Products, Personal Hygiene, Skincare Products
Distribution Channel Online and Offline
Regions Covered North America, Europe, Asia-Pacific, Latin America, Middle East & Africa
Country Covered United States, Canada, Germany, France, United Kingdom, China, Japan, India, Brazil, South Africa, Australia, and 40+ countries
Key Companies Profiled Cargill, Archer Daniels Midland Company, Galam Ltd., Kao Corporation, Nicozyme Inc., Lonza Group Ltd., Stepan Company, COSME ITALY, DeWolf Chemical, BASF SE, KLK OLEO.
Additional Attributes Dollar sales by application and form categories, growing usage in natural cosmetic formulations and clean beauty products, stable demand in premium skincare and pharmaceutical applications, innovations in processing technologies and quality enhancement improve functionality, sustainability, and regulatory compliance

Key Segments

By Application:

  • Baby Care Products
  • Lotions
  • Powder
  • Cream
  • Oils
  • Bath Products
  • Eye Lotion
  • Eye Makeup
  • Eye Liner
  • Fragrance Products
  • Personal Hygiene
  • Skincare Products

By Distribution Channel:

  • Online
  • Offline

By Region:

  • North America
  • Latin America
  • Western Europe
  • Eastern Europe
  • East Asia
  • South Asia & Pacific
  • Middle East and Africa

Table of Content

  1. Executive Summary
    • Global Market Outlook
    • Demand-side Trends
    • Supply-side Trends
    • Technology Roadmap Analysis
    • Analysis and Recommendations
  2. Market Overview
    • Market Coverage / Taxonomy
    • Market Definition / Scope / Limitations
  3. Market Background
    • Market Dynamics
      • Drivers
      • Restraints
      • Opportunity
      • Trends
    • Scenario Forecast
      • Demand in Optimistic Scenario
      • Demand in Likely Scenario
      • Demand in Conservative Scenario
    • Opportunity Map Analysis
    • Product Life Cycle Analysis
    • Supply Chain Analysis
      • Supply Side Participants and their Roles
        • Producers
        • Mid-Level Participants (Traders/ Agents/ Brokers)
        • Wholesalers and Distributors
      • Value Added and Value Created at Node in the Supply Chain
      • List of Raw Material Suppliers
      • List of Existing and Potential Buyer’s
    • Investment Feasibility Matrix
    • Value Chain Analysis
      • Profit Margin Analysis
      • Wholesalers and Distributors
      • Retailers
    • PESTLE and Porter’s Analysis
    • Regulatory Landscape
      • By Key Regions
      • By Key Countries
    • Regional Parent Market Outlook
    • Production and Consumption Statistics
    • Import and Export Statistics
  4. Global Market Analysis 2020 to 2024 and Forecast, 2025 to 2035
    • Historical Market Size Value (USD Million) & Volume (Metric Tons) Analysis, 2020 to 2024
    • Current and Future Market Size Value (USD Million) & Volume (Metric Tons) Projections, 2025 to 2035
      • Y-o-Y Growth Trend Analysis
      • Absolute $ Opportunity Analysis
  5. Global Market Pricing Analysis 2020 to 2024 and Forecast 2025 to 2035
  6. Global Market Analysis 2020 to 2024 and Forecast 2025 to 2035, By Application
    • Introduction / Key Findings
    • Historical Market Size Value (USD Million) & Volume (Metric Tons) Analysis By Application, 2020 to 2024
    • Current and Future Market Size Value (USD Million) & Volume (Metric Tons) Analysis and Forecast By Application, 2025 to 2035
      • Baby Care Products
      • Lotions
      • Powder
      • Cream
      • Oils
      • Bath Products
      • Eye Lotion
      • Eye Makeup
      • Eye Liner
      • Fragrance Products
      • Personal Hygiene
      • Skincare Products
    • Y-o-Y Growth Trend Analysis By Application, 2020 to 2024
    • Absolute $ Opportunity Analysis By Application, 2025 to 2035
  7. Global Market Analysis 2020 to 2024 and Forecast 2025 to 2035, By Distribution Channel
    • Introduction / Key Findings
    • Historical Market Size Value (USD Million) & Volume (Metric Tons) Analysis By Distribution Channel, 2020 to 2024
    • Current and Future Market Size Value (USD Million) & Volume (Metric Tons) Analysis and Forecast By Distribution Channel, 2025 to 2035
      • Online
      • Offline
    • Y-o-Y Growth Trend Analysis By Distribution Channel, 2020 to 2024
    • Absolute $ Opportunity Analysis By Distribution Channel, 2025 to 2035
  8. Global Market Analysis 2020 to 2024 and Forecast 2025 to 2035, By Region
    • Introduction
    • Historical Market Size Value (USD Million) & Volume (Metric Tons) Analysis By Region, 2020 to 2024
    • Current Market Size Value (USD Million) & Volume (Metric Tons) Analysis and Forecast By Region, 2025 to 2035
      • North America
      • Latin America
      • Western Europe
      • Eastern Europe
      • East Asia
      • South Asia & Pacific
      • Middle East and Africa
    • Market Attractiveness Analysis By Region
  9. North America Market Analysis 2020 to 2024 and Forecast 2025 to 2035, By Country
    • Historical Market Size Value (USD Million) & Volume (Metric Tons) Trend Analysis By Market Taxonomy, 2020 to 2024
    • Market Size Value (USD Million) & Volume (Metric Tons) Forecast By Market Taxonomy, 2025 to 2035
      • By Country
        • USA
        • Canada
        • Mexico
      • By Application
      • By Distribution Channel
    • Market Attractiveness Analysis
      • By Country
      • By Application
      • By Distribution Channel
    • Key Takeaways
  10. Latin America Market Analysis 2020 to 2024 and Forecast 2025 to 2035, By Country
    • Historical Market Size Value (USD Million) & Volume (Metric Tons) Trend Analysis By Market Taxonomy, 2020 to 2024
    • Market Size Value (USD Million) & Volume (Metric Tons) Forecast By Market Taxonomy, 2025 to 2035
      • By Country
        • Brazil
        • Argentina
        • Rest of LATAM
      • By Application
      • By Distribution Channel
    • Market Attractiveness Analysis
      • By Country
      • By Application
      • By Distribution Channel
    • Key Takeaways
  11. Western Europe Market Analysis 2020 to 2024 and Forecast 2025 to 2035, By Country
    • Historical Market Size Value (USD Million) & Volume (Metric Tons) Trend Analysis By Market Taxonomy, 2020 to 2024
    • Market Size Value (USD Million) & Volume (Metric Tons) Forecast By Market Taxonomy, 2025 to 2035
      • By Country
        • Germany
        • Italy
        • France
        • UK
        • Spain
        • BENELUX
        • Nordic
        • Rest of W.Europe
      • By Application
      • By Distribution Channel
    • Market Attractiveness Analysis
      • By Country
      • By Application
      • By Distribution Channel
    • Key Takeaways
  12. Eastern Europe Market Analysis 2020 to 2024 and Forecast 2025 to 2035, By Country
    • Historical Market Size Value (USD Million) & Volume (Metric Tons) Trend Analysis By Market Taxonomy, 2020 to 2024
    • Market Size Value (USD Million) & Volume (Metric Tons) Forecast By Market Taxonomy, 2025 to 2035
      • By Country
        • Russia
        • Hungary
        • Poland
        • Balkan & Baltics
        • Rest of E. Europe
      • By Application
      • By Distribution Channel
    • Market Attractiveness Analysis
      • By Country
      • By Application
      • By Distribution Channel
    • Key Takeaways
  13. East Asia Market Analysis 2020 to 2024 and Forecast 2025 to 2035, By Country
    • Historical Market Size Value (USD Million) & Volume (Metric Tons) Trend Analysis By Market Taxonomy, 2020 to 2024
    • Market Size Value (USD Million) & Volume (Metric Tons) Forecast By Market Taxonomy, 2025 to 2035
      • By Country
        • China
        • Japan
        • South Korea
      • By Application
      • By Distribution Channel
    • Market Attractiveness Analysis
      • By Country
      • By Application
      • By Distribution Channel
    • Key Takeaways
  14. South Asia & Pacific Market Analysis 2020 to 2024 and Forecast 2025 to 2035, By Country
    • Historical Market Size Value (USD Million) & Volume (Metric Tons) Trend Analysis By Market Taxonomy, 2020 to 2024
    • Market Size Value (USD Million) & Volume (Metric Tons) Forecast By Market Taxonomy, 2025 to 2035
      • By Country
        • India
        • Australia & New Zealand
        • ASEAN
        • Rest of SAP
      • By Application
      • By Distribution Channel
    • Market Attractiveness Analysis
      • By Country
      • By Application
      • By Distribution Channel
    • Key Takeaways
  15. Middle East and Africa Market Analysis 2020 to 2024 and Forecast 2025 to 2035, By Country
    • Historical Market Size Value (USD Million) & Volume (Metric Tons) Trend Analysis By Market Taxonomy, 2020 to 2024
    • Market Size Value (USD Million) & Volume (Metric Tons) Forecast By Market Taxonomy, 2025 to 2035
      • By Country
        • GCC Countries
        • Northern Africa
        • South Africa
        • Turkiye
        • Rest of MEA
      • By Application
      • By Distribution Channel
    • Market Attractiveness Analysis
      • By Country
      • By Application
      • By Distribution Channel
    • Key Takeaways
  16. Key Countries Market Analysis
    • USA
      • Pricing Analysis
      • Market Share Analysis, 2024
        • By Application
        • By Distribution Channel
    • Canada
      • Pricing Analysis
      • Market Share Analysis, 2024
        • By Application
        • By Distribution Channel
    • Brazil
      • Pricing Analysis
      • Market Share Analysis, 2024
        • By Application
        • By Distribution Channel
    • Mexico
      • Pricing Analysis
      • Market Share Analysis, 2024
        • By Application
        • By Distribution Channel
    • Argentina
      • Pricing Analysis
      • Market Share Analysis, 2024
        • By Application
        • By Distribution Channel
  17. Market Structure Analysis
    • Competition Dashboard
    • Competition Benchmarking
    • Market Share Analysis of Top Players
      • By Regional
      • By Application
      • By Distribution Channel
  18. Competition Analysis
    • Competition Deep Dive
      • Cargill
        • Overview
        • Product Portfolio
        • Profitability by Market Segments (Product/Age /Sales Channel/Region)
        • Sales Footprint
        • Strategy Overview
          • Marketing Strategy
          • Product Strategy
          • Channel Strategy
      • Archer Daniels Midland Company
        • Overview
        • Product Portfolio
        • Profitability by Market Segments (Product/Age /Sales Channel/Region)
        • Sales Footprint
        • Strategy Overview
          • Marketing Strategy
          • Product Strategy
          • Channel Strategy
      • Galam Ltd.
        • Overview
        • Product Portfolio
        • Profitability by Market Segments (Product/Age /Sales Channel/Region)
        • Sales Footprint
        • Strategy Overview
          • Marketing Strategy
          • Product Strategy
          • Channel Strategy
      • Kao Corporation
        • Overview
        • Product Portfolio
        • Profitability by Market Segments (Product/Age /Sales Channel/Region)
        • Sales Footprint
        • Strategy Overview
          • Marketing Strategy
          • Product Strategy
          • Channel Strategy
      • Nicozyme Inc.
        • Overview
        • Product Portfolio
        • Profitability by Market Segments (Product/Age /Sales Channel/Region)
        • Sales Footprint
        • Strategy Overview
          • Marketing Strategy
          • Product Strategy
          • Channel Strategy
      • Lonza Group Ltd.
        • Overview
        • Product Portfolio
        • Profitability by Market Segments (Product/Age /Sales Channel/Region)
        • Sales Footprint
        • Strategy Overview
          • Marketing Strategy
          • Product Strategy
          • Channel Strategy
      • Stepan Company
        • Overview
        • Product Portfolio
        • Profitability by Market Segments (Product/Age /Sales Channel/Region)
        • Sales Footprint
        • Strategy Overview
          • Marketing Strategy
          • Product Strategy
          • Channel Strategy
      • COSME ITALY
        • Overview
        • Product Portfolio
        • Profitability by Market Segments (Product/Age /Sales Channel/Region)
        • Sales Footprint
        • Strategy Overview
          • Marketing Strategy
          • Product Strategy
          • Channel Strategy
      • DeWolf Chemical
        • Overview
        • Product Portfolio
        • Profitability by Market Segments (Product/Age /Sales Channel/Region)
        • Sales Footprint
        • Strategy Overview
          • Marketing Strategy
          • Product Strategy
          • Channel Strategy
      • BASF SE
        • Overview
        • Product Portfolio
        • Profitability by Market Segments (Product/Age /Sales Channel/Region)
        • Sales Footprint
        • Strategy Overview
          • Marketing Strategy
          • Product Strategy
          • Channel Strategy
      • KLK OLEO
        • Overview
        • Product Portfolio
        • Profitability by Market Segments (Product/Age /Sales Channel/Region)
        • Sales Footprint
        • Strategy Overview
          • Marketing Strategy
          • Product Strategy
          • Channel Strategy
  19. Assumptions & Acronyms Used
  20. Research Methodology

List of Tables

  • Table 1: Global Market Value (USD Million) Forecast by Region, 2020-2035
  • Table 2: Global Market Volume (Metric Tons) Forecast by Region, 2020-2035
  • Table 3: Global Market Value (USD Million) Forecast by Application, 2020-2035
  • Table 4: Global Market Volume (Metric Tons) Forecast by Application, 2020-2035
  • Table 5: Global Market Value (USD Million) Forecast by Distribution Channel, 2020-2035
  • Table 6: Global Market Volume (Metric Tons) Forecast by Distribution Channel, 2020-2035
  • Table 7: North America Market Value (USD Million) Forecast by Country, 2020-2035
  • Table 8: North America Market Volume (Metric Tons) Forecast by Country, 2020-2035
  • Table 9: North America Market Value (USD Million) Forecast by Application, 2020-2035
  • Table 10: North America Market Volume (Metric Tons) Forecast by Application, 2020-2035
  • Table 11: North America Market Value (USD Million) Forecast by Distribution Channel, 2020-2035
  • Table 12: North America Market Volume (Metric Tons) Forecast by Distribution Channel, 2020-2035
  • Table 13: Latin America Market Value (USD Million) Forecast by Country, 2020-2035
  • Table 14: Latin America Market Volume (Metric Tons) Forecast by Country, 2020-2035
  • Table 15: Latin America Market Value (USD Million) Forecast by Application, 2020-2035
  • Table 16: Latin America Market Volume (Metric Tons) Forecast by Application, 2020-2035
  • Table 17: Latin America Market Value (USD Million) Forecast by Distribution Channel, 2020-2035
  • Table 18: Latin America Market Volume (Metric Tons) Forecast by Distribution Channel, 2020-2035
  • Table 19: Western Europe Market Value (USD Million) Forecast by Country, 2020-2035
  • Table 20: Western Europe Market Volume (Metric Tons) Forecast by Country, 2020-2035
  • Table 21: Western Europe Market Value (USD Million) Forecast by Application, 2020-2035
  • Table 22: Western Europe Market Volume (Metric Tons) Forecast by Application, 2020-2035
  • Table 23: Western Europe Market Value (USD Million) Forecast by Distribution Channel, 2020-2035
  • Table 24: Western Europe Market Volume (Metric Tons) Forecast by Distribution Channel, 2020-2035
  • Table 25: Eastern Europe Market Value (USD Million) Forecast by Country, 2020-2035
  • Table 26: Eastern Europe Market Volume (Metric Tons) Forecast by Country, 2020-2035
  • Table 27: Eastern Europe Market Value (USD Million) Forecast by Application, 2020-2035
  • Table 28: Eastern Europe Market Volume (Metric Tons) Forecast by Application, 2020-2035
  • Table 29: Eastern Europe Market Value (USD Million) Forecast by Distribution Channel, 2020-2035
  • Table 30: Eastern Europe Market Volume (Metric Tons) Forecast by Distribution Channel, 2020-2035
  • Table 31: East Asia Market Value (USD Million) Forecast by Country, 2020-2035
  • Table 32: East Asia Market Volume (Metric Tons) Forecast by Country, 2020-2035
  • Table 33: East Asia Market Value (USD Million) Forecast by Application, 2020-2035
  • Table 34: East Asia Market Volume (Metric Tons) Forecast by Application, 2020-2035
  • Table 35: East Asia Market Value (USD Million) Forecast by Distribution Channel, 2020-2035
  • Table 36: East Asia Market Volume (Metric Tons) Forecast by Distribution Channel, 2020-2035
  • Table 37: South Asia & Pacific Market Value (USD Million) Forecast by Country, 2020-2035
  • Table 38: South Asia & Pacific Market Volume (Metric Tons) Forecast by Country, 2020-2035
  • Table 39: South Asia & Pacific Market Value (USD Million) Forecast by Application, 2020-2035
  • Table 40: South Asia & Pacific Market Volume (Metric Tons) Forecast by Application, 2020-2035
  • Table 41: South Asia & Pacific Market Value (USD Million) Forecast by Distribution Channel, 2020-2035
  • Table 42: South Asia & Pacific Market Volume (Metric Tons) Forecast by Distribution Channel, 2020-2035
  • Table 43: Middle East and Africa Market Value (USD Million) Forecast by Country, 2020-2035
  • Table 44: Middle East and Africa Market Volume (Metric Tons) Forecast by Country, 2020-2035
  • Table 45: Middle East and Africa Market Value (USD Million) Forecast by Application, 2020-2035
  • Table 46: Middle East and Africa Market Volume (Metric Tons) Forecast by Application, 2020-2035
  • Table 47: Middle East and Africa Market Value (USD Million) Forecast by Distribution Channel, 2020-2035
  • Table 48: Middle East and Africa Market Volume (Metric Tons) Forecast by Distribution Channel, 2020-2035

List of Figures

  • Figure 1: Global Market Volume (Metric Tons) Forecast 2020-2035
  • Figure 2: Global Market Pricing Analysis
  • Figure 3: Global Market Value (USD Million) Forecast 2020-2035
  • Figure 4: Global Market Value Share and BPS Analysis by Application, 2025 and 2035
  • Figure 5: Global Market Y-o-Y Growth Comparison by Application, 2025-2035
  • Figure 6: Global Market Attractiveness Analysis by Application
  • Figure 7: Global Market Value Share and BPS Analysis by Distribution Channel, 2025 and 2035
  • Figure 8: Global Market Y-o-Y Growth Comparison by Distribution Channel, 2025-2035
  • Figure 9: Global Market Attractiveness Analysis by Distribution Channel
  • Figure 10: Global Market Value (USD Million) Share and BPS Analysis by Region, 2025 and 2035
  • Figure 11: Global Market Y-o-Y Growth Comparison by Region, 2025-2035
  • Figure 12: Global Market Attractiveness Analysis by Region
  • Figure 13: North America Market Incremental $ Opportunity, 2025-2035
  • Figure 14: Latin America Market Incremental $ Opportunity, 2025-2035
  • Figure 15: Western Europe Market Incremental $ Opportunity, 2025-2035
  • Figure 16: Eastern Europe Market Incremental $ Opportunity, 2025-2035
  • Figure 17: East Asia Market Incremental $ Opportunity, 2025-2035
  • Figure 18: South Asia & Pacific Market Incremental $ Opportunity, 2025-2035
  • Figure 19: Middle East and Africa Market Incremental $ Opportunity, 2025-2035
  • Figure 20: North America Market Value Share and BPS Analysis by Country, 2025 and 2035
  • Figure 21: North America Market Value Share and BPS Analysis by Application, 2025 and 2035
  • Figure 22: North America Market Y-o-Y Growth Comparison by Application, 2025-2035
  • Figure 23: North America Market Attractiveness Analysis by Application
  • Figure 24: North America Market Value Share and BPS Analysis by Distribution Channel, 2025 and 2035
  • Figure 25: North America Market Y-o-Y Growth Comparison by Distribution Channel, 2025-2035
  • Figure 26: North America Market Attractiveness Analysis by Distribution Channel
  • Figure 27: Latin America Market Value Share and BPS Analysis by Country, 2025 and 2035
  • Figure 28: Latin America Market Value Share and BPS Analysis by Application, 2025 and 2035
  • Figure 29: Latin America Market Y-o-Y Growth Comparison by Application, 2025-2035
  • Figure 30: Latin America Market Attractiveness Analysis by Application
  • Figure 31: Latin America Market Value Share and BPS Analysis by Distribution Channel, 2025 and 2035
  • Figure 32: Latin America Market Y-o-Y Growth Comparison by Distribution Channel, 2025-2035
  • Figure 33: Latin America Market Attractiveness Analysis by Distribution Channel
  • Figure 34: Western Europe Market Value Share and BPS Analysis by Country, 2025 and 2035
  • Figure 35: Western Europe Market Value Share and BPS Analysis by Application, 2025 and 2035
  • Figure 36: Western Europe Market Y-o-Y Growth Comparison by Application, 2025-2035
  • Figure 37: Western Europe Market Attractiveness Analysis by Application
  • Figure 38: Western Europe Market Value Share and BPS Analysis by Distribution Channel, 2025 and 2035
  • Figure 39: Western Europe Market Y-o-Y Growth Comparison by Distribution Channel, 2025-2035
  • Figure 40: Western Europe Market Attractiveness Analysis by Distribution Channel
  • Figure 41: Eastern Europe Market Value Share and BPS Analysis by Country, 2025 and 2035
  • Figure 42: Eastern Europe Market Value Share and BPS Analysis by Application, 2025 and 2035
  • Figure 43: Eastern Europe Market Y-o-Y Growth Comparison by Application, 2025-2035
  • Figure 44: Eastern Europe Market Attractiveness Analysis by Application
  • Figure 45: Eastern Europe Market Value Share and BPS Analysis by Distribution Channel, 2025 and 2035
  • Figure 46: Eastern Europe Market Y-o-Y Growth Comparison by Distribution Channel, 2025-2035
  • Figure 47: Eastern Europe Market Attractiveness Analysis by Distribution Channel
  • Figure 48: East Asia Market Value Share and BPS Analysis by Country, 2025 and 2035
  • Figure 49: East Asia Market Value Share and BPS Analysis by Application, 2025 and 2035
  • Figure 50: East Asia Market Y-o-Y Growth Comparison by Application, 2025-2035
  • Figure 51: East Asia Market Attractiveness Analysis by Application
  • Figure 52: East Asia Market Value Share and BPS Analysis by Distribution Channel, 2025 and 2035
  • Figure 53: East Asia Market Y-o-Y Growth Comparison by Distribution Channel, 2025-2035
  • Figure 54: East Asia Market Attractiveness Analysis by Distribution Channel
  • Figure 55: South Asia & Pacific Market Value Share and BPS Analysis by Country, 2025 and 2035
  • Figure 56: South Asia & Pacific Market Value Share and BPS Analysis by Application, 2025 and 2035
  • Figure 57: South Asia & Pacific Market Y-o-Y Growth Comparison by Application, 2025-2035
  • Figure 58: South Asia & Pacific Market Attractiveness Analysis by Application
  • Figure 59: South Asia & Pacific Market Value Share and BPS Analysis by Distribution Channel, 2025 and 2035
  • Figure 60: South Asia & Pacific Market Y-o-Y Growth Comparison by Distribution Channel, 2025-2035
  • Figure 61: South Asia & Pacific Market Attractiveness Analysis by Distribution Channel
  • Figure 62: Middle East and Africa Market Value Share and BPS Analysis by Country, 2025 and 2035
  • Figure 63: Middle East and Africa Market Value Share and BPS Analysis by Application, 2025 and 2035
  • Figure 64: Middle East and Africa Market Y-o-Y Growth Comparison by Application, 2025-2035
  • Figure 65: Middle East and Africa Market Attractiveness Analysis by Application
  • Figure 66: Middle East and Africa Market Value Share and BPS Analysis by Distribution Channel, 2025 and 2035
  • Figure 67: Middle East and Africa Market Y-o-Y Growth Comparison by Distribution Channel, 2025-2035
  • Figure 68: Middle East and Africa Market Attractiveness Analysis by Distribution Channel
  • Figure 69: Global Market - Tier Structure Analysis
  • Figure 70: Global Market - Company Share Analysis

Frequently Asked Questions

How big is the cocoglycerides market in 2025?

The global cocoglycerides market is estimated to be valued at USD 508.8 million in 2025.

What will be the size of the cocoglycerides market in 2035?

The market size for the cocoglycerides market is projected to reach USD 877.4 million by 2035.

How much will the cocoglycerides market grow between 2025 and 2035?

The cocoglycerides market is expected to grow at a 5.6% CAGR between 2025 and 2035.

Which application segment is projected to lead in the cocoglycerides market in 2025?

The skincare products segment is projected to lead in the cocoglycerides market with 52% market share in 2025.

Which distribution channel is expected to dominate the cocoglycerides market in 2025?

The offline segment is expected to dominate the cocoglycerides market with 55.0% market share in 2025.

Future Market Insights

Cocoglycerides Market